. 2025 Jun 28;28(8):112764.
doi: 10.1016/j.isci.2025.112764. eCollection 2025 Aug 15.

Parabrachial Foxp2-expressing neurons are necessary for sustaining core body temperature in the cold

Affiliations

Parabrachial Foxp2-expressing neurons are necessary for sustaining core body temperature in the cold

Fillan S Grady et al. iScience. .

Abstract

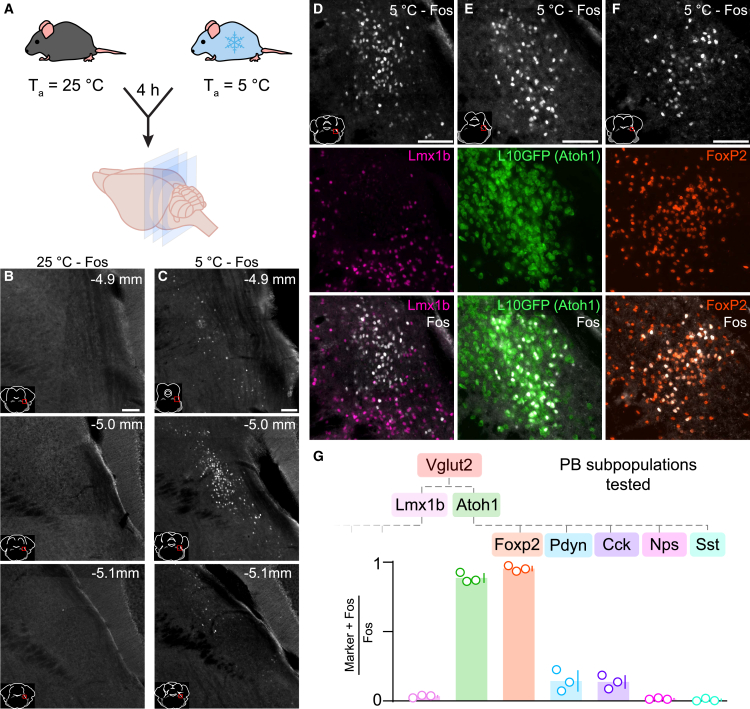
Cold environmental temperature is a threat to survival. Sustaining core body temperature in the cold requires a dynamic set of adaptive responses known as "cold defense," but the neural circuitry orchestrating these responses remains unclear. We identified a cluster of Atoh1-derived, Foxp2-expressing glutamatergic neurons in the lateral parabrachial nucleus (PB) that are activated by exposing mice to cold environmental temperature. Eliminating Foxp2-expressing PB neurons caused body temperature to plummet in the cold. Mice lacking these neurons had normal wakefulness, movement and appetite at room temperature, and their autonomic cold-defense responses remained intact. However, these mice had reduced metabolism and locomotor activity in the cold, and thermal discrimination was impaired. Our results indicate that thermosensory information relayed through Foxp2-expressing PB neurons is essential for sensing and surviving a cold environment.

Keywords: Biological sciences; Natural sciences; Neuroscience; Physiology; Sensory neuroscience; Systems neuroscience.


Conflict of interest statement

The authors declare no competing interests.

Figures

None
Graphical abstract
Figure 1
Figure 1
Cold environmental temperature activates a genetically defined subpopulation of brainstem neurons (A) Schematic of Fos experiment. (B) Exposing mice to 25°C induces minimal Fos in the PB. Number in top right indicates mm caudal to bregma. (C) Exposing mice to 5°C induces a cluster of Fos in the lateral PB. (D) Cold-induced Fos does not colocalize with Lmx1b-immunoreactive neurons. (E) Cold-induced Fos colocalizes with Atoh1-derived neurons. (F) Cold-induced Fos colocalizes with FoxP2-immunoreactive neurons. (G) Molecular ontology of tested PB neuronal subpopulations with sensitivity of various markers for cold-activated PB neurons. Data represented as group mean ± standard deviation, with individual data points (n = 3 for all groups). All scale bars 100 μm. Abbreviations: See Star Methods.
Figure 2
Figure 2
Parabrachial neurons are necessary for cold-defense thermoregulation (A) Ablation strategy. (B) An example mouse injected with the control vector continues to report GFP in PB glutamatergic neurons. (C) An example mouse injected with the ablation vector demonstrates a loss of GFP-expressing neurons in the PB. (D) PBVglut2 ablation mice (n = 13 vs. 7 mCh controls) do not have a thermoregulation deficit at 25°C ambient temperature (Ta), two-tailed T-test. (E) Without correcting for the exact Ta in each cage, these PBVglut2 mice have no significant difference in core temperature at a warm (35°C) Ta, two-tailed T-test. (F) Exposing mice to 5°C Ta causes core temperature to plummet in ablation mice (n = 4) but not mCh control mice (n = 4). Cervically dislocated mice (n = 4) become cold even faster. (G) Temperature change versus temperature in the same mice. (H) Ta during cold exposure of all n = 99 ablation and control mice. (I) Core body temperature of PBVglut2 ablation (n = 13) and control (n = 7) mice during cold exposure. (J) Lmx1b-immunoreactive neurons remain after control vector injection in a Lmx1b-2A-Cre mouse. (K) Lmx1b-immunoreactive neurons are deleted after ablation vector injection in a Lmx1b-2A-Cre mouse. (L) Core body temperature of PBLmx1b ablation (n = 8) and control (n = 9) mice during cold exposure. (M) FoxP2-immunoreactive neurons remain after control vector injection in a Foxp2-IRES-Cre mouse. (N) FoxP2-immunoreactive neurons are deleted after ablation vector injection in a Foxp2-IRES-Cre mouse. (O) Core body temperature of PBFoxp2 ablation (n = 9) and control (n = 6) mice during cold exposure. (P) Core temperature decline over 4 h in different genotypes of ablation and control mice, two-tailed T-test (PBPdynn = 8 vs. 5 mCh controls; PBCckn = 8 vs. 4 mCh controls; PBNpsn = 6 vs. 7 mCh controls; PBSstn = 6 vs. 3 mCh controls). (Q) Ablation mice with fewer Vglut2-reporting PB neurons remaining reach lower core temperatures during cold-exposure (PBVglut2n = 11 vs. 7 mCh controls). (R) Ablation mice with fewer Foxp2-immunoreactive PB neurons remaining reach lower core temperatures during cold exposure (PBFoxp2n = 9 vs. 6 mCh controls). Bar graphs represent group mean with individual data points; time series represent group mean ± standard deviation, n as displayed on the figure. All scale bars 200 μm.
Figure 3
Figure 3
Glutamatergic parabrachial neurons are not necessary for wakefulness (A) Ablation strategy and examples of PBVglut2 mice injected with the control and ablation vector. (B) Video Locomotor Activity in these same, representative control and ablation mice. (C) The amount of time mice spent active did not correlate with the number of remaining PBVglut2 neurons. (D) Representative 24-h hypnograms, EEG spectra, and EMGs from a control and an ablation mouse. (E) Mean proportion of time spent in each state for control and ablation mice. (F) PBVglut2 ablation mice had shorter wake and REM bouts, but not NREM bouts. (G) The amount of time mice spent awake did not correlate with the number of PBVglut2 neurons remaining. Time series represent group mean ± standard deviation. Group sizes for all analyses in this figure were PBVglut2 ablation n = 9 vs. n = 8 mCh control mice, except in panel (G) with n = 7 mCh control mice. Statistical tests: Pearson’s correlation coefficient for (C) and (G), and Student’s two-tailed t-test in (F). All scale bars 200 μm.
Figure 4
Figure 4
Ablating parabrachial subpopulations minimally affects body weight and appetite (A–C) Food intake during ad libitum access or after a 24-h fast in control and ablation mice (PBVglut2 ablation n = 9 vs. n = 11 mCh control; PBFoxp2 ablation n = 10 vs. n = 9 mCh control; PBLmx1b ablation n = 15 vs. n = 9 mCh control). Right panel shows average meal size during the first four hours after lights-off in ablation and control mice. (D–F) Weight gain after PB injection in all ablation and control mice (PBVglut2n = 28 vs. n = 20 mCh; PBFoxp2n = 25 vs. n = 17 mCh; PBLmx1bn = 17 vs. n = 11 mCh). (G–I) Water intake during ad libitum access or after a 24-h water deprivation in control and ablation mice (PBVglut2 ablation n = 12; other groups are the same as A–C). Right panel shows average “meal” size during the first four hours after lights-off in ablation and control mice. Data represented as group mean ± standard deviation with individual data points. All comparisons used Student’s two-tailed t-test.
Figure 5
Figure 5
PBFoxp2 neurons are not required for autonomic responses to cold exposure (A) Schematic of simultaneous core body temperature, video activity, and video thermography monitoring of cold-exposed mice. (B) Sample thermal image, with labels for interscapular brown adipose tissue (iBAT), rump temperature, and tail temperature. (C) Mean core temperature during 24 h of cold exposure. (D) Core temperatures of PBFoxp2 ablation mice plummets faster than control mice when cold-exposed without food. PBFoxp2 ablation mice are colder than control mice, but do not plummet, when cold-exposed with food. Thick lines represent group means, and thin lines represent individual cold-exposed mice without food. (E) Example PBFoxp2 ablation and control mouse. Core temperature of the ablation mouse plunges when placed in the cold without food, but not with food. (F) Hours of cold exposure until core temperature plunge to 25°C. Gray bar at top represents mice that did not have a core temperature plunge within the 24-h test. (G) In the same representative PBFoxp2 ablation and control mice shown in (E), iBAT temperature, corrected for rump temperature, increases during cold exposure. (H) Average iBAT temperature across the first three hours does not show a difference between groups. (I) Tail temperature decreases after cold exposure in the same representative mice. (J) Average tail temperature across the first three hours is not different between groups. (K) Movement of the same two, representative PBFoxp2 ablation and control mice, when cold-exposed with and without food. (L) Groups moved a similar amount in the first three hours. All data represented as group mean ± standard deviation with individual data points. Groups were n = 7 PBFoxp2 ablation and n = 7 mCh control mice, with two different food conditions tested in each group. Statistical comparisons were ANOVAs followed by post-hoc two-tailed t-test with Sidak correction. Scale bar in (B) is 1 cm.
Figure 6
Figure 6
PBFoxp2 neuronal ablation blunts increased metabolism in the cold (A) Group averages of PBFoxp2 ablation and mCh control mice over time; top panel shows core temperature, middle panel shows metabolic rate, and bottom panel shows ambient temperature. Bottom bar represents light/dark phase. Baseline, ad-lib fed, and fasted sections are periods of analysis, each 9 h long and beginning at the same time (ZT+1, 7 a.m.). (B and C) Respiratory Exchange Ratio (RER) increased in the cold with food available and decreased in the cold without food available. (D and E) Metabolic rate increased in the cold both with food and without food, compared to baseline. This effect is blunted in PBFoxp2 ablation mice. (F and G) Average movement speed in the cold in both conditions. (H and I) Control mice moved more in the cold, both with and without food, compared to baseline. PBFoxp2 ablation mice increased their movement less than control animals in the cold with food, but not without food. (J) PBFoxp2 ablation and control mice consumed similar amounts of food at baseline; during cold exposure ablation mice had a divergent response without a statistically significant difference relative to controls. (K) PBFoxp2 ablation and control mice had increased corticosterone levels after 4 h of cold exposure, without a difference between groups. (L) PBFoxp2 ablation and control mice had similar blood glucose levels after 4 h of cold exposure. Bar graphs represent group mean ± standard deviation with individual data points. Time series represent group mean ± standard deviation. Group sizes are PBFoxp2 ablation n = 7 vs. n = 6 mCh controls in all panels except for (E) and (I) with n = 5 mCh controls. All statistical comparisons were Student’s two-tailed t-tests.
Figure 7
Figure 7
PBFoxp2 ablation impairs thermal discrimination (A) Thermal gradient assay in which mice select their preferred environmental temperature. Top panel is a digital image of the assay, and bottom panel is a thermographic image with mice and lanes removed, along with a temperature scale. (B) Histograms of individual mCh control and PBFoxp2 ablation mouse temperature preference over the two-hour test. (C) Histograms of PBFoxp2 ablation and control group temperature preference. (D–G) (D) PBFoxp2 ablation mice compared to control mice preferred cooler environmental temperatures, (E) spent more time at temperatures below 25°C, and (F) had more variable temperature preference, but spent similar amounts of time moving (G). Data represented as group mean ± standard deviation with individual data points. Group sizes in all comparisons are PBFoxp2 ablation n = 7 vs. n = 7 mCh controls. All statistical comparisons were Student’s two-tailed T-tests. Scale bar in (A) is 10 cm.

Similar articles

References

    1. Morrison S.F., Nakamura K. Central mechanisms for thermoregulation. Annu. Rev. Physiol. 2019;81:285–308. doi: 10.1146/annurev-physiol-020518-114546. - DOI - PubMed
    1. Dhaka A., Murray A.N., Mathur J., Earley T.J., Petrus M.J., Patapoutian A. TRPM8 is required for cold sensation in mice. Neuron. 2007;54:371–378. - PubMed
    1. Bautista D.M., Siemens J., Glazer J.M., Tsuruda P.R., Basbaum A.I., Stucky C.L., Jordt S.-E., Julius D. The menthol receptor TRPM8 is the principal detector of environmental cold. Nature. 2007;448:204–208. - PubMed
    1. Ran C., Hoon M.A., Chen X. The coding of cutaneous temperature in the spinal cord. Nat. Neurosci. 2016;19:1201–1209. - PMC - PubMed
    1. Craig A.D., Krout K., Andrew D. Quantitative response characteristics of thermoreceptive and nociceptive lamina I spinothalamic neurons in the cat. J. Neurophysiol. 2001;86:1459–1480. - PubMed

LinkOut - more resources