. 2025 Jul 18:20:9135-9153.
doi: 10.2147/IJN.S512005. eCollection 2025.

Co-Assembled Nanoparticles Comprising Sorafenib and Hederagenin Derivative for Enhanced Anti-Hepatic Fibrosis Activity

Affiliations

Co-Assembled Nanoparticles Comprising Sorafenib and Hederagenin Derivative for Enhanced Anti-Hepatic Fibrosis Activity

Mingjun Lu et al. Int J Nanomedicine. .

Abstract

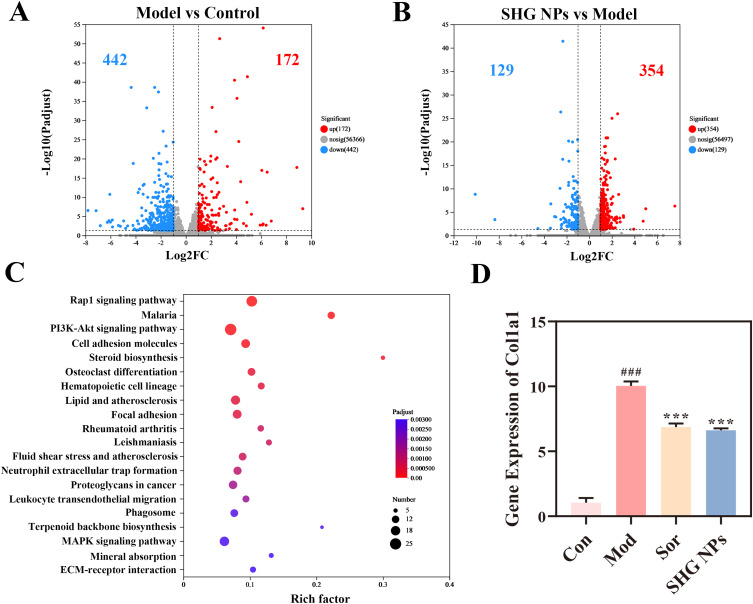
Background: Sorafenib, a multi-kinase inhibitor, has emerged as a promising therapeutic agent for liver fibrosis due to its ability to target key signaling pathways involved in HSC activation. However, it may inadvertently exacerbate inflammatory responses at certain doses. Recent findings suggest that targeting the STING signaling pathway may provide an alternative strategy for slowing the progression of fibrosis.

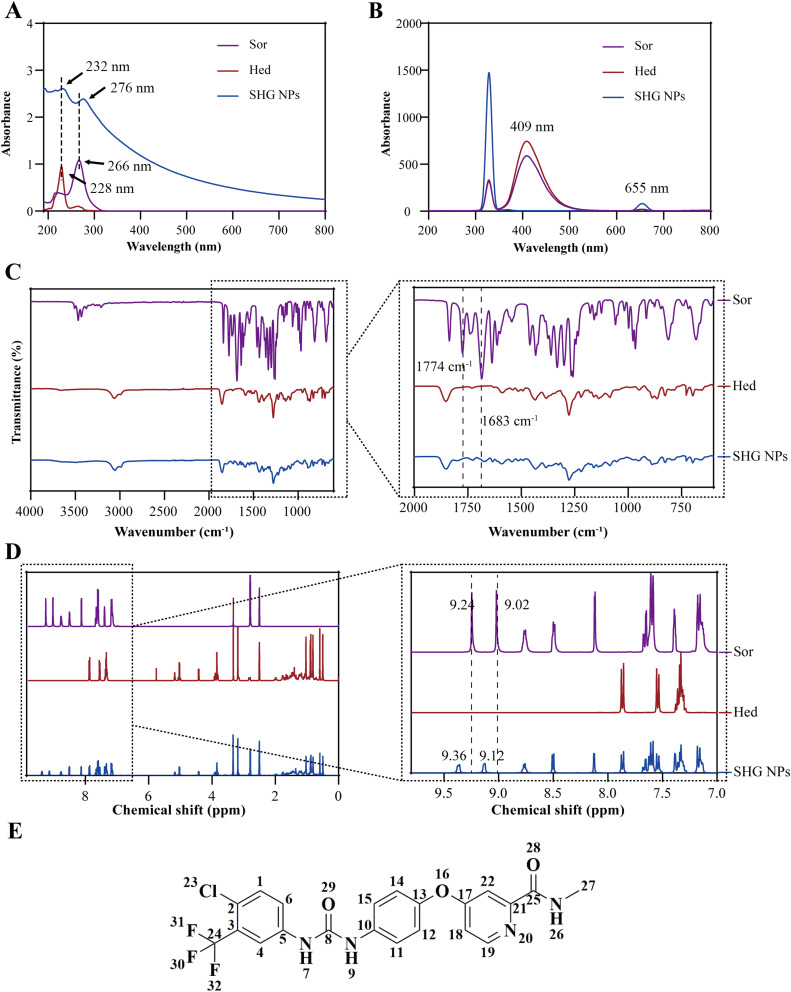
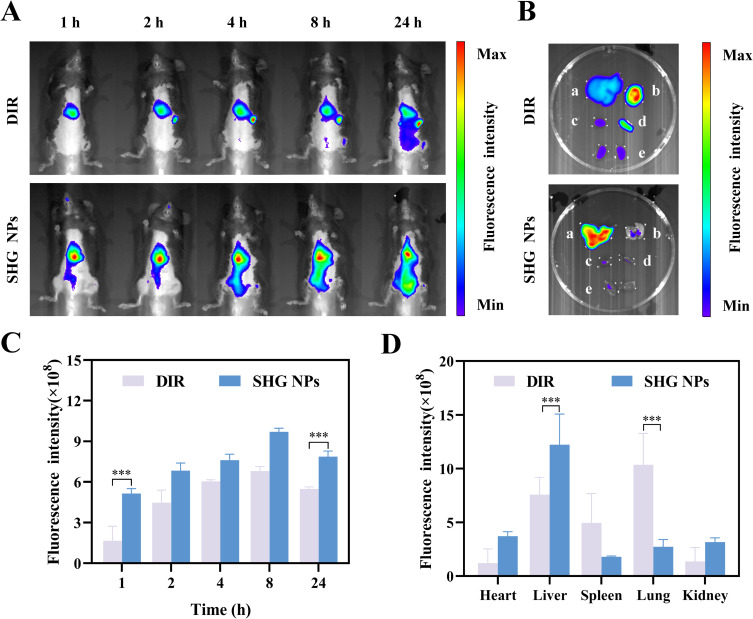
Methods: We synthesized liver-targeted co-assembled SHG nanoparticles (SHG NPs) that incorporate sorafenib and a hederagenin derivative (Hed), which acted as a STING pathway inhibitor. SHG NPs are preferentially endocytosed by hepatocytes via DSPE-PEG-Gal-mediated ASGPR targeting. After release from hepatocytes, sorafenib diffuses into adjacent HSCs through concentration gradients, effectively inhibiting PDGFR/TGF-β signaling. Hed exhibits dual-targeting characteristics: (1) its STING inhibitory activity selectively acts on macrophage-mediated inflammation; (2) the enhanced phagocytic capacity of Kupffer cells in fibrotic livers promotes non-specific uptake. This spatiotemporal release pattern, combined with pathway-specific pharmacodynamics, ensures synergistic anti-fibrotic effects.

Results: In this study, SHG NPs have been successfully formulated with well-defined nanostructures and uniform sizes (115.1 nm). In vitro Sirius Red staining demonstrated that SHG NPs inhibited collagen deposition by 57.5 ± 2.3%, significantly higher than the inhibition observed with sorafenib alone (24.8 ± 1.8%). Furthermore, cell uptake studies confirmed enhanced uptake of SHG NPs in ASGPR-overexpressing cell lines, which was attributed to the presence of galactose on their surface. Additionally, in vivo anti-liver fibrosis activity experiments further confirmed that SHG NPs exhibit superior therapeutic efficacy compared to sorafenib.

Conclusion: Our research indicates that formulating sorafenib with a STING pathway inhibitor into liver-targeted nanoparticles represents a potentially effective strategy for the treatment of liver fibrosis.

Keywords: STING pathway; co-assembly; hederagenin; liver fibrosis; sorafenib.


Conflict of interest statement

The authors declare that they have no competing interests in this work.

Figures

None
Graphical abstract
Scheme 1
Scheme 1
Synthesis of Hed. Reagents and conditions: (a) K2CO3, dry DMF, 85°C, reflux, 4 h; (b) EDCI, DMAP, dry CH2Cl2, r.t., 12 h.
Figure 1
Figure 1
Synthesis and characterization of SHG NPs. (A) Preparation process of the SHG NPs. (B): (I) Images of the Sor, Hed in aqueous solution. (II) Images of HED and Sor dissolved in THF:EtOH and dispersed in aqueous solution. (III) Images of the SHG NPs. (C) Size distribution of the SHG NPs. (D) SEM images of the SHG NPs, scale bar = 500 nm. (E) TEM images of the SHG NPs, scale bar = 100 nm.
Figure 2
Figure 2
Spectroscopic properties of the SHG NPs. (A) UV spectra of the SHG NPs. (B) Fluorescence spectra of the SHG NPs. (C) FTIR spectra of the SHG NPs. (D) NMR hydrogen spectra of the SHG NPs. (E) Atom numbers of Sor.
Figure 3
Figure 3
Molecular Dynamics Simulation of SHG NPs. (A) Structural changes in the SHG NPs in the initial and final states during the MD simulation. (B) Structural changes in the SHG NPs with time during the MD simulation. (C) Time-dependent changes of SASA during the co-assembly process. (D) Time-dependent changes of RMSD during the co-assembly process.
Figure 4
Figure 4
In vitro cell experiments. (A) MTT assay of JS-1 cells treated with Sor, Hed, S-H and SHG NPs. (B) The collagen inhibitory effect of Sor, Hed, S-H and SHG NPs. *P < 0.05, ***P < 0.001 compared to model group. ###P < 0.001 compared to control group. (C) Cellular uptake of SHG NPs. (D) Inhibition of IL-6 in LPS-induced RAW264.7 cells by Sor, Hed and SHG NPs. (E) Inhibition of TGF-β1 in LPS-induced RAW264.7 cells by Sor, Hed and SHG NPs. ***P < 0.001 compared to Sor group. ###P < 0.001 compared to Hed group.
Figure 5
Figure 5
In vivo bio-distribution. (A) The IVIS pictures of DIR and targeted SHG NPs at various time points. (B) Ex vivo images of livers (a), lungs (b), hearts (c), spleens (d) and kidneys(e) 24 h post-injection. (C) Quantitative analysis of liver fluorescence intensity over time. (D) Fluorescence intensity of livers, hearts, spleens, lungs and kidneys 24 h post-injection. ***P < 0.001 compared to DIR group.
Figure 6
Figure 6
Anti-liver fibrosis capacity of the SHG NPs in mice. (A) Schedule of SHG NPs treatment in fibrotic mice induced by CCl4. (B) Serum levels of AST. (C) Serum levels of ALT. (D) Serum levels of TBA. (E) Representative images of H&E-stained liver sections, scale bar = 100 μm. (Yellow arrows highlighted the inflammatory cell infiltration). *P < 0.05, **P < 0.01 ***P < 0.001 compared to model group. ###P < 0.001 compared to control group.
Figure 7
Figure 7
Anti-liver fibrosis capacity of the SHG NPs in mice. (A) Representative images of Masson-stained liver sections. (Yellow arrows highlighted the darker blue areas). (B) Immunofluorescence staining of α-SMA (green) and COL 1 (red), nuclei counterstained with DAPI (blue) in the liver. (C) Protein expression of α-SMA and COL 1 in liver tissues. (D) Relative intensity of COL 1/β-actin. (E) Relative intensity of α-SMA/β-actin. *P < 0.05, **P < 0.01 ***P < 0.001 compared to model group. ###P < 0.001 compared to control group.
Figure 8
Figure 8
RNA expression profiles of livers from different groups of mice. (A) Volcano plots of DEGs. (B) Volcano plots of DEGs. (C) KEGG analysis of gene enrichment in the signaling pathways. (D) Gene expression levels of Col1a1. ***P < 0.001 compared to model group, ###P < 0.001 compared to control group.
Figure 9
Figure 9
Immunofluorescence analysis. (A) Immunofluorescence staining of TGF-β (green) and p65 (red), and nuclei counterstained with DAPI (blue) in liver. (B) Fluorescence statistical analysis of TGF-β. *P < 0.05, **P < 0.01 ***P < 0.001 compared to model group. ##P < 0.01 ###P < 0.001. (C) Fluorescence statistical analysis of p65. *P < 0.05, **P < 0.01 ***P < 0.001 compared to Sor group. #P < 0.05.

References

    1. Kisseleva T, Brenner D. Molecular and cellular mechanisms of liver fibrosis and its regression. Nat Rev Gastroenterol Hepatol. 2021;18:151–166. doi: 10.1038/s41575-020-00372-7 - DOI - PubMed
    1. Roehlen N, Crouchet E, Baumert TF. Liver fibrosis: mechanistic concepts and therapeutic perspectives. Cells. 2020;9:875. doi: 10.3390/cells9040875 - DOI - PMC - PubMed
    1. Su TH, Kao JH, Liu CJ. Molecular mechanism and treatment of viral hepatitis-related liver fibrosis. Int J Mol Sci. 2014;15:10578–10604. doi: 10.3390/ijms150610578 - DOI - PMC - PubMed
    1. Kawaratani H, Moriya K, Namisaki T, et al. Therapeutic strategies for alcoholic liver disease: focusing on inflammation and fibrosis (Review). Int J Mol Med. 2017;40:263–270. doi: 10.3892/ijmm.2017.3015 - DOI - PubMed
    1. Lackner C, Tiniakos D. Fibrosis and alcohol-related liver disease. J Hepatol. 2019;70:294–304. doi: 10.1016/j.jhep.2018.12.003 - DOI - PubMed

MeSH terms