. 2025 Jan;12(Suppl 1):S14615.
doi: 10.1117/1.NPh.12.S1.S14615. Epub 2025 Jul 22.

Hemodynamic and neuronal contributions to low-frequency vascular oscillations in a preclinical model of Alzheimer's disease

Affiliations

Hemodynamic and neuronal contributions to low-frequency vascular oscillations in a preclinical model of Alzheimer's disease

Shannon M O'Connor et al. Neurophotonics. 2025 Jan.

Abstract

Significance: Vasomotion, a temporal oscillation in vascular diameter centered around 0.1 Hz, may be altered in Alzheimer's disease (AD), with both increases and decreases reported.

Aim: We aimed to better characterize vasomotion in vivo, assess its feasibility as an early biomarker for vascular dysfunction in AD, and determine the relationship of vasomotion to underlying neuronal activity.

Approach: Low-frequency (0.06 to 0.2 Hz) oscillations (LFOs) in the cerebral arteries of anesthetized 9- to 12-month-old J20-AD ( n = 12 ) and wild-type ( n = 10 ) mice were extrapolated from hemodynamic data obtained using 2D optical imaging spectroscopy (2D-OIS). Changes in LFO power were determined after an inspired gas challenge and compared between groups. Simultaneously gathered multi-unit neuronal activity data were used to determine whether LFOs were independent of neural activity.

Results: LFOs increased as inspired oxygen was reduced, but the change in LFO power did not differ between groups. LFOs were found to be driven by neuronal activity, suggesting that they represent spontaneous low-frequency neurovascular coupling rather than vascular-only derived activity.

Conclusions: Arterial LFOs obtained by 2D-OIS were not a suitable metric to distinguish anesthetized J20-AD males from healthy male controls. Furthermore, hemodynamic oscillations occurring within the same frequency range as vasomotion may reflect underlying neuronal activity.

Keywords: Alzheimer’s disease; neurovascular coupling; vasomotion.


Figures

Fig. 1
Fig. 1
Region of interest selection and HbT response to whisker stimulation. A reference image of the thinned cranial window over the somatosensory cortex with four regions of interest (ROIs) selected: whisker region (blue), artery (red), vein (pink), and parenchyma (green) for (a1) WT, (a2) WT in the acute session (i.e., with electrode present), (a3) J20-AD, and (a4) J20-AD in the acute session (i.e., with electrode present). The corresponding HbT spatial response to a 2 s mechanical whisker stimulation of (b1) WT, (b2) WT in the acute session, (b3) J20-AD, and (b4) J20-AD in the acute session. HbT time series for (c1) WT, (c2) WT in the acute session, (c3) J20-AD, and (c4) J20-AD in the acute session. Whisker stimulation occurred at 0 s (after a 5 s baseline) for a 2 s duration. The color bar represents fractional change.
Fig. 2
Fig. 2
Kernel shape parameters. An example of a kernel. The red and blue region highlights the region before and after, respectively. The grey dashed line represents the slope to peak (from time 0 s to the peak), whereas the black dashed line represents the slope to baseline (from the peak to the x-axis). The black dot represents the peak.
Fig. 3
Fig. 3
Time series and FFT of arterial HbT. (a) Single session, involving eight experiments. The black dotted lines indicate where inspired gas had been changed. The current study used data from experiments 3 and 6 (marked in bold). The blue highlighted area indicates the portion of the experiment used for the analysis of HbT in each inspired gas condition. Time series of arterial HbT occurring in a WT mouse in (b) an experiment in which the inspired gas was switched from 100% oxygen to medical air, and (c) an experiment in which the inspired gas was switched from medical air to 100% oxygen. Time series of arterial HbT occurring in a J20-AD mouse during (d) an experiment in which the inspired gas was switched from 100% oxygen to medical air, and (e) an experiment in which the inspired gas was switched from medical air to 100% oxygen. The grey dotted line indicates when the inspired gas was changed (105 s), and blue highlighting indicates the portion of data used for the measurement of HbT for each inspired gas condition. Mean FFTs of HbT in the artery for both the oxygen (black) and air-breathing (red) conditions are shown for (f) WT and (g) J20-AD mice; the grey dotted lines indicate the 0.06 to 0.2 Hz range summed and used for analysis.
Fig. 4
Fig. 4
Power of LFOs in the artery of J20-AD and WT mice in oxygen and air-breathing conditions. Log-transformed powers of LFOs occurring in the 0.06 to 0.2 Hz range in the arterial region of J20-AD (n=11) and WT (n=10) mice in each inspired gas condition (oxygen and air). Each mouse contributed no more than four sessions. Each data point represents the summation of power occurring between 0.06 and 0.2 Hz in a session, with mean ± standard deviation (SD) for each group and inspired gas condition.
Fig. 5
Fig. 5
Power of LFOs in the artery of J20-AD and WT mice (with electrode implant) in oxygen and air-breathing conditions. Log-transformed powers of LFOs in HbT occurring in the 0.06 to 0.2 Hz range in the arterial region of (a) each group [J20-AD (n=12) and WT (n=10) mice], and (b) in each inspired gas condition (oxygen and air). Animals contributed one session to each of the inspired gas conditions. Each data point represents the summation of power occurring between 0.06 and 0.2 Hz in a session, with mean ± standard deviation (SD) for each group and inspired gas condition. Log-transformed powers of low-frequency MUA oscillations occurring in the 0.06 to 0.2 Hz range in the somatosensory region of (a) J20-AD and WT mice (with electrode implant), and (b) power of MUA in the somatosensory region of J20-AD and WT mice (with electrode implant) in each inspired gas condition (oxygen and air). Data are plotted as individual values with mean ± standard deviation (SD).
Fig. 6
Fig. 6
Kernel of MUA and HbT in the artery of J20-AD and WT mice (acute dataset) in oxygen and air-breathing conditions. (a) The HbT and MUA data from a representative subject, over 50 s. (b) The average kernel for WT (b1) and J20-AD (b2) groups. The green line represents the oxygen-breathing condition, whereas the blue line represents the air-breathing condition. The shaded regions denote the standard deviation. (c) The region before (c1), region after (c2), and slope to baseline of all subjects, plotted as individual values with mean ± standard deviation (SD). The green and blue represent air and oxygen-breathing conditions, whereas the square and diamond represent AD and WT mice groups.
Fig. 7
Fig. 7
Alignment of spontaneous hemodynamic peak responses and MUA activity across all groups. Column (a) depicts average time series responses from the WBC in (a1) WT animals under oxygen (n=10), (a2) WT animals under air (n=10), (a3) AD animals under oxygen (n=12), and (a4) AD animals under air (n=12). Column (b) depicts extracted MUA data aligned from the peak Hbt response at 10s for (b1) WT animals under oxygen, (b2) WT animals under air, (b3) AD animals under oxygen, and (b4) AD animals under air. The largest increase in MUA activity can be seen at 8 s. The color bar represents fractional change. Column (c) depicts MUA time series taken from channels 4 to 8 in (c1) WT animals under oxygen, (c2) WT animals under air, (c3) AD animals under oxygen, and (c4) AD animals under air. HbT, total hemoglobin; HbO, oxyhemoglobin; HbR, deoxyhemoglobin. Error bars = standard error of the mean.
Fig. 8
Fig. 8
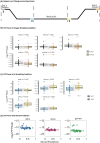
Anesthesia depth remains constant throughout experiments, and kernel prediction is independent of anesthesia depth. (a) Illustration of the experimental setup following electrode implantation. In experiment 3, the breathing condition was switched from oxygen to medical air; in experiment 6, it was switched from medical air to oxygen. The final 450 s of experiments 3 and 6 were used, corresponding to the air and oxygen conditions, respectively. Two 100-s segments from each condition—oxygen (grey and orange) and air (blue and yellow)—were selected for further analysis. The black line represents the oxygen level. (b), (c) LFP power across frequency bands in the two oxygen and air conditions. (d) Log-transformed delta, alpha, and gamma power plotted against kernel prediction.

References

    1. Klohs J., “An integrated view on vascular dysfunction in Alzheimer’s disease,” Neurodegen. Dis. 19(3–4), 109–127 (2019). 10.1159/000505625 - DOI - PubMed
    1. Donato A. J., Machin D. R., Lesniewski L. A., “Mechanisms of dysfunction in the aging vasculature and role in age-related disease,” Circ. Res. 123(7), 825–848 (2018). 10.1161/CIRCRESAHA.118.312563 - DOI - PMC - PubMed
    1. Iturria-Medina Y., et al. , “Early role of vascular dysregulation on late-onset Alzheimer’s disease based on multifactorial data-driven analysis,” Nat. Commun. 7, 11934 (2016). 10.1038/ncomms11934 - DOI - PMC - PubMed
    1. Iadecola C., “The overlap between neurodegenerative and vascular factors in the pathogenesis of dementia,” Acta Neuropathol. 120, 287–296 (2010). 10.1007/s00401-010-0718-6 - DOI - PMC - PubMed
    1. Zlokovic B. V., “Neurovascular pathways to neurodegeneration in Alzheimer’s disease and other disorders,” Nat. Rev. Neurosci. 12(12), 723–738 (2011). 10.1038/nrn3114 - DOI - PMC - PubMed

LinkOut - more resources