. 2025 Oct;11(10):2107-2133.
doi: 10.1016/j.jacep.2025.06.007. Epub 2025 Jul 23.

Microvascular Rarefaction in the Sinoatrial Node: A Potential Mechanism for Pacemaker Dysfunction in Early HFpEF

Affiliations

Microvascular Rarefaction in the Sinoatrial Node: A Potential Mechanism for Pacemaker Dysfunction in Early HFpEF

Declan Manning et al. JACC Clin Electrophysiol. 2025 Oct.

Abstract

Background: Microvascular rarefaction is a feature of heart failure with preserved ejection fraction (HFpEF) that may underlie associated rhythm disturbances. Angiotensin II (AngII) signaling has been implicated, but its role in sinoatrial (SA) node dysfunction remains unclear.

Objectives: The authors tested whether changes in SA node microvascular architecture contribute to pacemaker dysfunction in early HFpEF.

Methods: Mice received a 28-day subcutaneous infusion of a sub-pressor dose of AngII. Electrocardiography, echocardiography, confocal imaging, spatial RNA detection, and optical mapping were used to assess SA node structure and function.

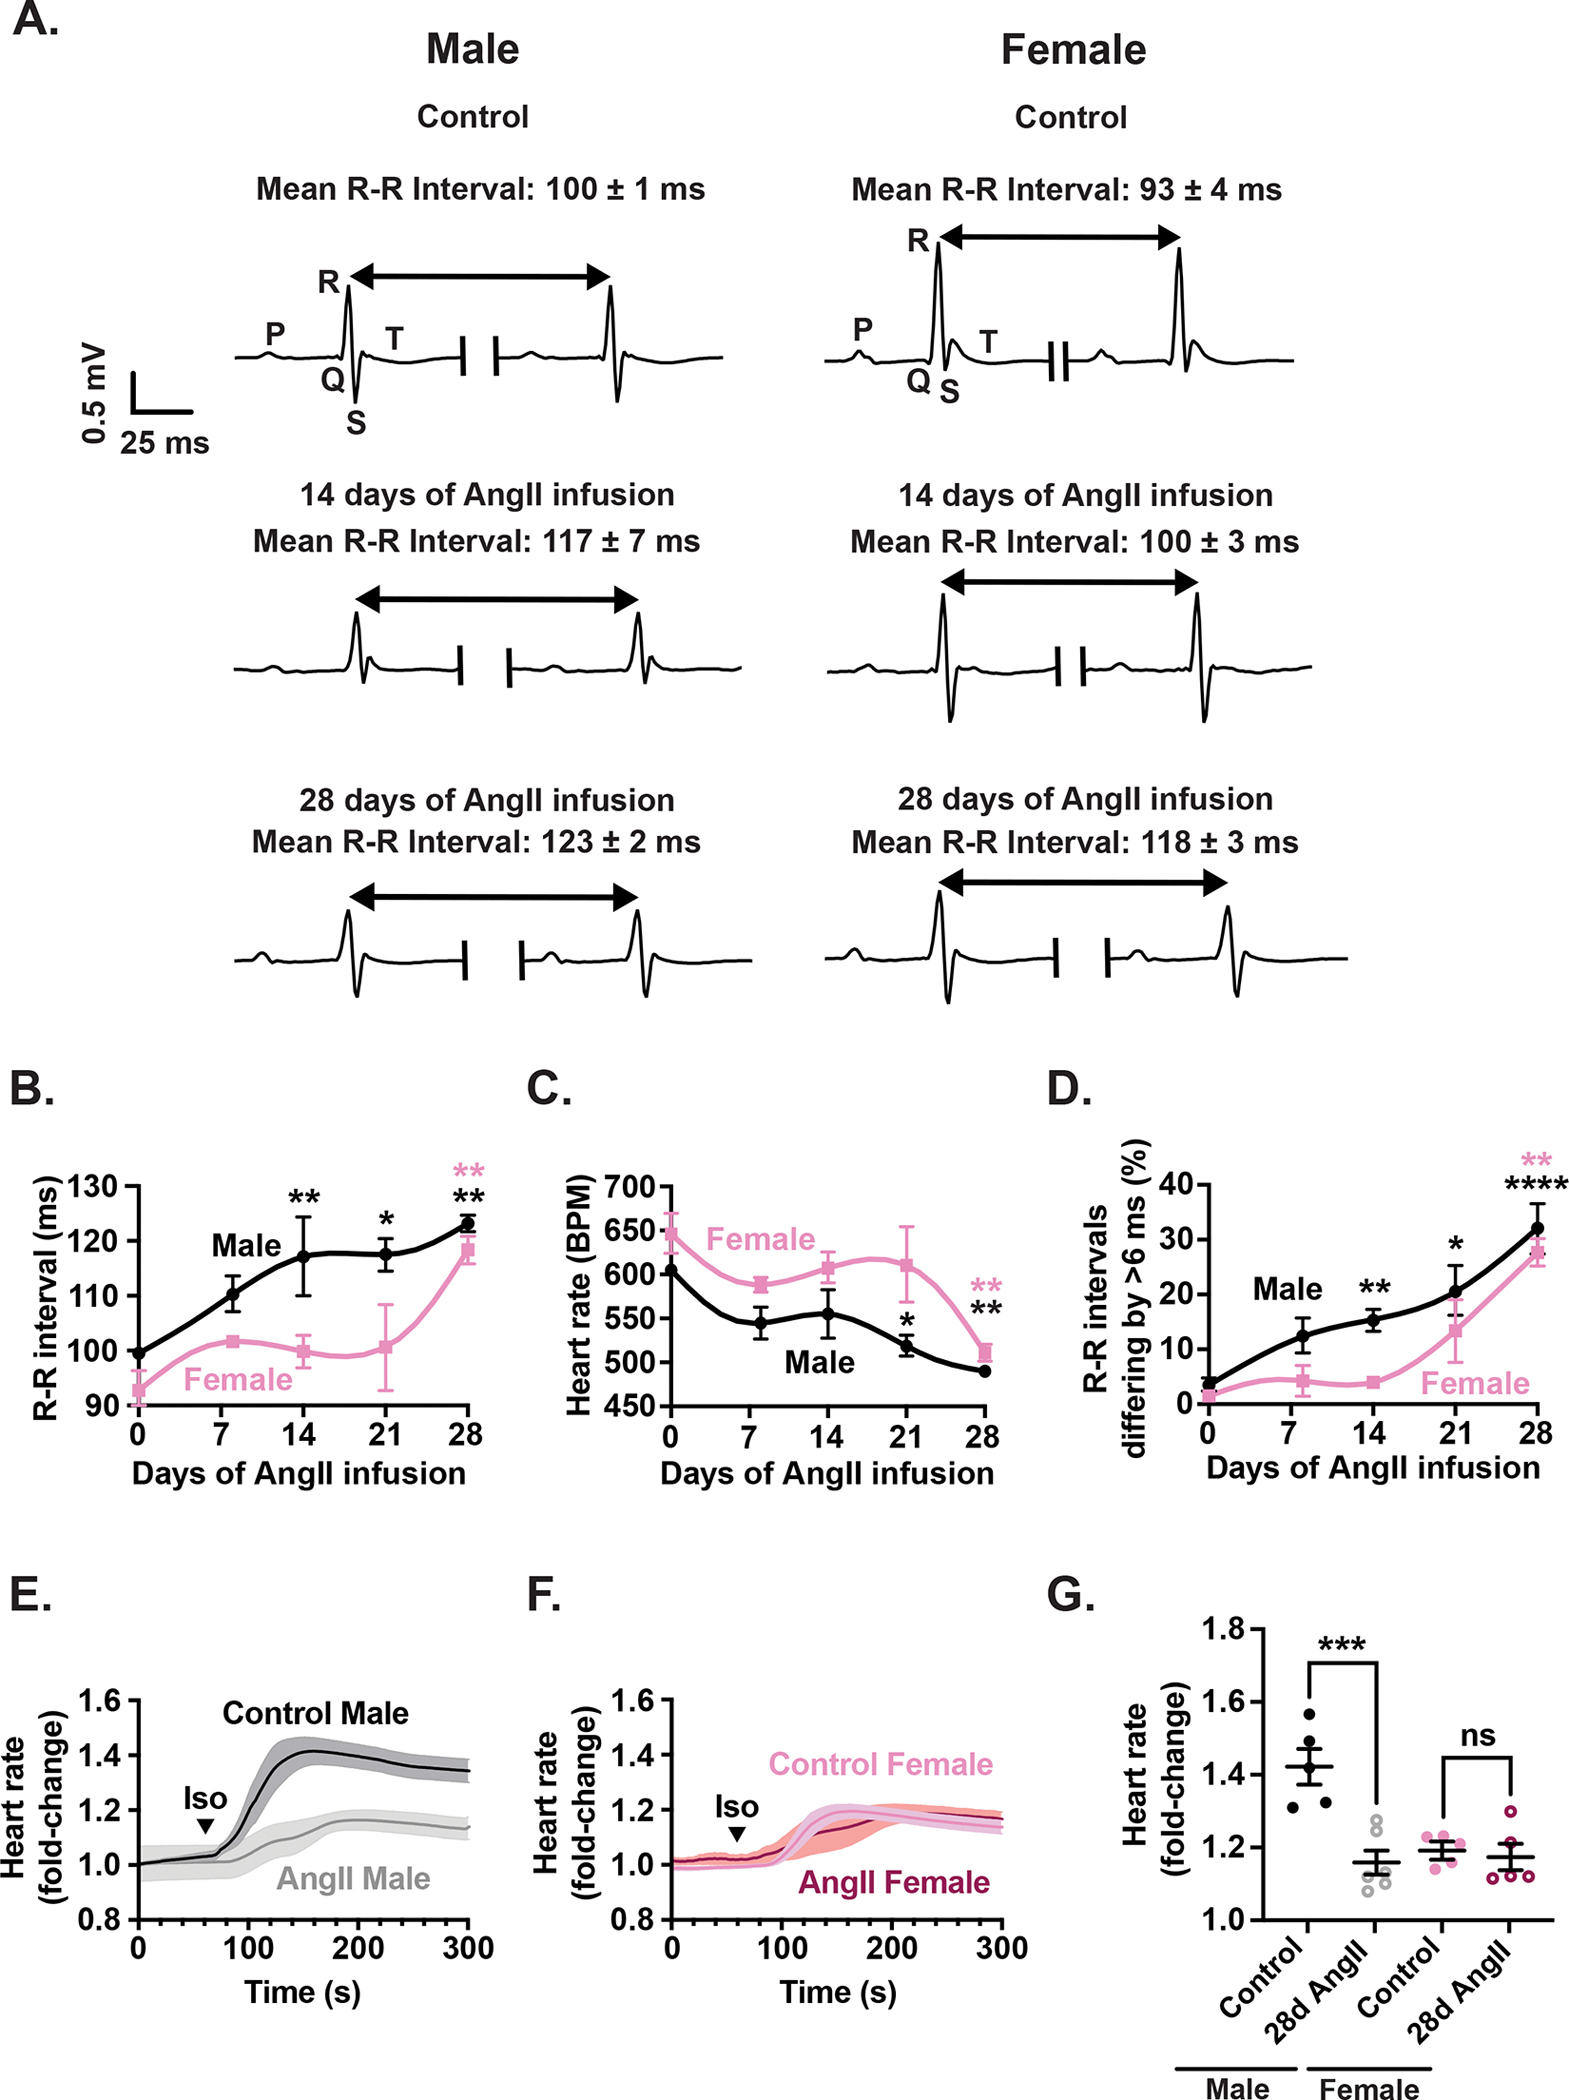
Results: Heart rate declined progressively during AngII infusion, with males falling from 605 ± 6 beats/min to 490 ± 6 beats/min and females from 646 ± 23 beats/min to 511 ± 10 beats/min by day 28. Bradycardia was accompanied by increased beat-to-beat variability: the percentage of consecutive heartbeats that differed in duration by >6 milliseconds increased from 3.5% ± 1.3% to 32.1% ± 4.5% in males and from 3.8% ± 1.1% to 27.7% ± 2.5% in females. These changes coincided with reduced microvessel density in the superior SA node (males: 6.1 ± 0.5 nm/μm3 to 3.9 ± 0.2 nm/μm3; females: 5.6 ± 0.4 to 2.8 ± 0.5 nm/μm3), whereas vessels in the inferior SA node remained unchanged. Despite preserved myocyte density, these changes were accompanied by up-regulation of oxidative stress and the hypoxia-inducible factor 1α and vascular endothelial growth factor signaling pathways.

Conclusions: These findings highlight microvascular rarefaction in the superior SA node as a key early event in HFpEF pathology. The loss of redundant vascular loops compromises metabolic support for pacemaking, illustrating a broader principle: rarefaction can impair excitability in metabolically demanding excitable tissues.

Keywords: HFpEF; sinoatrial node; vascular rarefaction.


Conflict of interest statement

Funding Support and Author Disclosures The project was supported by National Institutes of Health grants HL168874 (Dr Santana), TR001860 (TL1 TR001861) (Dr Rivera), HL163930 (Dr Contreras), UL1 TR001860 (Dr Bautista), TR001859 (Dr Bautista), GM130459 (Dr Grainger), HL085727 (Dr Chiamvimonvat), HL085844 (Dr Chiamvimonvat), HL170520 (Dr Chiamvimonvat), HL160274 (Dr Chiamvimonvat), and OD010389. The work was further supported by American Heart Association grants 25POST1378853 (Dr Rhana), 24CDA1276831 (Dr Thai), 23SFRNCCS1052478 (Dr Chiamvimonvat), 23SFRNPCS1060482 (Dr Chiamvimonvat), as well as a Harold S. Geneen Charitable Trust Awards for Coronary Heart Disease (Dr Thai). The authors have reported that they have no relationships relevant to the contents of this paper to disclose.

Figures

Figure 1.
Figure 1.. Cardiac telemetry and platform ECG reveal bradycardia, increased heart rate variability, and reduced β-adrenergic responsiveness in male mice following 28-day AngII infusion.
(A) Representative ECG telemetry traces recorded from male (right) and female (left) mice under control conditions as well as 14 and 28 days after AngII infusion. Time course of changes in R-R interval (B), heart rate (C), and (D) percentage of R-R intervals differing by greater than 6 ms increases during the 28-day infusion. Average time course of the effect of ISO injection on the HR of male (E) and female (F) control and AngII-infused (28 days) mice. (G) Scatter plot of the fold change in HR in upon ISO injection in control and AngII-infused mice.
Figure 2.
Figure 2.. Frequency-domain telemetry ECG analysis reveals amplified HRV and altered autonomic balance during AngII infusion.
Time course of changes in very low (A), low (B), and high frequency (C), and (D) total power. (E) Time course of the LF/HF ratio. (F-G) Percentage contributions of very low (F), low (G), and high (H) frequency components to total HRV power shift over the 28-day infusion period. Data are presented as mean ± SEM for N = 6 male (black) and N = 5 female (pink) mice.
Figure 3.
Figure 3.. 28-day AngII infusion induces diastolic dysfunction in male and female mice.
Representative M-mode (A) and pulsed-wave Doppler mode echocardiographic images (B) from control as well as mice infused for 14, 21, or 28 days with AngII. Time courses for left ventricular anterior wall (LVAW) thickness (C), ejection fraction (D), fractional shortening decreases (E), myocardial performance index values (F), isovolumetric relaxation time (G), and E/A wave ratio (H). Data are presented for N = 6 female (pink) and N = 6 male mice (black).
Figure 4.
Figure 4.. AngII infusion induces microvascular rarefaction in the superior SA node.
Immunohistochemistry of the whole-mount sinoatrial preparation (A) delineates HCN4+ sinoatrial myocytes (green) and CD31+ microvasculature (red) (Ai). The microvascular network (Aii) was studied across multiple scales to assess evidence of regionalized rarefaction in the superior (sSAN) or inferior (iSAN) SA node regions (Aiii). High-resolution images were segmented (B) to analyze vessel density. Panels C and D show vessel tracing of CD31+ blood vessels from representative male (C) and female (D) mice. Panels E-F show scatter plots of vascular densities in superior and inferior regions of the node. Data are presented for n = 6–14 superior/inferior regional images from N = 3–5 male mice per group, and n = 5–6 superior/inferior regional images from N = 3 female mice per group.
Figure 5.
Figure 5.. SA node myocyte density in unaffected by 28-day AngII treatment.
The whole-mount sinoatrial preparation (A) showing HCN4+ sinoatrial myocytes (green) and CD31+ microvasculature (red) (Ai). Sinoatrial myocytes (Aii) were assessed in both the superior (sSAN) or inferior (iSAN) SA node regions (Aiii). High-resolution images were segmented (B) to quantify HCN4+ myocyte density. Representative myocyte density maps from a male (C) and female (D) mice. Panels E and F show scatter plots of myocyte densities in SA nodes from male and female hearts. Data are presented for n = 8–14 superior/inferior regional images from N = 4–5 male mice per group, and n = 6 superior/inferior regional images from N = 3 female mice per group.
Figure 6.
Figure 6.. Microvascular rarefaction disrupts redundant vascular loops in the superior SA node.
Vascular loops were measured in the superior and inferior SA node regions using binary surface and filament tracing methods in Imaris (A). Loops are highlighted (white) against the terminal vessel segments (red). Representative vessel tracing images from male (B) and female (C) SA node immunohistochemistry experiments. Scatter plots of the number of vascular loops in males (D) and females (E). Data are presented for n = 7–14 superior/inferior regional images from N = 4–5 male mice per group, and n = 6 superior/inferior regional images from N = 3 female mice per group.
Figure 7.
Figure 7.. Sinoatrial myocytes maintain close contact with blood vessels during AngII-induced rarefaction.
Whole-mount SA node immunohistochemistry showing HCN4+ sinoatrial myocytes (green) and CD31+ blood vessels (red) (A) in the superior (sSAN) and inferior (iSAN) SA node regions. Respective signals were segmented and analyzed for proximity between myocytes and their nearest blood vessel, presented as heat maps (B). Heat maps of the distance from HCN4+ SA node myocytes to the nearest CD31+ blood vessel remains in males (C) and females (D) following 28-day. Scatter plots of the mean distance between myocytes and vessels in male and female SA node are shown in panels E and F, respectively. Data are presented for n = 6–14 superior/inferior regional images from N = 4–5 male mice per group, and n = 6 superior/inferior regional images from N = 3 female mice per group.
Figure 8.
Figure 8.. AngII increases reactive oxygen species generation in male and female SA nodes.
(A) Representative image of the whole SA node preparation incubated with 5 μM CellRox Green, delineating the superior region in red and inferior region in blue. (B) Representative zoomed in images of superior (red) and inferior (blue) regions before and after application of 100 nM AngII for 30 minutes. Time course of the normalized CellROX Green fluorescence intensity over 30 minutes in response to 100 nM AngII from male SAN (C) and female SAN (D). Each solid line of the time course is presented as an average fit of all traces with the SEM plotted in the shaded regions. Data are presented for N = 4 males and N = 6 females.
Figure 9.
Figure 9.. Chronic angiotensin II infusion increases Hif1α and Vegf mRNA expression in the SA node.
Representative image of a healthy male SA node slice preparation (A) subjected to RNAscope in situ hybridization, revealing Hif1α+ (magenta) and Vegf+ (yellow) mRNA puncta, as well as DAPI nuclear staining (blue). Super and inferior SA node regions of interest are presented, inset. Representative regions of interest are presented from AngII-infused and healthy control male and female mice (B). HIF1α mRNA puncta per mm2 (ln-transformed) are presented in the superior and inferior regions of the SA node from male (C) and female mice (D). Quantification of VEGF mRNA puncta per mm2 (ln-transformed) in the same regions from male (E) and female mice (F). Data are presented for n = 30–42 superior/inferior regional images from N = 3–4 male mice (black) and n = 19–29 superior/inferior regional images from N = 3 female mice (pink).
Figure 10.
Figure 10.. AngII-infusion increases fibrosis in the ventricle but not in the SA node.
(A) Representative Masson’s trichrome-stained images of ventricular tissue from control and AngII-infused mice. (B) Quantification of collagen-positive area in ventricular sections. (C–D) Representative Masson’s trichrome-stained images of sinoatrial node tissue from control and AngII-infused mice. (E–F) Quantification of collagen-positive area in sinoatrial node sections from male and female mice. Ventricular collagen was measured in n = 26–38 samples from N = 4–7 mice per group. Sinoatrial node collagen was measured in n = 15–20 samples from N = 3–4 mice per group.
Figure 11.
Figure 11.. Optical recordings of intrinsic SA node activity following 28-day AngII infusion.
(A) Representative optical action potential (AP) traces from excised SA node preparations from control and AngII-infused (28-day) mice. (B) Scatter plots of spontaneous beating rates recorded from individual SA node preparations from male mice. (C) Representative optical recordings of APs from the SA node and adjacent right atrium. (D) Poincaré plots illustrating inter-AP interval variability in SA node preparations from male and female mice. Data are presented for N = 4 control male mice (black), N = 5 control females (pink), N = 5 AngII-infused males (grey), and N = 4 AngII-infused females (pink circles).

References

    1. DiFrancesco D Characterization of single pacemaker channels in cardiac sino-atrial node cells. Nature 1986;324:470–3. - PubMed
    1. Bogdanov KY, Maltsev VA, Vinogradova TM et al. Membrane potential fluctuations resulting from submembrane Ca2+ releases in rabbit sinoatrial nodal cells impart an exponential phase to the late diastolic depolarization that controls their chronotropic state. Circ Res 2006;99:979–87. - PubMed
    1. Lakatta EG, Maltsev VA, Vinogradova TM. A coupled SYSTEM of intracellular Ca2+ clocks and surface membrane voltage clocks controls the timekeeping mechanism of the heart’s pacemaker. Circ Res 2010;106:659–73. - PMC - PubMed
    1. Rhana P, Matsumoto C, Fong Z et al. Fueling the heartbeat: Dynamic regulation of intracellular ATP during excitation-contraction coupling in ventricular myocytes. Proc Natl Acad Sci U S A 2024;121:e2318535121. - PMC - PubMed
    1. Bertero E, Maack C. Metabolic remodelling in heart failure. Nat Rev Cardiol 2018;15:457–470. - PubMed