. 2025 Jul 24;16(1):1402.
doi: 10.1007/s12672-025-03222-7.

Application of Mendelian randomization and bioinformatic analysis to construct a prognostic model for thyroid cancer and perform pan-cancer analysis

Affiliations

Application of Mendelian randomization and bioinformatic analysis to construct a prognostic model for thyroid cancer and perform pan-cancer analysis

Zhenrun Zhan et al. Discov Oncol. .

Abstract

Objective: This study aimed to identify causal effects and potential molecular mechanisms of genes associated with THCA development.

Methods: Bioinformatic analyses were performed to identify differentially expressed genes (DEGs) associated with THCA. Subsequently, Mendelian randomization (MR) analysis was conducted using large-scale eQTL data and THCA GWAS summary statistics to screen for candidate genes. The intersection of DEGs and MR-derived candidate genes was used to determine DEGs with potential causal associations with thyroid carcinogenesis. Functional enrichment analysis, pathway analysis, and immune cell infiltration profiling were performed. External datasets were used for validation. Additionally, prognostic modeling and pan-cancer analyses of the candidate genes were conducted.

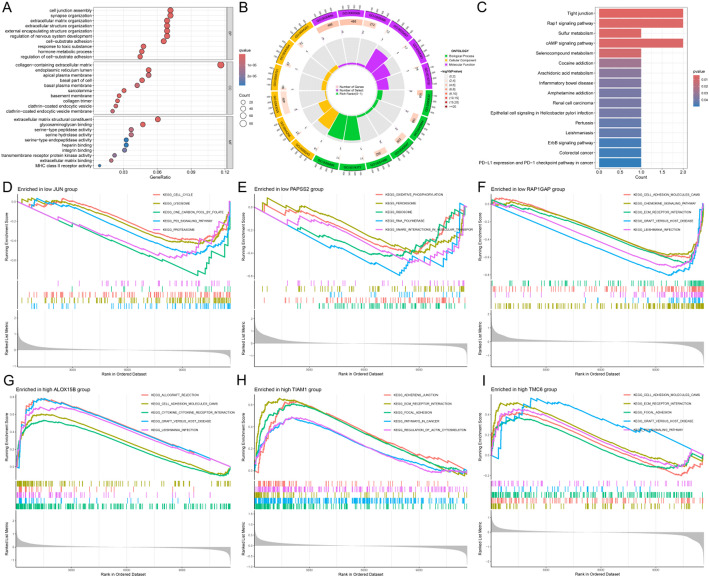
Results: IVW-based MR analysis revealed that elevated expression levels of ALOX15B [OR = 1.647, 95% CI (1.120-2.420), P < 0.05], TIAM1 [OR = 1.270, 95% CI (1.001-1.611), P < 0.05], and TMC6 [OR = 1.250, 95% CI (1.021-1.530), P < 0.05] were associated with an increased risk of THCA. Conversely, elevated expression of JUN [OR = 0.795, 95% CI (0.653-0.967), P < 0.05], PAPSS2 [OR = 0.779, 95% CI (0.608-1.000), P < 0.05], and RAP1GAP [OR = 0.895, 95% CI (0.810-0.989), P < 0.05] was associated with a reduced risk. Gene set enrichment analysis (GSEA) indicated that risk genes were enriched in proliferation- and metastasis-related pathways, such as extracellular matrix (ECM)-receptor interaction and cell adhesion molecules (CAMs). Findings from the training set were further validated experimentally and via external datasets. Additionally, candidate risk genes demonstrated associations with the development and progression of multiple tumor types.

Conclusion: This study identified ALOX15B, TIAM1, and TMC6 as potential risk genes and JUN, PAPSS2, and RAP1GAP as protective genes in THCA. These genes may serve as promising biomarkers and therapeutic targets for THCA, offering novel insights into precision oncology.

Keywords: Bioinformatics; Immune infiltration; Mendelian randomization; Prognostic model; Thyroid cancer.


Conflict of interest statement

Declarations. Competing interests: The authors declare no competing interests.

Figures

Fig. 1
Fig. 1
The flowchart graph of this study
Fig. 2
Fig. 2
A: Heatmap of DEGs between THCA and control tissues; B: Volcano plot of DEGs; red represents up-regulated DEGs and blue represents down-regulated DEGs; C: Venn diagram showing the intersection of 420 up-regulated DEGs with 106 low-risk candidate genes, identifying three THCA suppressor genes; D: Venn diagram showing the intersection of 303 down-regulated DEGs with 83 high-risk candidate genes, identifying three THCA-promoting genes
Fig. 3
Fig. 3
A1: Summary results of the MR analysis; A2: Circular plot illustrating the chromosomal distribution of the six core genes; B1–B6: Scatter plots of causal effects between six candidate genes and THCA in the MR analysis: B1: JUN; B2: PAPSS2; B3: RAP1GAP; B4: ALOX15B; B5: TIAM1; B6: TMC6; C1–C6: Forest plots showing the causal effects of SNPs associated with each gene on THCA: C1: JUN-associated SNPs; C2: PAPSS2-associated SNPs; C3: RAP1GAP-associated SNPs; C4: ALOX15B-associated SNPs; C5: TIAM1-associated SNPs; C6: TMC6-associated SNPs; D1–D6: Leave-one-out sensitivity analyses evaluating the stability of MR results for each gene: D1: JUN; D2: PAPSS2; D3: RAP1GAP; D4: ALOX15B; D5: TIAM1; D6: TMC6
Fig. 4
Fig. 4
A, B: GO enrichment analysis of core genes showing involvement in BP, CC, and MF; C: KEGG pathway enrichment histogram—Y-axis indicates pathway names; X-axis indicates the number of core genes involved. D–I: GSEA plots of six core genes: D: JUN; E: PAPSS2; F: RAP1GAP; G: ALOX15B; H: TIAM1; I: TMC6
Fig. 5
Fig. 5
Immune infiltration analysis and correlation with core gene expression. A: Proportion of 22 immune cell types in control versus THCA samples; B: Boxplot comparing immune cell infiltration between control (blue) and THCA (red) samples (* represents < 0.05, ** represents < 0.01, *** represents < 0.001); C: Immune correlation network. The lower left panel shows correlations among immune cell types; red indicates positive and blue indicates negative correlations. The upper right panel illustrates correlations between core genes and immune cell types; red lines represent positive correlations, green lines indicate negative correlations, and line thickness reflects the magnitude of the correlation coefficient
Fig. 6
Fig. 6
Prognostic signature and immune cell correlation in THCA. A: Stratification of patients into high- and low-risk groups based on risk scores; B: Scatterplot of survival status and time versus risk score; C: KM curve comparing OS between high-risk and low-risk groups; D: Time-dependent ROC curve analysis for 1-, 3-, and 5-year OS; E: Correlation between risk scores and immune cell infiltration levels
Fig. 7
Fig. 7
Differential Expression and Correlation of Core Genes in the Validation Dataset. A: Boxplot showing expression levels of intersecting genes in THCA (red) versus control tissues (blue). B: Heatmap illustrating pairwise correlations among the six core genes
Fig. 8
Fig. 8
Validation of core gene expression in THCA and normal thyroid cell lines. A–F: Relative mRNA expression levels of ALOX15B, TIAM1, TMC6, JUN, PAPSS2, and RAP1GAP measured by qRT-PCR. G–I: Western blot analysis and quantification of TIAM1 and PAPSS2 protein expression in OR2, TPC, and IHH4 cells. TPC and IHH4 are THCA cell lines, while OR2 is a normal thyroid epithelial cell line. (* indicates comparison with OR2 p < 0.05; *** indicates comparison with OR2, p < 0.001)
Fig. 9
Fig. 9
Pan-cancer expression analysis of THCA risk genes. A: ALOX15B expression across cancer types; B: TIAM1 expression across cancer types; C: TMC6 expression across cancer types

Similar articles

References

    1. Bray F, Ferlay J, Soerjomataram I, Siegel RL, Torre LA, Jemal A. Global cancer statistics 2018: GLOBOCAN estimates of incidence and mortality worldwide for 36 cancers in 185 countries. Cancer J Clin. 2018;68(6):394–424. - PubMed
    1. Wei X, Wang X, Xiong J, Li C, Liao Y, Zhu Y, Mao J. Risk and Prognostic Factors for BRAF(V600E) Mutations in Papillary Thyroid Carcinoma. BioMed research international 2022, 2022:9959649. - PMC - PubMed
    1. Mao J, Zhang Q, Zhang H, Zheng K, Wang R, Wang G. Risk factors for lymph node metastasis in papillary thyroid carcinoma: A systematic review and Meta-Analysis. Front Endocrinol. 2020;11:265. - PMC - PubMed
    1. Dotinga M, Vriens D, van Velden FHP, Stam MK, Heemskerk JWT, Dibbets-Schneider P, Pool M, Rietbergen DDD, de Geus-Oei LF, Kapiteijn E. Reinducing Radioiodine-Sensitivity in Radioiodine-Refractory thyroid Cancer using lenvatinib (RESET): study protocol for a Single-Center, open label phase II trial. Diagnostics (Basel Switzerland) 2022, 12(12). - PMC - PubMed
    1. Bowden J, Holmes MV. Meta-analysis and Mendelian randomization: A review. Res Synthesis Methods. 2019;10(4):486–96. - PMC - PubMed

LinkOut - more resources