. 2025 Jul 24;16(1):1401.
doi: 10.1007/s12672-025-03221-8.

Identification of key targets and exploration of therapeutic molecular mechanisms of natural compound tangeretin in osteosarcoma

Affiliations

Identification of key targets and exploration of therapeutic molecular mechanisms of natural compound tangeretin in osteosarcoma

Ruoping Yanzhang et al. Discov Oncol. .

Abstract

Introduction: Osteosarcoma (OS) is an invasive and lethal malignancy showing a low 5 year survival rate, underscoring the need for identifying new therapeutic targets and their inhibitors to enhance prevention and treatment strategies.

Methods: In this study, in vitro experiments including CCK-8 assay, anchorage-independent growth assays, and plate cloning assays were used to detect the anti-proliferation ability of natural compound tangeretin towards OS cells. An integrated approach was performed including WGCNA and network pharmacology to identify the key genes of tangeretin for the treatment of OS. Multigene diagnostic model, reverse transcription quantitative polymerase chain reaction (RT-qPCR) analysis along with molecular docking analysis were further conducted to validate the reliability of the targets obtained by bioinformatics methods. Single-cell and gene enrichment analyses were chosen to explore the mechanism of tangeretin in OS.

Results: Hub genes identified by the bioinformatics strategy included ABCC1, AKR1C3, BACE1, and CA12. RT-qPCR validation and molecular docking analysis confirmed that ABCC1 and BACE1 were the most likely potential targets. A multigene diagnostic model for OS demonstrated moderate accuracy of the hub genes. Single-cell sequencing results indicated that these two hub targets were closely related to OS and provided more potential mechanisms for targeting OS.

Conclusion: Our research highlights the therapeutic potential of the natural compound tangeretin and its antineoplastic mechanisms in OS. It offers new insights into the molecular mechanisms of tangeretin, paving the way for the development of effective OS treatments.

Keywords: Natural compound; Network pharmacology; Osteosarcoma; Tangeretin; Therapeutic targets; WGCNA.


Conflict of interest statement

Declarations. Ethics approval and consent to participate: Not applicable. Consent for publication: Not applicable. Competing interests: The authors declare no competing interests.

Figures

Fig. 1
Fig. 1
Tangeretin attenuates OS cell proliferation. A, B The influences of discrepant tangeretin concentrations on cell progress capacity of 143B and KHOS at 1 day, 2 days, and 3 days were examined via the CCK-8 assay.; C, D Colony formation cell progress trial was executed to appraise the impact of tangeretin (0, 5, 10, 20, 40 μM) on the progress of 143B (C) and KHOS (D). E, F Anchorage-independent cell progress trial was executed to appraise the impact of tangeretin (0, 5, 10, 20, 40 μM) on the progress of 143B (E) and KHOS (F). Statistical analysis was executed through the Students’ unpaired t-test. *p < 0.05, **p < 0.01, and ***p < 0.001 signify key disparities in the groups. The outcomes aligned with three isolated experiments
Fig. 2
Fig. 2
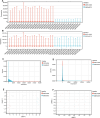
Normalization procedure for integrating multiple datasets from GEO. A Visualization of gene expression distributions across both datasets prior to normalization. B Comparative analysis of expression profiles following normalization procedures. C Density distribution patterns of gene expression levels in unnormalized datasets. D Normalized expression density profiles demonstrating data standardization effects. E UMAP dimensional reduction analysis of pre-normalized datasets. F UMAP visualization of normalized datasets illustrating clustering patterns post-normalization
Fig. 3
Fig. 3
The DEG analysis resulted from the GSE14359 and GSE42572 datasets. A volcano plots where up-regulated genes are denoted in red, while down-regulated genes are marked in green. B Hierarchical clustering heatmap of the 50 most significantly differentially expressed genes between OS and normal tissue samples
Fig. 4
Fig. 4
Outcomes of the WGCNA. A Scale-free topology of the standardized expression profile. B Mean connectivity values derived from the standardized expression profile. C Hierarchical clustering dendrogram from gene expression profiles. D The association between distinct gene modules and clinical traits, where light blue and blue hues represent positive and negative correlations, respectively. E The association between the degree of module membership (MM) and gene significance (GS) within the turquoise module was examined
Fig. 5
Fig. 5
Identification of OS characteristic genes and their functional annotation. A The overlapping gene sets between WGCNA module genes and DEGs. B Bubble chart illustrating the KEGG pathway enrichment results, highlighting the top 10 significantly enriched pathways among OS-associated genes. C–E GO enrichment outcomes, depicting the premier 10 enriched biological procedures categories (C), premier 10 cellular component terms (D), and the premier 10 molecular functions categories (E). In all bubble plots, the color gradient and bubble diameter respectively indicate the statistical significance (p-values) and the number of genes involved in each term
Fig. 6
Fig. 6
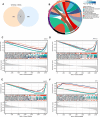
Identification and functional characterization of potential molecular targets associated with the therapeutic effects of tangeretin in OS. A The overlapping gene sets between OS-related molecular signatures and tangeretin targets. B Circular visualization of KEGG enrichment pathway enrichment analysis, highlighting the biological processes influenced by tangeretin in OS. C, D, E, F GSEA enrichment analysis of ABCC1 (C), AKR1C3 (D), BACE1 (E), and CA12 (F)
Fig. 7
Fig. 7
A The association between the expression levels of CA12, BACE1, AKR1C3, and ABCC1 with survival outcomes in the Target dataset. The upper panel displays a gradient of gene expression intensities, categorized by distinct color codes representing varying expression clusters. The central panel depicts the correlation between gene expression profiles and corresponding survival durations and statuses across different samples. The lower panel presents a heatmap visualization of gene expression patterns. B The KM survival analysis for CA12, BACE1, AKR1C3, and ABCC1 within the Target dataset. The log-rank test was employed to compare survival differences between expression groups, with HR denoting the hazard ratio for the high-expression cohort relative to the low-expression group. C The ROC curves as well as AUC values for CA12, BACE1, AKR1C3, and ABCC1 at different time points, where a higher AUC value indicates a stronger predictive ability of the gene
Fig. 8
Fig. 8
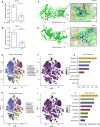
A, B RT-qPCR Analysis of BACE1 and ABCC1 Expression: The expression levels of BACE1 and ABCC1 were quantified using RT-qPCR in OS cells treated with tangeretin. Statistical significance was determined using the unpaired Student’s t-test, with *p < 0.05, **p < 0.01, and ***p < 0.001 indicating significant differences between the treatment and control groups. The data represent results from three independent experiments, ensuring reproducibility and reliability of the findings. C, D Computational Docking Models: Molecular docking simulations were performed to assess the binding affinity of tangeretin with BACE1 (C) and ABCC1 (D), providing insights into their potential interactions at the molecular level. The docking results were visualized, with binding energies indicating the strength of the ligand-receptor interactions. E, H t-SNE Clustering of Single-Cell Data for BACE1 (E) and ABCC1 (H): t-distributed stochastic neighbor embedding (t-SNE) was used to visualize the clustering of single-cell data, highlighting the distinct populations of cells expressing BACE1 (E) and ABCC1 H. Each cell type was color-coded to show differentiation, helping to identify specific cell populations involved in OS. F, I Spatial Distribution of Gene Expression: t-SNE plots (F for BACE1 and I for ABCC1) showed the spatial distribution of BACE1 and ABCC1 gene expression across individual cells. The color gradient indicated the relative expression levels, with darker colors representing lower expression and brighter colors reflecting higher gene activity. G, J Quantitative Bar Graphs of Gene Expression Across Cell Types: Bar graphs (G for BACE1 and J for ABCC1) summarize the relative expression levels of these genes in different cell types. This comparative analysis provided a clear overview of how gene expression patterns varied across various cell populations, offering insights into their potential roles in OS progression and treatment response

Similar articles

References

    1. Sung H, et al. Global cancer statistics 2020: GLOBOCAN estimates of incidence and mortality worldwide for 36 cancers in 185 countries. CA Cancer J Clin. 2021;71(3):209–49. - PubMed
    1. Bernthal NM, et al. Long-term results (>25 years) of a randomized, prospective clinical trial evaluating chemotherapy in patients with high-grade, operable osteosarcoma. Cancer. 2012;118(23):5888–93. - PubMed
    1. Schulze CJ, et al. Chemical remodeling of a cellular chaperone to target the active state of mutant KRAS. Science. 2023;381(6659):794–9. - PMC - PubMed
    1. Kemp SB, et al. Efficacy of a Small-Molecule Inhibitor of KrasG12D in Immunocompetent Models of Pancreatic Cancer. Cancer Discov. 2023;13(2):298–311. - PMC - PubMed
    1. Yu Z, et al. Characterization of a small-molecule inhibitor targeting NEMO/IKKβ to suppress colorectal cancer growth. Signal Transduct Target Ther. 2022;7(1):71. - PMC - PubMed

LinkOut - more resources