. 2025 Jul 24;16(1):1400.
doi: 10.1007/s12672-025-03084-z.

Integrated network toxicology and bioinformatics reveal PFAS-driven prognostic biomarkers and molecular mechanisms in breast cancer: insights from transcriptome analysis and molecular docking

Affiliations

Integrated network toxicology and bioinformatics reveal PFAS-driven prognostic biomarkers and molecular mechanisms in breast cancer: insights from transcriptome analysis and molecular docking

Yingqiang Fu et al. Discov Oncol. .

Abstract

Background: Per- and polyfluoroalkyl substances (PFAS), pervasive environmental contaminants, are increasingly linked to breast cancer, yet their molecular mechanisms remain unclear. This study integrates network toxicology and bioinformatics to elucidate PFAS-associated pathways and prognostic biomarkers in breast cancer.

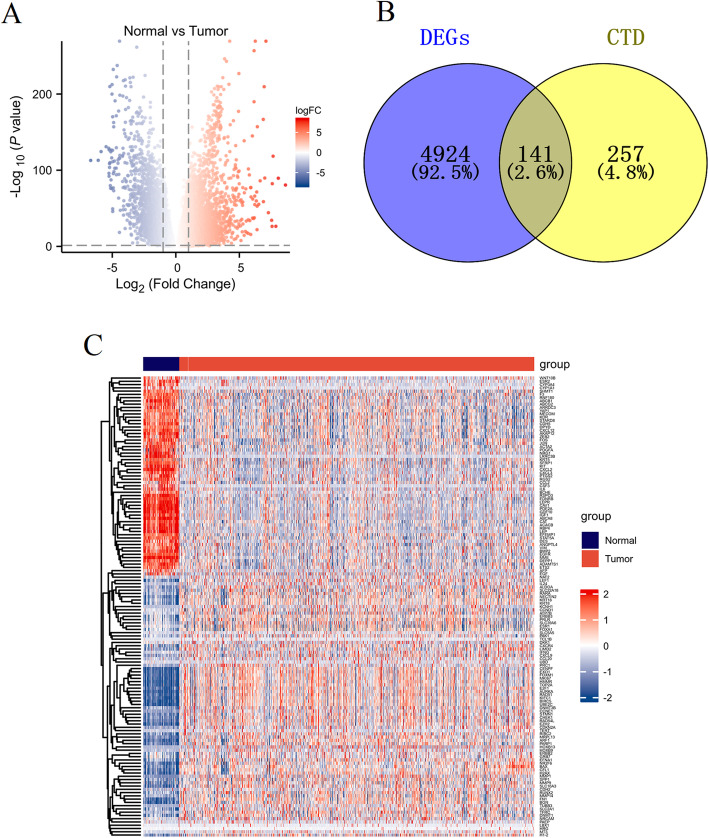
Methods: Using the TCGA-BRCA dataset, we identified differentially expressed genes (DEGs) between normal and breast cancer tissues. We cross-referenced these genes with PFAS-related genes from the Comparative Toxicogenomics Database (CTD) to identify common targets. Enrichment analysis, network construction, and survival analysis were performed to elucidate the biological mechanisms and prognostic value. The CIBERSORT algorithm assessed immune cell infiltration, and molecular docking evaluated interactions between PFAS compounds and key genes.

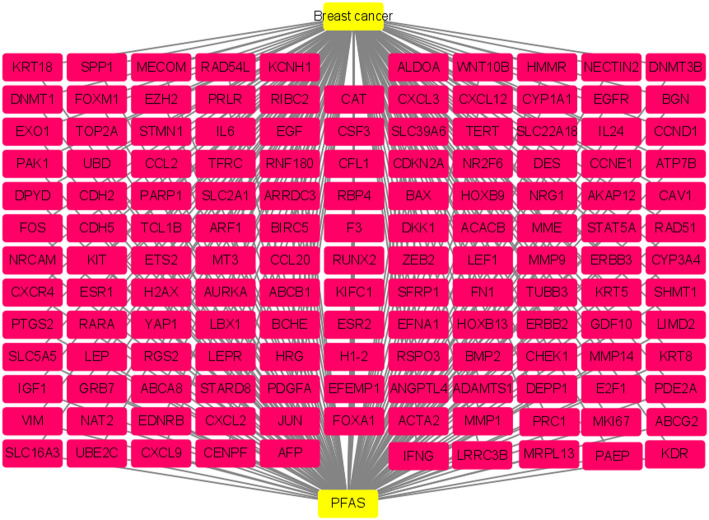
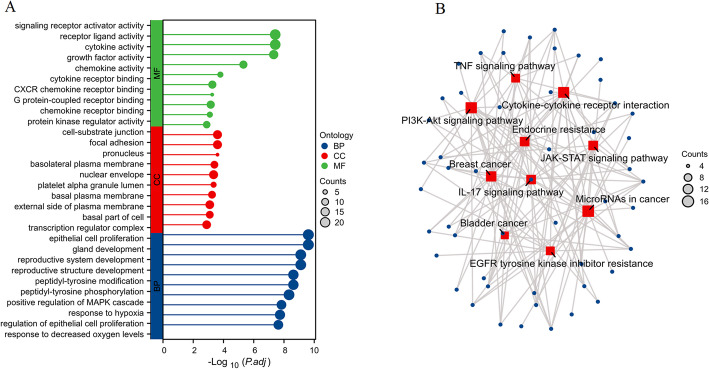
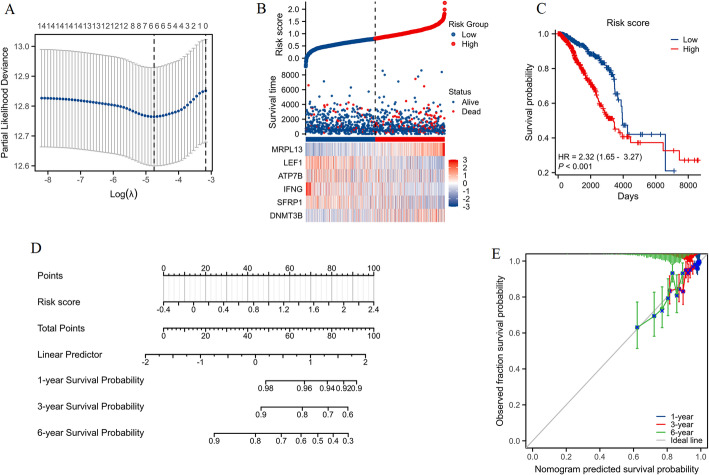
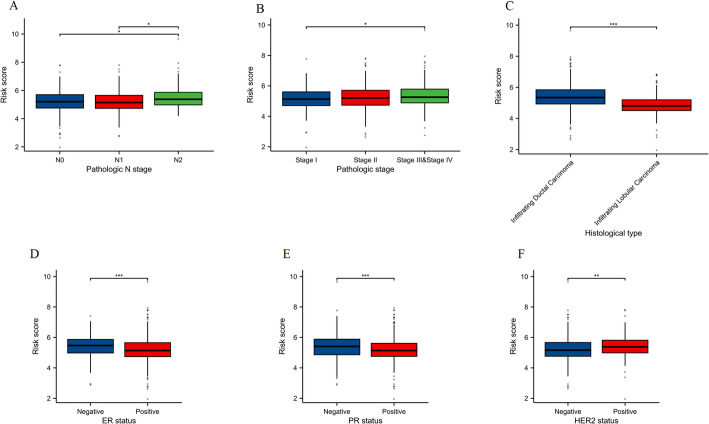
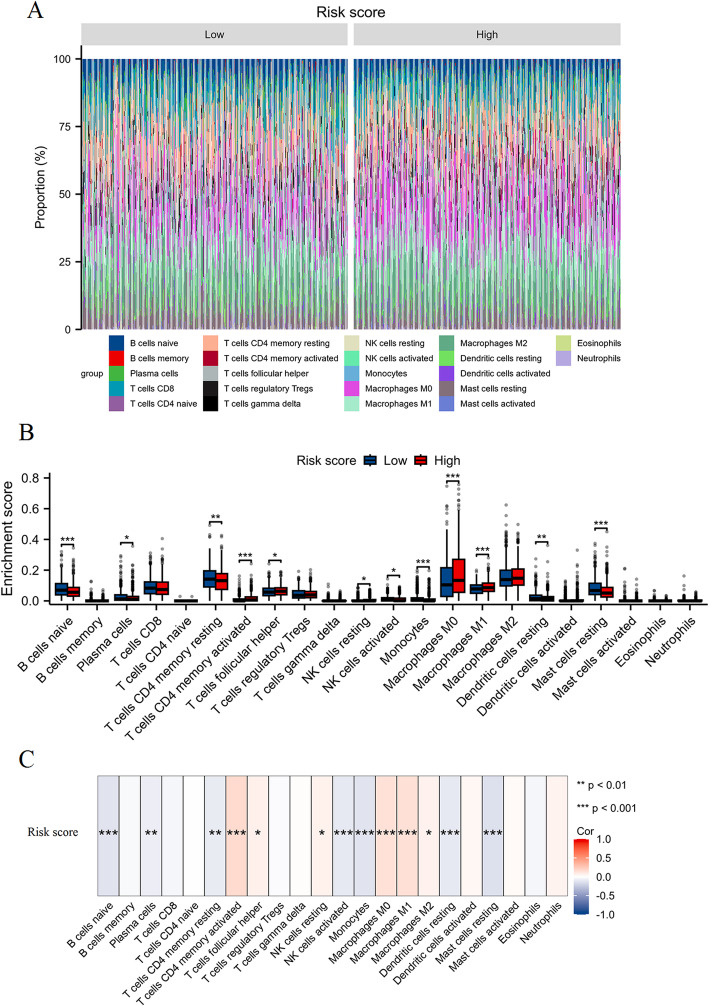
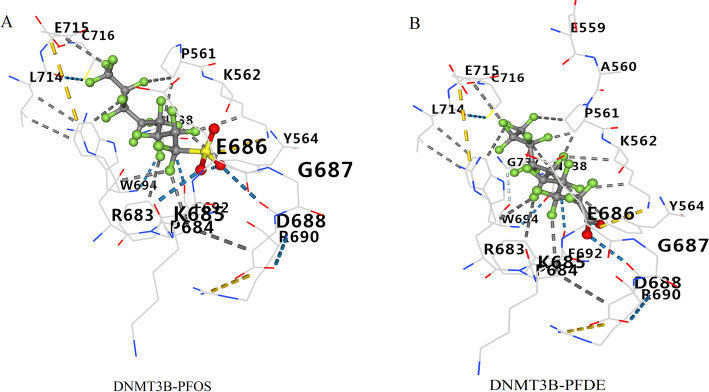
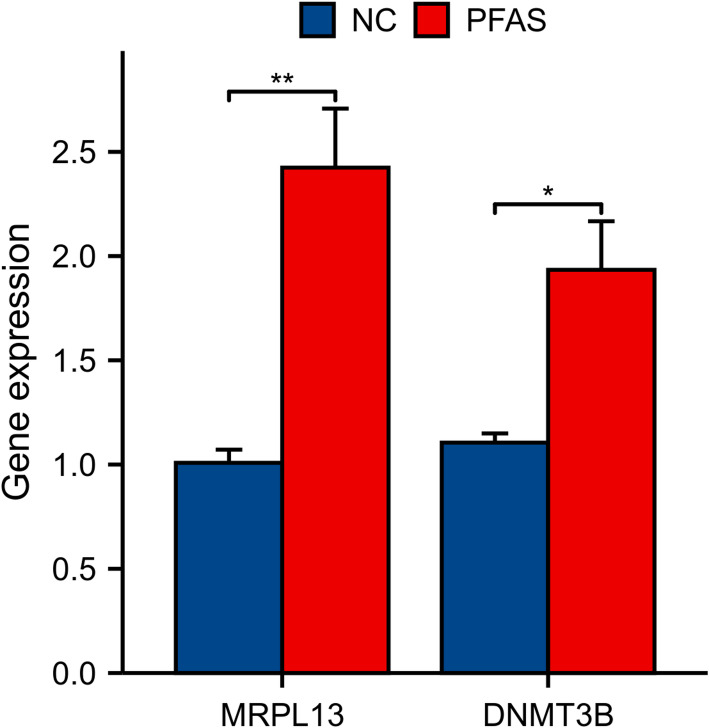
Results: We identified 141 common DEGs, significantly enriched in pathways related to cytokine activity, growth factor activity, and chemokine receptor binding. A PFAS-toxicity target-breast cancer network illustrated potential mechanistic pathways. Six key prognostic genes (MRPL13, LEF1, ATP7B, IFNG, SFRP1, DNMT3B) were identified, forming a risk model that stratified patients with significant differences in survival. Higher risk scores were associated with advanced stages, specific histological types, and hormone receptor statuses. Immune cell infiltration analysis revealed distinct profiles between high and low-risk groups, with high-risk patients exhibiting elevated activated T cells and macrophages. Molecular docking showed strong interactions between PFAS compounds (PFOS and PFDE) and DNMT3B, suggesting potential gene function disruptions.

Conclusion: PFAS exposure is linked to altered gene expression, immune cell infiltration, and potential disruptions in key genes, contributing to breast cancer development and progression. These findings provide insights into potential therapeutic targets and underline the importance of addressing environmental factors in breast cancer management.

Keywords: Bioinformatics; Breast cancer; Molecular docking; Network toxicology; Per- and polyfluoroalkyl substances; Tumor microenvironment.


Conflict of interest statement

Declarations. Ethics approval and consent to participate: This study utilized genomic data from The Cancer Genome Atlas (TCGA), a publicly available dataset. As such, individual patient consent and ethics approval were not applicable to this study. However, we acknowledge that TCGA data has been ethically collected, and appropriate informed consent for the use of the data was obtained from patients as part of the original TCGA research protocols. Consent for publication: Not applicable. Competing interests: The authors declare no competing interests.

Figures

Fig. 1
Fig. 1
Identification and characterization of PFAS-related differential gene expression in breast cancer. A Volcano plot illustrating DEGs from the TCGA-BRCA dataset. Red dots represent significantly upregulated genes in tumor tissues, and blue dots denote significantly downregulated genes, based on log fold change (logFC) and p-value thresholds. B Venn diagram representing the overlap between DEGs identified from the TCGA-BRCA dataset and PFAS-related genes obtained from the CTD. The intersection highlights 141 common genes. C Heatmap visualization of the 141 differentially expressed PFAS-related genes in the TCGA-BRCA dataset. Distinct expression patterns are shown between normal (blue) and tumor (red) tissues
Fig. 2
Fig. 2
The network graph represents the interactions between PFAS, toxicological targets (genes), and breast cancer. The yellow node at the bottom represents PFAS, and the yellow node at the top represents breast cancer. The pink nodes between them represent the 141 differentially expressed PFAS-related genes identified in the TCGA-BRCA dataset. Edges (lines) indicate connections between PFAS and toxicological targets, as well as between toxicological targets and breast cancer
Fig. 3
Fig. 3
Enrichment analysis of differentially expressed PFAS-related toxicological targets in breast cancer. A GO enrichment analysis of the 141 differentially expressed PFAS-related genes in breast cancer, categorized into Biological Process (BP), Cellular Component (CC), and Molecular Function (MF). The x-axis represents the adjusted p-value (− Log10), while the y-axis lists the significantly enriched GO terms. The size of the dots corresponds to the count of genes associated with each term. B KEGG pathway enrichment network of the 141 differentially expressed PFAS-related genes. Red squares represent significantly enriched pathways, while blue circles represent genes. The size of the nodes reflects the number of genes associated with each pathway
Fig. 4
Fig. 4
Construction of a prognostic model for breast cancer patients based on PFAS-related gene expression. A Lasso regression analysis to select key prognostic genes from the 15 identified prognostic genes. The plot shows partial likelihood deviance as a function of log(λ). The vertical dashed line represents the optimal log(λ) value, which corresponds to the selection of 6 key prognostic genes. B Risk score distribution and survival status of breast cancer patients based on the 6 key prognostic genes (MRPL13, LEF1, ATP7B, IFNG, SFRP1, DNMT3B). The heatmap at the bottom shows the expression levels of these genes across the high-risk (red) and low-risk (blue) groups. C Kaplan-Meier survival analysis comparing overall survival between high-risk and low-risk groups stratified by the risk score. D Nomogram constructed based on the risk score to predict 1-year, 3-year, and 6-year survival probabilities in breast cancer patients. Points are assigned based on the risk score, and total points correspond to survival probabilities. E Calibration plots for the nomogram, showing the agreement between predicted survival probabilities and observed outcomes for 1-year, 3-year, and 6-year survival
Fig. 5
Fig. 5
Assessment of PFAS-related risk scores across various clinical subgroups in the TCGA-BRCA dataset. A Comparison of risk scores among different pathological N stages (N0, N1, N2). B Comparison of risk scores across different pathological stages (Stage I, Stage II, Stage III and IV). C Comparison of risk scores between histological types of breast cancer. D Comparison of risk scores based on Estrogen Receptor (ER) status. E Comparison of risk scores based on Progesterone Receptor (PR) status. F Comparison of risk scores based on HER2 status (*P < 0.05, **P < 0.01, ***P < 0.001)
Fig. 6
Fig. 6
Differential immune cell infiltration between high-risk and low-risk breast cancer patients based on PFAS-related risk scores. A Stacked bar plot depicting the proportions of various immune cell types in low and high-risk groups, as determined by the CIBERSORT algorithm. The colors represent different immune cell types. B Box plots comparing the enrichment scores of specific immune cell types between low-risk (blue) and high-risk (red) groups. Significant differences are denoted by asterisks (*P < 0.05, **P < 0.01, ***P < 0.001). C Correlation heatmap showing the relationship between PFAS-related risk scores and immune cell infiltration levels. The color gradient represents the correlation coefficient (Cor). Significant correlations are marked with asterisks (*P < 0.05, **P < 0.01, ***P < 0.001)
Fig. 7
Fig. 7
Visualization of molecular docking binding sites for DNMT3B with PFOS and PFDE. A Binding site of DNMT3B with PFOS. B Binding site of DNMT3B with PFDE
Fig. 8
Fig. 8
Gene expression levels of MRPL13 and DNMT3B in MCF-7 cells treated with PFOS compared to the NC group. Data are expressed as mean values ± standard deviation (SD). **p < 0.01, *p < 0.05

Similar articles

References

    1. Kim S, Thapar I, Brooks BW. Epigenetic changes by per- and polyfluoroalkyl substances (PFAS). Environ Pollut (Barking Essex: 1987). 2021;279:116929. - PubMed
    1. Evich MG, Davis MJB, McCord JP, Acrey B, Awkerman JA, Knappe DRU, Lindstrom AB, Speth TF, Tebes-Stevens C, Strynar MJ, et al. Per- and polyfluoroalkyl substances in the environment. Sci (New York NY). 2022;375(6580):eabg9065. - PMC - PubMed
    1. Petersen KU, Larsen JR, Deen L, Flachs EM, Hærvig KK, Hull SD, Bonde JPE, Tøttenborg SS. Per- and polyfluoroalkyl substances and male reproductive health: a systematic review of the epidemiological evidence. J Toxicol Environ Health Part B Crit Reviews. 2020;23(6):276–91. - PubMed
    1. Fenton SE, Ducatman A, Boobis A, DeWitt JC, Lau C, Ng C, Smith JS, Roberts SM. Per- and polyfluoroalkyl substance toxicity and human health review: current state of knowledge and strategies for informing future research. Environ Toxicol Chem. 2021;40(3):606–30. - PMC - PubMed
    1. Wan MLY, Co VA, El-Nezami H. Endocrine disrupting chemicals and breast cancer: a systematic review of epidemiological studies. Crit Rev Food Sci Nutr. 2022;62(24):6549–76. - PubMed

LinkOut - more resources