. 2025 Jul;533(7):e70078.
doi: 10.1002/cne.70078.

Spatial Distribution and Morphology of CaMKII-Expressing Amacrine Cells in Marmoset, Macaque, and Human Retina

Affiliations

Spatial Distribution and Morphology of CaMKII-Expressing Amacrine Cells in Marmoset, Macaque, and Human Retina

Alyssa K Baldicano et al. J Comp Neurol. 2025 Jul.

Abstract

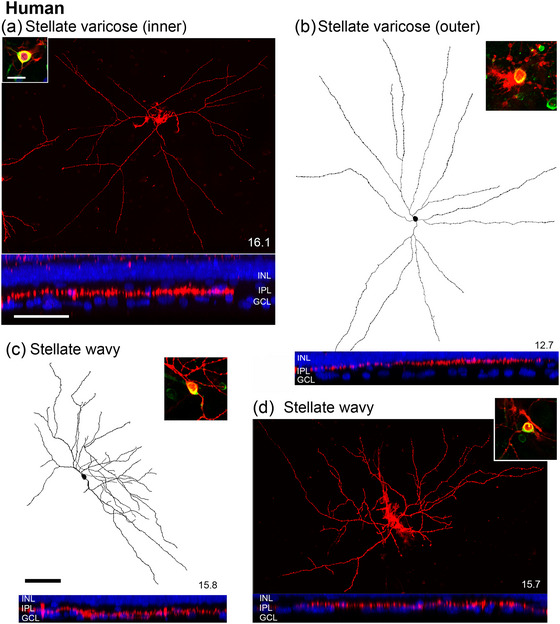
Over 30 types of amacrine cells have been described in the primate retina, yet few are well characterized. Here, we investigated amacrine cells expressing the alpha subunit of calcium/calmodulin-dependent protein kinase II (CaMKII) in the retinas of human, macaque (Macaca fascicularis, Macaca nemestrina), and marmoset (Callithrix jacchus) monkeys using immunohistochemistry and intracellular injections, with a focus on displaced amacrine cells (dACs) in the ganglion cell layer. The spatial density of CaMKII-positive dACs decreases with the distance from the fovea, but in the peripheral temporal retina, the density of CaMKII-positive dACs nevertheless exceeds the density of retinal ganglion cells. In all species, CaMKII-positive dACs include cells expressing choline acetyltransferase (ChAT) cells, but in the human retina, only 60% of the ON ChAT population is CaMKII-positive. Conversely, in the marmoset and the macaque, about 80% of ON ChAT cells co-express CaMKII, but only 55% of ON ChAT cells in humans do so. Intracellular injections of CaMKII-positive dACs with the lipophilic dye DiI revealed ON starburst and semilunar Type 3 cells in all three species, but in the human retina, at least three additional types were detected. In the inner nuclear layer, CaMKII is expressed by multiple populations of amacrine cells, which are distinguished based on their soma size and staining intensity, but OFF ChAT cells do not co-express CaMKII. We conclude that ON- and OFF-ChAT cells show distinct patterns of CaMKII expression and that the diversity of CaMKII-expressing dACs in humans is greater than that in marmoset or macaque retina.

Keywords: CaMKII; amacrine cells; human; macaque; marmoset; primate retina; vision.


Conflict of interest statement

Dr. Grünert is an editorial board member of The Journal of Comparative Neurology and the corresponding author of this article. To minimize bias, they were excluded from all editorial decision‐making related to the acceptance of this article for publication.

Figures

FIGURE 1
FIGURE 1
CaMKII expression in the central retina of marmoset (a–d), macaque (e–h), and human (i–l). Confocal images of vertical vibratome sections, which were processed with antibodies against CaMKII (magenta) and RNA‐binding protein with multiple splicing (RBPMS, green). Retina layers are visualized with Nomarski optics in (a), (e), and (i). DAPI labeling (white) is used to reveal the INL and GCL. The filled arrows point to double‐labeled cells (CaMKII‐expressing ganglion cells), and the arrowheads point to single‐labeled cells (CaMKII‐expressing amacrine cells). GCL, ganglion cell layer; INL, inner nuclear layer; IPL, inner plexiform layer. The scale bar shown in (d) = 50 µm applies to all.
FIGURE 2
FIGURE 2
CaMKII expression in the ganglion cell layer. Confocal images of flat mount preparations from the temporal retina of marmoset (a–c), macaque (d–f), and human (g–i), which were processed with antibodies against CaMKII (magenta) and RNA‐binding protein with multiple splicing (RBPMS, green). The numbers shown on the bottom right in the right panels indicate the eccentricity in mm. The focus is on the ganglion cell layer. The filled arrows point to double‐labeled cells (CaMKII‐expressing ganglion cells). The arrowheads point to single labeled cells (CaMKII‐expressing displaced amacrine cells), with filled arrowheads indicating cells with small round somas and open arrowheads indicating cells with large somas. The scale bar shown in (a) = 50 µm applies to all.
FIGURE 3
FIGURE 3
Spatial density and proportion of CaMKII‐positive cells in the ganglion cell layer. The spatial density of RBPMS‐positive ganglion cells (RGC) and CaMKII‐positive displaced amacrine cells (dAC) in marmoset (a), macaque (b), and human (c) retinas plotted across the horizontal meridian. Each data point represents a sample calculated from a region of interest at various eccentricities for all CaMKII‐expressing displaced amacrine cells (magenta) and ganglion cells (RBPMS, green). Solid lines show best fit, and error bars show standard deviations. (d–f) The proportion of CaMKII‐expressing amacrine cells in marmoset (d), macaque (e), and human (f) retinas increases with distance from the fovea. Pooled data from vibratome sections and flat mount preparations. The RGC data are replotted from Baldicano et al. (2022) and pooled with the data from the triple‐labeled flat mount preparations. The data for CaMKII‐positive dACs were obtained from the same preparations.
FIGURE 4
FIGURE 4
CaMKII‐positive amacrine cells include ON ChAT cells. Confocal images of vertical vibratome sections through the central retina of marmoset (a–c) and macaque (d–f) retinas. Sections were processed with antibodies against CaMKII (magenta) and choline acetyltransferase (ChAT, green). Retina layers are visualized using Nomarski optics in (a, b, d, e). (g–l) Confocal images of flat mount preparations of marmoset (g, h), macaque (i, j), and human (k, l) retinas, which were triple labeled with antibodies against CaMKII (magenta), ChAT (green), and the ganglion cell marker RBPMS (white). The focus is on the ganglion cell layer. The white arrows point to double‐labeled cells (CaMKII‐positive/ChAT‐positive), white arrowheads point to single‐labeled CaMKII‐positive cells, and asterisks indicate CaMKII‐positive ganglion cells. Numbers shown on the bottom right in the right panel indicate eccentricity in mm. Scale bars = 50 µm. The scale bar in (c) applies to (a–f). The scale bar in (g) applies to (g–i).
FIGURE 5
FIGURE 5
Spatial density of CaMKII‐expressing displaced amacrine cells (magenta), ON ChAT cells (cyan), and cells expressing both markers (yellow) in marmoset (a), macaque (b), and human (c) retinas. Each data point represents a sample calculated from a region of interest at various eccentricities. Pooled data from vibratome sections and flat mount preparations. Data from the central retina were obtained from double‐labeled vibratome sections (CaMKII and ChAT). Data in the peripheral retina were obtained from triple‐labeled flat mount preparations (CaMKII, ChAT, RBPMS).
FIGURE 6
FIGURE 6
Morphology of DiI‐injected CaMKII‐positive displaced amacrine cells in marmoset retina. Confocal images and reconstructions of DiI (red) injected CaMKII‐positive displaced amacrine cells. The eccentricity in mm for each cell is indicated in the lower right corner. (a) confocal image and (b) drawing of a semilunar Type 3 cell. The inset shows the CaMKII‐positive soma. A thin axon‐like process is seen emerging from the soma (arrows). The lower panel shows an orthogonal projection revealing the dendritic stratification (red) and DAPI labeling (blue). The dendrites of the cell sit flush against the GCL. (c–d) Confocal images of two CaMKII‐positive semilunar Type 3 cells with thorny dendrites. The upper left panels show the CaMKII‐positive somas, and the upper right panels show close‐ups of the boxed region. Numerous thorny processes can be seen emerging from the dendrites. The arrow points to a fine axon‐like process. Lower panels show the dendritic stratification close to the GCL. (e) ON‐starburst cell. Top: Confocal images of the soma of a DiI‐injected (red) CaMKII‐positive (green) ON starburst cell. The soma co‐expressed CaMKII (green) and ChAT (cyan). Middle: Drawing of the injected cell. The lower panel shows the dendritic stratification. INL, inner nuclear layer; IPL, inner plexiform layer; GCL, ganglion cell layer. The scale bar shown in (a) = 100 µm applies to (a, b, and the middle panels of c, d, and e). The scale bar shown in the inset (a) = 10 µm and applies to all soma images. The scale bar shown in the lower panel (a) = 50 µm applies to all lower panels. The scale bar shown in the top right panel (c) = 20 µm applies to (top right panels in c and d).
FIGURE 7
FIGURE 7
Morphology of CaMKII‐positive displaced amacrine cells in macaque retina. Confocal images and reconstructions of DiI (red) injected CaMKII‐positive cells. Eccentricity in mm for each cell is indicated in the lower right corner. (a) Confocal image of a semilunar Type 3 cell. The inset shows the soma of the injected cell. (b) Drawing of the cell shown in (a). The arrow points to the fine axon‐like process of the cell. Bottom panel: orthogonal projection of a stack of images revealing dendritic stratification (red) and DAPI labeling (blue). (c) Drawing of a CaMKII‐positive ON starburst cell. The soma of the DiI‐injected ON starburst cell shown on the left co‐expresses CaMKII (green) and ChAT (cyan). INL, inner nuclear layer; GCL, ganglion cell layer; IPL, inner plexiform layer. The scale bar shown in (a) = 100 µm applies to (a, b, and c). The scale bar shown in soma images = 10 µm. The scale bar shown in the bottom panels (orthogonal views) = 50 µm.
FIGURE 8
FIGURE 8
Morphology of CaMKII‐positive displaced amacrine cells in human retina. Confocal images and reconstructions of DiI (red) injected cells. Insets show somas of CaMKII (green) injected cells. The eccentricity in mm of each cell is in the lower right corner. The lower panels show orthogonal projections revealing dendritic stratification (red) and DAPI labeling (blue). (a) Confocal image of an inner stratifying stellate varicose cell. (b) Reconstruction of an outer stratifying stellate varicose. (c) Reconstruction of a stellate wavy cell. (d) Micrograph of a stellate wavy cell. The inset scale bar = 20 µm applies to all soma images. The scale bar shown in the lower panel (a) = 50 µm applies to all lower panels. The scale bar shown in (c) = 100 µm applies to (a–d).
FIGURE 9
FIGURE 9
Morphology of CaMKII‐positive displaced amacrine cells in human retina. Confocal images and reconstructions of DiI (red) injected cells. Insets show somas of CaMKII (green) injected cells. Eccentricity in mm of each cell is shown in the lower right corner. (a–c lower panels) Orthogonal projections revealing dendritic stratification (red) and DAPI labeling (blue). (a) Semilunar Type 3 cell. The cell stratifies close to the ganglion cell layer in S5. (b) Semilunar Type 1 cell. The cell stratifies in S1. (c) Thorny Type 2 cell. The cell stratifies in the middle of the IPL. The boxed region indicates the inset shown on the bottom right. Arrows point to axons. The scale bar shown in (a) = 100 µm applies to (a, j, and all drawings). The inset scale bar = 20 µm applies to all soma insets. The scale bar shown in (a) lower panel = 50 µm applies to all orthogonal projections. The scale bar shown in the inset (d) = 20 µm.
FIGURE 10
FIGURE 10
CaMKII‐positive amacrine somas in the ganglion cell layer in the human retina. Confocal images of DiI‐injected CaMKII‐positive amacrine cell somas (green). The blue channel shows DAPI‐labeled cell nuclei. SL1, semilunar Type 1; SL3, semilunar Type 3; StV inner, inner stratifying stellate varicose cell; StW, stellate wavy cell. The scale bar = 10 µm, applies to all.
FIGURE 11
FIGURE 11
Staining intensity and soma sizes of CaMKII‐positive displaced amacrine cells of marmoset (a), macaque (b), and human (c) retina. Overlapping soma sizes represent starburst cells co‐expressing both markers.
FIGURE 12
FIGURE 12
OFF ChAT cells do not express CaMKII. Confocal images of flat mount preparations from marmoset (a), macaque (b), and human (c) retinas processed for CaMKII (magenta) and ChAT (green) immunofluorescence. The focus is on the inner nuclear layer (INL). CaMKII is not colocalized with ChAT. The white arrows point to large, strongly labeled CaMKII‐positive cells; the open arrows point to weakly labeled CaMKII‐positive cells. The white arrowheads point to strongly labeled ChAT cells, and the open arrowheads point to weakly labeled ChAT cells. The eccentricity in mm is indicated in the lower right corner. Scale bar in (a) = 50 µm, applies to (a–c).
FIGURE 13
FIGURE 13
Spatial density of CaMKII‐expressing amacrine cells and OFF starburst cells in the inner nuclear layer (INL) of marmoset (a), macaque (b), and human (c) retinas. Each data point represents a sample calculated from a region of interest at various eccentricities of strongly CaMKII‐expressing (magenta circles), weakly CaMKII‐expressing (light pink squares), and OFF starburst cells (ChAT, cyan diamonds).
FIGURE 14
FIGURE 14
Morphology of a CaMKII‐positive amacrine cell in the INL of macaque retina. (a–c) Confocal images of a DiI‐injected knotty bistratified amacrine cell at 6.1 mm eccentricity. (b) Outer dendrites. (c) Inner dendrites. (d–e) Soma of the CaMKII injected cells (green). (f) Orthogonal projection revealing dendritic stratification (red) and DAPI labeling (blue). (g) and (h) 3d reconstruction of the cell shown in (a‐c). The scale bar shown in (a) = 50 µm applies to (a–c, g). The scale bar shown in (d) = 10 µm applies to (d) and (e). Scale bar in (f) = 50 µm. The scale bar in (h) = 10 µm.
FIGURE 15
FIGURE 15
Morphology of two CaMKII‐positive amacrine cells in the human retina, located in the inner nuclear layer (INL) and inner plexiform layer (IPL), respectively. The scale bar shown in a = 100 µm applies to all.
FIGURE 16
FIGURE 16
Staining intensity and soma sizes of CaMKII‐positive amacrine cells in the inner nuclear layer of marmoset (a), macaque (b), and human (c) retina. Strongly CaMKII‐positive (purple circles), weakly CaMKII‐positive (brown squares), and ChAT‐positive (green diamonds) cells can be distinguished by soma size.
FIGURE 17
FIGURE 17
Dot plots showing the relative expression of CaMKII (CAMK2A) and other genetic markers in amacrine cell clusters of human and macaque retina. The size of the circle indicates the percentage of cells expressing the gene, and the color indicates the relative expression level. Human data are from Yan, Peng, et al. (2020), macaque data are from Peng et al. (2019). The purple highlight represents clusters with CaMKII expression. AII, AII amacrine cell; SAC, starburst amacrine cell.
FIGURE 18
FIGURE 18
Schematic summary diagram showing the soma location and stratification of CaMKII‐expressing amacrine cells in marmoset, macaque, and human retinas. The grey bands represent the stratification of ChAT‐positive starburst cells, which delineate the five strata (S1–S5) of the IPL. Axon stratification is indicated in dark blue. GCL, ganglion cell layer; INL, inner nuclear layer; IPL, inner plexiform layer.

Similar articles

References

    1. Baldicano, A. K. , Nasir‐Ahmad S., Novelli M., et al. 2022. “Retinal Ganglion Cells Expressing CaM Kinase II in Human and Nonhuman Primates.” Journal of Comparative Neurology 530: 1470–1493. - PMC - PubMed
    1. Bordt, A. S. , Patterson S. S., Girresch R. J., et al. 2021. “Synaptic Inputs to Broad Thorny Ganglion Cells in Macaque Retina.” Journal of Comparative Neurology 529: 3098–3111. - PMC - PubMed
    1. Boycott, B. B. , and Dowling J. E.. 1969. “Organization of the Primate Retina: Light Microscopy.” Philosophical Transactions of the Royal Society of London Series B‐Biological Sciences 255: 109–176. - PubMed
    1. Buccitelli, C. , and Selbach M.. 2020. “mRNAs, Proteins and the Emerging Principles of Gene Expression Control.” Nature Reviews Genetics 21: 630–644. - PubMed
    1. Busskamp, V. , Picaud S., Sahel J. A., and Roska B.. 2012. “Optogenetic Therapy for Retinitis Pigmentosa.” Gene Therapy 19: 169–175. - PubMed

Substances

LinkOut - more resources