Clinical Trial
. 2025 Jul 24;135(19):e177813.
doi: 10.1172/JCI177813. eCollection 2025 Oct 1.

A predictive endocrine resistance index accurately stratifies luminal breast cancer treatment responders and nonresponders

Affiliations
Clinical Trial

A predictive endocrine resistance index accurately stratifies luminal breast cancer treatment responders and nonresponders

Guokun Zhang et al. J Clin Invest. .

Abstract

BACKGROUNDEndocrine therapy (ET) with tamoxifen (TAM) or aromatase inhibitors (AI) is highly effective against hormone receptor-positive (HR-positive) early breast cancer (BC), but resistance remains a major challenge. The primary objectives of our study were to understand the underlying mechanisms of primary resistance and to identify potential biomarkers.METHODSWe selected more than 800 patients in 3 subcohorts (Discovery, n = 364, matched pairs; Validation 1, n = 270, Validation 2, n = 176) of the West German Study Group (WSG) ADAPT trial who underwent short-term preoperative TAM or AI treatment. Treatment response was assessed by immunohistochemical labeling of proliferating cells with Ki67 before and after ET. We performed comprehensive molecular profiling, including targeted next-generation sequencing (NGS) and DNA methylation analysis using EPIC arrays, on posttreatment tumor samples.RESULTSTP53 mutations were strongly associated with primary resistance to both TAM and AI. We identified distinct DNA methylation patterns in resistant tumors, suggesting alterations in key signaling pathways and tumor microenvironment composition. Based on these findings and patient age, we developed the Predictive Endocrine ResistanCe Index (PERCI). PERCI accurately stratified responders and nonresponders in both treatment groups in all 3 subcohorts and predicted progression-free survival in an external validation cohort and in the combined subcohorts.CONCLUSIONOur results highlight the potential of PERCI to guide personalized endocrine therapy and improve patient outcomes.TRIAL REGISTRATIONWSG-ADAPT, ClinicalTrials.gov NCT01779206, retrospectively registered 01-25-2013.FUNDINGGerman Cancer Aid (Grant Number 70112954), German Federal Ministry of Education and Research (Grant Number 01ZZ1804C, DIFUTURE).

Keywords: Bioinformatics; Breast cancer; Clinical Research; Clinical trials; Epigenetics; Oncology.


Conflict of interest statement

Conflict of interest: OG received honoraria from Genomic Health/Exact Sciences, Roche, Pfizer, Novartis, Agendia, and AstraZeneca; served in consulting/advisory role for Genomic Health/Exact Sciences, Gilead, AstraZeneca, Lilly, MSD, Novartis, Pfizer, Daiichi Sankyo, and Roche; and received travel support from Pfizer and Daiichi Sankyo; and reports a codirector position at West German Study Group. NH received honoraria from AstraZeneca, Daiichi-Sankyo, Gilead, Lilly, Merck Sharp & Dohme, Novartis, Pfizer, Pierre Fabre, Roche, Viatris, and Zuellig Pharma; served in consulting/advisory role for Agendia, AstraZeneca, Celgene, Daiichi Sankyo, Lilly, Merck Sharp & Dohme, Novartis, Odonate Therapeutics, Pfizer, Pierre Fabre, Roche/Genentech, Sandoz, and Seattle Genetics; and she reports a codirector position at West German Study Group; her institution received research funding from Lilly, Merck Sharp & Dohme, Novartis, Pfizer, and Roche/Genentech. RK served in a consulting/advisory role for the West German Study Group. UL received speaker honoraria from AstraZeneca, MenariniStemline, and GSK and received materials from AstraZeneca. SB received speaker honoraria from Thermo Fisher Scientific. CZE has a consulting contract and received consulting fees from West-German Study Group (WSG). SK received consulting fees from Lilly, MSD, and Stryker; he received honoraria from AstraZeneca, Lilly, Pfizer, Novartis, Amgen, Somatex, pfm medical, MSD, Daiichi Sankyo, Seagen, Gilead Science, Agendia, Exact Science, Roche, Hologig, and PINK!; received travel support from Roche, Daiichi Samkyo, Lilly, Stemline, and MSD; has an advisory role for Novartis, Amgen, pfm medical, MSD, Daiichi Sankyo, Seagen, Gilead Science, Agendia, Exact Science, Roche, Sonoscape, Lilly, AstraZeneca, and Pfizer; has an advocacy function for AGO, WSG, and ESMO; and his institution received study material from Novartis, Amgen, Daiichi Sankyo, Gilead, AstraZeneca, Pfizer, Lilly, MSD, Roche, Stemline, Hologic, PINK!, and Agendia. UN reports honoraria from Agendia, Amgen, Celgene, Genomic Health, NanoString Technologies, Novartis Pharma, Pfizer Pharmaceuticals, Roche/Genentech, and Teva; consulting or advisory role for Genomic Health, Roche, and Seagen; research funding from Agendia, Amgen, Celgene, Genomic Health, NanoString Technologies, Roche, and Sanofi; expert testimony for Genomic Health; travel support from Genomic Health, Pfizer Pharmaceuticals, and Roche; and a codirector position at West German Study Group.

Figures

Figure 1
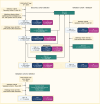
Figure 1. Flowchart of the sample selection.
Samples were selected from the WGS-ADAPT trial for the discovery cohort (left, matched sample design), the validation cohort 1 (right, unmatched design), and from the run-in phase of the WGS-ADAPT trial for validation cohort 2 (bottom, unmatched design), respectively.
Figure 2
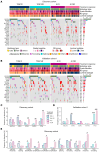
Figure 2. Descriptive statistics of the discovery cohort and validation cohort 1.
Distribution of patients (R, responders; NR, nonresponders) according to clinico-pathological parameters before (baseline) and/or after antihormone treatment (post-pET) in the discovery cohort (n = 364, TAM n = 214, AI n = 150) (AG) and validation cohort 1 (n = 270, TAM n = 155, AI n = 115) (HN). (A and H) tumor grade; (B and I) histology type; (C and J) progesterone receptor (PR) status; (D and K) luminal subtype; (E and L) recurrence score (RS); (F and M) stromal tumor-infiltrating lymphocytes in pathologic tissue sections (PaTILs, patients without PaTIL data were excluded); (G and N) percentage of Ki67-positive staining in IHC. Statistical differences of numerical variables between matched pairs as well as between baseline and post-pET comparisons were tested using paired Wilcoxon tests. All other comparisons of numerical variables were analyzed using nonpaired Wilcoxon tests. Statistical differences of categorical variables between matched pairs as well as between baseline and post-pET comparisons were analyzed using McNemar test. All other comparisons of categorical variables were analyzed using Fisher’s exact test. For all statistical tests, asterisks *P < 0.05, **P < 0.01, ***P < 0.001, ****P < 0.0001. Boxplots show median (line), upper, and lower quartiles (boxes), and lines extending to 1.5-interquartile range (IQR) (whiskers).
Figure 3
Figure 3. Recurrent genomic alterations.
Oncoprints of recurrent genomic alterations (RGA; at minimum 7.5% recurrence in either subgroup) in post-pET samples in the discovery cohort (n = 364, TAM n = 214, AI n = 150) (A) and validation cohort 1 (n = 270, TAM n = 155, AI n = 115) (B), color-coded by mutation type. Clinical annotations are indicated at the top. Frequencies of RGA recurrence per cohort on the right side. Legend is for both A and B. (C and D) Alteration frequencies of selected RGA with significant associations with pET response in the discovery cohort (C) and the validation cohort 1 (D), analyzed using Fisher-exact test *P < 0.025, **P < 0.01, ***P < 0.001, (E) RGA with significant differences between R and NR in the discovery cohort when stratified by alteration type, analyzed using Fisher-exact test with #P < 0.1, *P < 0.05, **P < 0.01.
Figure 4
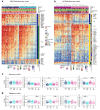
Figure 4. pET-specific alterations in the methylome and tumor microenvironment.
(A and B) Heatmaps of methylation beta values of TAM DMS (A) and AI DMS (B) in the discovery cohort (n = 360, TAM n = 210, AI n = 150). Clinical annotations are indicated at the top. Gain (NR > R, yellow) and loss (NR < R, blue) in methylation in NR, overlap with PMDs (green) and defined chromatin regions, and gene symbols are indicated on the right side. Rows (CpG sites) and columns (cases) are clustered by Euclidean distance and ward.D linkage. The heatmaps are split by response groups (columns) and by methylation change and location in PMDs (rows). (C and D) Methylation-derived cell type proportions of BC samples in the discovery (C) and validation cohort 1 (D). R and NR groups per treatment were compared using Wilcoxon test with fdr-adjusted P values: *P < 0.05, **P < 0.01, ***P < 0.001. Boxplots show median (line), upper, and lower quartiles (boxes), and lines extending to 1.5-IQR (whiskers).
Figure 5
Figure 5. Developing the ‘Predictive Endocrine ResistanCe Index’ PERCI.
(A) Workflow describing the development of PERCI based on the discovery cohort (n = 357, TAM n = 209, AI n = 148). (B and D) Heatmap of z-scores for features included in PERCI TAM (B) and PERCI AI (D). The coefficients on the right indicate the weight of each feature. ROC-AUC analysis of classifier performance for PERCI TAM (C) and PERCI AI (E) in the discovery cohort (n = 357, TAM n = 209, AI n = 148) and validation cohort 1 (n = 217, TAM n = 128, AI n = 89). The x-axis shows the specificity, while the y-axis shows the sensitivity. ROC-AUC with 95% CI are shown. (F and G) Performance of PERCI TAM (F) and PERCI AI (G), stratified by RS subgroups, in the discovery (left) and validation cohort 1 (right). R and NR groups per treatment were compared using (discovery cohort: paired) Wilcoxon test with FDR-adjusted P values: **P < 0.01, ***P < 0.001, ****P < 0.0001. Boxplots show median (line), upper, and lower quartiles (boxes), and lines extending to 1.5-IQR (whiskers).
Figure 6
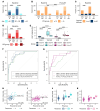
Figure 6. Descriptive statistics and performance of PERCI TAM 450k and PERCI AI 450k in validation cohort 2.
Clinico-pathological parameters with significant differences between response groups at baseline and/or post-pET in validation cohort 2 (n = 176, TAM n = 69, AI n = 107). (A) age; (B) PR status; (C) luminal subtype; (D) RS groups; and (E) Ki67 staining. Statistical tests as described in the legend of Figure 2. Statistical differences of numerical variables between baseline and post-pET comparisons were tested using paired Wilcoxon tests. All other comparisons of numerical variables were analyzed using nonpaired Wilcoxon tests. Statistical differences of categorical variables between baseline and post-pET comparisons were analyzed using McNemar test. All other comparisons of categorical variables were analyzed using Fisher’s exact test. For all statistical tests, asterisks ***P < 0.001, ****P < 0.0001. (F and G) Analysis of the performance of PERCI 450k TAM and RS, alone and in combination (F) and PERCI 450k AI and RS, alone and in combination (G) by ROC-AUC (PERCI 450k: black solid line; RS, black stippled line; combination of PERCI 450k and RS, green dashed line). The x-axis shows specificity and the y-axis shows sensitivity. ROC-AUC with 95% CI are given. (H and I) Scatter plot of Recurrence Score versus PERCI TAM 450k (H) and PERCI AI 450k (I). The vertical black lines indicate treatment-specific cutoffs for PERCI 450k to discriminate between responders and nonresponders. Spearman correlation coefficient ρ as indicated. (J and K) Performance of PERCI TAM 450k (J) and PERCI AI 450k (K) in validation cohort 2, stratified by RS groups. R and NR groups per treatment were compared using Wilcoxon test with FDR-adjusted P value: ***P < 0.001. Boxplots show median (line), upper, and lower quartiles (boxes), and lines extending to 1.5-IQR (whiskers).
Figure 7
Figure 7. PERCI 450k predicts progression-free survival (PFS) in the TCGA BRCA subcohort.
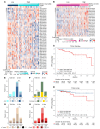
Heatmap of PERCI TAM 450k (A) and PERCI AI 450k (B) features in the TCGA BRCA subcohort (n = 269, TAM-like n = 75, AI-like n = 194). Kaplan-Meier curves of PFS in the TCGA BRCA subcohort on the basis of PERCI TAM 450k (C) and PERCI AI 450k scores (D). Cases were divided into high and low groups (blue: low, good prognosis, red: high, poor prognosis) by the cut-off value 0.423 for PERCI TAM 450k and 0.4011 for PERCI AI 450k. P values were calculated using the log-rank test. (EH) Comparative clinical pathology of PERCI 450k low and high groups in the TCGA BRCA subcohort by (E) age; (F) histology type; (G) pathological stage; and (H) tumor grade. Statistical differences of variables were analyzed using Fisher’s exact test *P < 0.05, **P < 0.01.
Figure 8
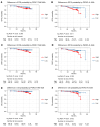
Figure 8. PERCI 450k predicts IDFS, DDFS and OS in the combined discovery and validation cohorts.
(A and B) Kaplan-Meier curves of invasive disease-free survival (IDFS), (C and D) distant disease-free survival (DDFS) and (E and F) overall survival (OS) on the basis of PERCI TAM 450k (A, C, and E) and PERCI AI 450k (B, D, and F). Cases were divided into high and low groups using the treatment-specific cutoffs indicated below the Kaplan-Meier curves (blue: low PERCI 450k, good prognosis, red: high PERCI 450k, poor prognosis). P values were calculated using the log-rank test. Cases with clinical follow-up: n = 666 (TAM n = 368, AI n = 298).

References

    1. Normanno N, et al. Mechanisms of endocrine resistance and novel therapeutic strategies in breast cancer. Endocr Relat Cancer. 2005;12(4):721–747. doi: 10.1677/erc.1.00857. - DOI - PubMed
    1. Toy W, et al. ESR1 ligand-binding domain mutations in hormone-resistant breast cancer. Nat Genet. 2013;45(12):1439–1445. doi: 10.1038/ng.2822. - DOI - PMC - PubMed
    1. Schiavon G, et al. Analysis of ESR1 mutation in circulating tumor DNA demonstrates evolution during therapy for metastatic breast cancer. Sci Transl Med. 2015;7(313):313ra182. doi: 10.1126/scitranslmed.aac7551. - DOI - PMC - PubMed
    1. Bartels S, et al. Estrogen receptor (ESR1) mutation in bone metastases from breast cancer. Mod Pathol. 2018;31(1):56–61. doi: 10.1038/modpathol.2017.95. - DOI - PubMed
    1. Fan M, et al. Diverse gene expression and DNA methylation profiles correlate with differential adaptation of breast cancer cells to the antiestrogens tamoxifen and fulvestrant. Cancer Res. 2006;66(24):11954–11966. doi: 10.1158/0008-5472.CAN-06-1666. - DOI - PubMed

Publication types

Associated data