. 2025 Jul 24;21(7):e1012988.
doi: 10.1371/journal.ppat.1012988. eCollection 2025 Jul.

Effect of obesity on the acute response to SARS-CoV-2 infection and development of post-acute sequelae of COVID-19 (PASC) in nonhuman primates

Affiliations

Effect of obesity on the acute response to SARS-CoV-2 infection and development of post-acute sequelae of COVID-19 (PASC) in nonhuman primates

Kristin A Sauter et al. PLoS Pathog. .

Abstract

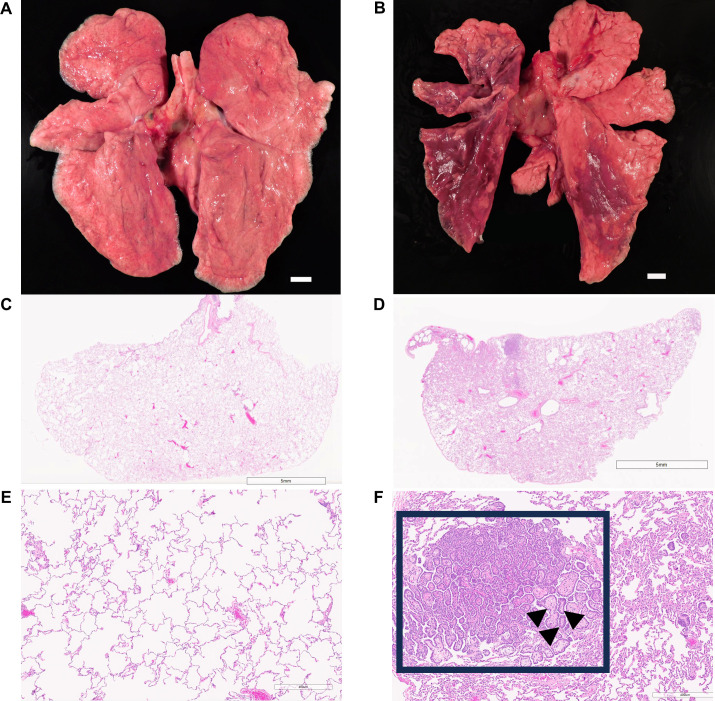
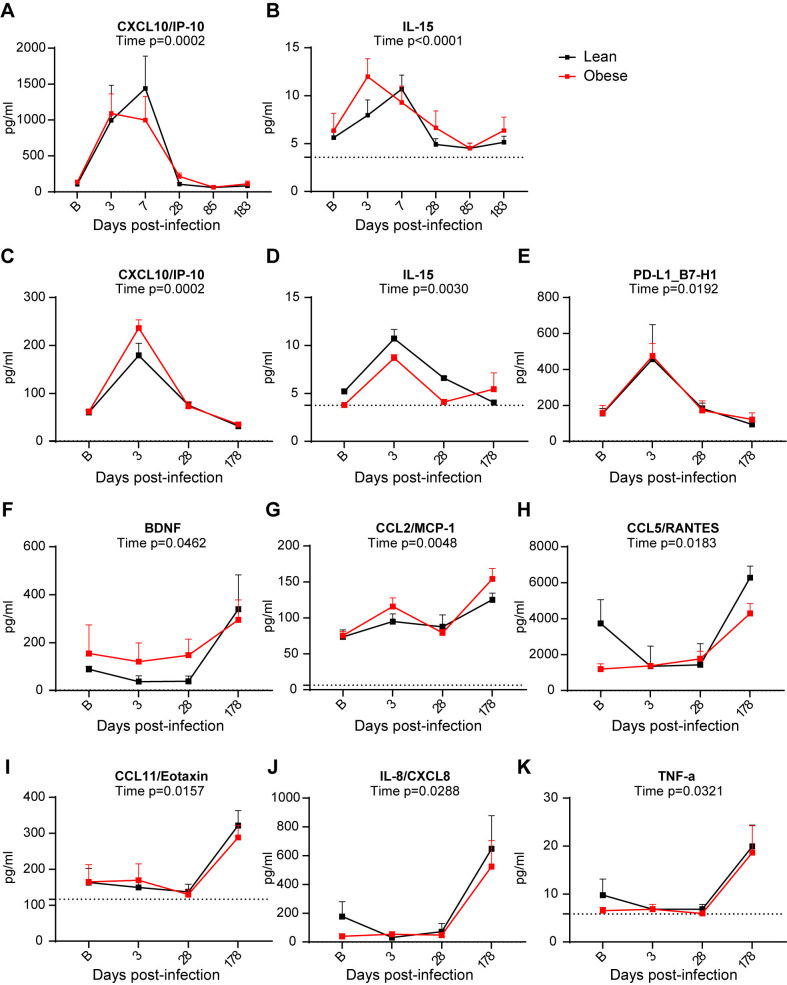
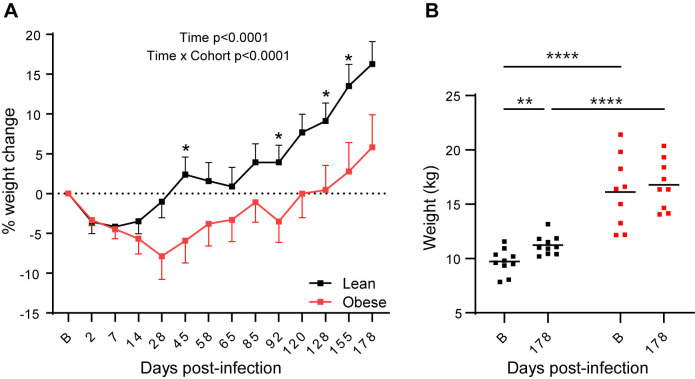
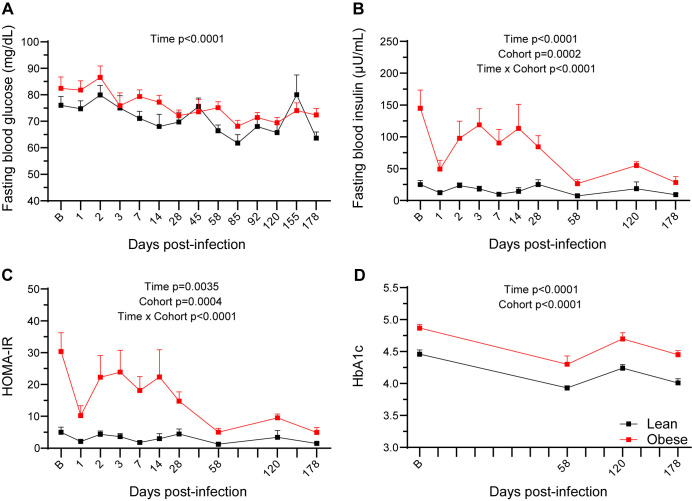
Long-term adverse consequences of SARS-CoV-2 infection, termed "long COVID" or post-acute sequelae of COVID (PASC), are a major component of overall COVID-19 disease burden. Prior obesity and metabolic disease increase the severity of acute disease, but SARS-CoV-2 infection also contributes to the development of new-onset metabolic disease. Since the COVID pandemic occurred in the context of the global obesity epidemic, an important question is the extent to which pre-existing obesity modifies long-term responses to SARS-CoV-2 infection. We utilized a nonhuman primate model to compare the effects of infection with the SARS-CoV-2 delta variant in lean and obese/insulin-resistant adult male rhesus macaques over a 6-month time course. While some longitudinal responses to SARS-CoV-2 infection, including overall viral dynamics, SARS-CoV-2-specific IgG induction, cytokine profiles, and tissue persistence of viral RNA, did not appreciably differ between lean and obese animals, other responses, including neutralizing Ab dynamics, lung pathology, body weight, degree of insulin sensitivity, adipocytokine profiles, body temperature, and nighttime activity levels were significantly different in lean versus obese animals. Furthermore, several parameters in lean animals were altered following SARS-CoV-2 infection to resemble those in obese animals. Notably, persistent changes in multiple parameters were present in most animals, suggesting that PASC may be more prevalent than estimated from self-reported symptoms in human studies.


Conflict of interest statement

I have read the journal's policy and the authors of this manuscript have the following competing interests: MKS has equity in Najit Technologies and serves as President and CSO. DNS has received research funding from Evrys Bio and Valneva USA. SEK is on the advisory boards for Amgen, Biomea Fusion, Eli Lilly, Merck, and Novo Nordisk, has equity in AltPep, has served as consultant for Neuroimmune and Oramed, and has received research funding from Corcept Therapeutics. JBS has equity in CytoDyn and has served as a consultant for Mabloc. PK has served as a consultant for Alnylam Pharmaceuticals, Courage Therapeutics, Crinetics Pharmaceuticals, and Junevity, and has received research funding from Novo Nordisk. CTR has equity in Diabetomics. All other authors have declared that no conflict of interest exists.

Figures

Fig 1
Fig 1. Study design and experimental timepoints.
Study timeline and schedule of various procedures and sample collection times are shown. Baseline (B in all figures) samples were taken immediately prior to infection on day 0 for viral dynamics in NAS and BAL samples and at day -26 for the data in Table 1 (including DEXA scans), serology, immune cell and cytokine profiling, and adipokine measurements. When procedures spanned more than 1 day, an average day PI is shown for simplicity. *One obese animal was excluded from the study after developing frank diabetes. Created in BioRender. Sauter, K. (2025) https://BioRender.com/5iuq9zg.
Fig 2
Fig 2. Viral dynamics in NAS samples.
(A-C) vRNA levels, peak vRNA levels, and vRNA AUC, respectively, in lean and obese groups. (D) Correlation between age and vRNA AUC determined by Pearson’s correlation coefficient. (E-G) Infectious virus (focus-forming units; FFU) levels, peak FFU levels, and FFU AUC, respectively, in lean and obese groups. Data in panels A and E are means ± SEM. LOD: Limit of detection.
Fig 3
Fig 3. Viral dynamics in BAL samples.
(A-C) vRNA levels, peak vRNA levels, and vRNA AUC, respectively, in lean and obese groups. (D) Correlation between baseline fat mass and vRNA AUC determined by Pearson’s correlation coefficient. (E-G) Infectious virus FFU levels, peak FFU levels, and FFU AUC, respectively, in lean and obese groups. Data in panels A and E are means ± SEM. LOD: Limit of detection.
Fig 4
Fig 4. vRNA levels in fecal samples.
N2 primer-specific (A) and NSP14 primer-specific (B) vRNA copies/mg in longitudinal stool samples in lean and obese groups. The N2 primer set targets SARS-CoV-2 genomic, antigenomic, and subgenomic vRNA sequences, while the NSF14 primer set targets only antigenomic and genomic vRNA sequences. Horizontal dotted lines represent the limit of quantitation (LOQ) based on 3 SDs above the mean of the values of pre-infection samples (B timepoint on X-axis).
Fig 5
Fig 5. Gross and microscopic pulmonary findings of representative animals with low and high pathology scores.
Necropsy photographs of the lung lobes and attached trachea of lungs with low (A) and high (B) lung pathology scores. H&E-stained micrographs at the subgross level (C,D) and at a higher magnification (E,F) of the left caudal lobe appear below each animal’s gross photograph. Lung lobes with low score were grossly and histologically unremarkable (A,C,E). All the left lung lobes and the right caudal lung lobe with high score exhibited discoloration and were mottled pink and dark red (B). Moderate bronchioloalveolar hyperplasia was present and characterized by clusters of proliferative epithelial cells surrounding a fibrovascular core (D,F). Box in panel F shows a region of hyperplasia and arrowheads indicate examples of proliferative epithelial cells surrounding a fibrovascular core. Bars in panels A and B are 1 cm.
Fig 6
Fig 6. Quantitation of lung pathology.
(A) Pathology scores in lean and obese animals differentiated by unpaired 2-tailed t test. Correlation of pathology scores with baseline fat mass (B), vRNA AUC in NAS (C) and BAL (D) determined by Pearson’s correlation coefficient.
Fig 7
Fig 7. BAL and plasma cytokine profiles.
Longitudinal changes in BAL CXCL10/IP-10 (A) and IL-15 (B) in BAL from lean and obese animals determined with a Luminex multiplex assay. Longitudinal changes in plasma CXCL10/IP-10 (C), IL-15 (D), PD-L1 (E), BNDF (F), CCL2/MCP-1 (G), CCL5/RANTES (H), CCL11/Eotaxin (I), IL-8/CXCL-8 (J), and TNF-α (K) analyzed using the same assay. All data are means ± SEM. Significance determined using mixed-effect analysis with Dunnett’s post-hoc for multiple comparisons test. Horizontal dotted lines in panels B, D, G, I, and K depict limit of quantitation (LOQ). In panels A, C, E, F, H, and J, the LOQ was too close to 0 to show.
Fig 8
Fig 8. Body weight changes after SARS-CoV-2 infection.
(A) Longitudinal changes in body weight in lean and obese animals. Significance determined using mixed-effect analysis with Dunnett’s post-hoc for multiple comparisons test. Data are mean ± SEM. (B) Body weight changes between baseline and 6 months PI. Significance determined by 2-way repeated-measures ANOVA with post-hoc pair-wise comparisons. *, p < 0.05; **, p < 0.01; ****, p < 0.0001.
Fig 9
Fig 9. Glucose homeostasis during SARS-CoV-2 infection.
FBG (A), FBI (B), HOMA-IR (C) levels, and HbA1c values (D) in lean and obese animals over the study time course. All data are means ± SEM. Significance determined using mixed-effect analysis with Dunnett’s post-hoc for multiple comparisons test.
Fig 10
Fig 10. Plasma adiponectin and leptin levels.
(A) Total plasma adiponectin levels in lean and obese groups determined by ELISA. (B) Plasma leptin levels in lean and obese groups determined by RIA. (C) Adiponectin/leptin ratio (ALR) in lean and obese groups. (D) ALR in lean and obese groups at baseline and d 180 PI. Data in panels A-C are means ± SEM. Significance determined using mixed-effect analysis with Dunnett’s post-hoc for multiple comparisons test. Significance in panel D determined by 2-way repeated measures ANOVA with post-hoc pair-wise comparisons. ****, p < 0.0001.
Fig 11
Fig 11. Nocturnal activity following SARS-CoV-2 infection in lean and obese animals.
(A) Nighttime activity (1-4 AM) in lean and obese animals from day -3 (baseline) to day 186 PI. (B) Average nighttime activity (1-4 AM) at baseline (day -3, B) and days 185-188 PI. Data in panel A are means ± SEM. External acceleration (EA) units reflect any movement greater than standard gravity detected by the data logger implant. Significance determined by 2-way repeated-measures ANOVA with post-hoc pair-wise comparisons. *, p < 0.05; **, p < 0.01; ***, p < 0.001.

Update of

Similar articles

References

    1. Nalbandian A, Sehgal K, Gupta A, Madhavan MV, McGroder C, Stevens JS, et al. Post-acute COVID-19 syndrome. Nat Med. 2021;27(4):601–15. doi: 10.1038/s41591-021-01283-z - DOI - PMC - PubMed
    1. Desai AD, Lavelle M, Boursiquot BC, Wan EY. Long-term complications of COVID-19. Am J Physiol Cell Physiol. 2022;322(1):C1–11. doi: 10.1152/ajpcell.00375.2021 - DOI - PMC - PubMed
    1. Thaweethai T, Jolley SE, Karlson EW, Levitan EB, Levy B, McComsey GA, et al. Development of a Definition of Postacute Sequelae of SARS-CoV-2 Infection. JAMA. 2023;329(22):1934–46. doi: 10.1001/jama.2023.8823 - DOI - PMC - PubMed
    1. Bowe B, Xie Y, Al-Aly Z. Acute and postacute sequelae associated with SARS-CoV-2 reinfection. Nat Med. 2022;28(11):2398–405. doi: 10.1038/s41591-022-02051-3 - DOI - PMC - PubMed
    1. Al-Aly Z, Davis H, McCorkell L, Soares L, Wulf-Hanson S, Iwasaki A, et al. Long COVID science, research and policy. Nat Med. 2024;30(8):2148–64. doi: 10.1038/s41591-024-03173-6 - DOI - PubMed