. 2025 Jul 24;23(7):e3003262.
doi: 10.1371/journal.pbio.3003262. eCollection 2025 Jul.

Phase separation of a PKA type I regulatory subunit regulates β-cell function through cAMP compartmentalization

Affiliations

Phase separation of a PKA type I regulatory subunit regulates β-cell function through cAMP compartmentalization

Ha Neul Lee et al. PLoS Biol. .

Abstract

Cyclic adenosine monophosphate (cAMP), a ubiquitous second messenger, regulates a variety of cellular functions with high specificity. We previously showed that the type I regulatory subunit of cAMP-dependent protein kinase A (PKA), RIα, undergoes liquid-liquid phase separation (LLPS) to facilitate spatial compartmentalization of cAMP. However, how RIα LLPS regulates cellular function is largely unknown. Here, we identify the formation of RIα condensates in MIN6 β cells and reveal key roles for RIα LLPS in regulating β cell function. By combining CRISPR-based RIα knockout with an RIα mutant (Y122A) that exhibits defective cAMP-induced LLPS, we demonstrate that RIα LLPS drives cAMP compartmentalization to tune β cell Ca2+ and cAMP oscillation frequency, control insulin secretion, regulate CREB-mediated gene expression and prevent uncontrolled proliferation. Our data establish the Y122A mutant as a selective molecular tool for studying RIα LLPS and expand our understanding of the functional impact of LLPS-driven protein assemblies.


Conflict of interest statement

The authors have declared that no competing interests exist.

Figures
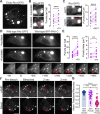
Fig 1
Fig 1. RIα undergoes LLPS in MIN6 β cells.
(A) Confocal microscopy showing phase-separated bodies of endogenously GFP2-tagged RIα. (B) Representative fluorescence images (left) and quantification of endogenous RIα puncta per cell (n = 16) (right) in RIα-GFP2 knock-in MIN6 β cells before and after treatment with forskolin (Fsk, 50 µM) and IBMX (100 µM). ****P < 0.0001, paired, two-tailed Student t test. Arrowheads: newly formed puncta (C) Representative fluorescence images (left) and quantification of endogenous RIα puncta per cell (n = 23) (right) in RIα-GFP2 knock-in MIN6 β cells before and after treatment with GLP-1 (1 µM). ****P < 0.0001, paired, two-tailed Student t test. Arrowheads: newly formed puncta. (D, E) Representative fluorescence images and time-course images of RIα-GFP2 after Fsk/IBMX stimulation (D) and quantification of RIα puncta number per cell (n = 22 cells) (E left) and area (for pre-existing puncta) per cell (n = 16) (E right) in MIN6 β cells co-expressing RIα-GFP2 and TagBFP2-PKA-Cα before (−) and after (+) Fsk (50 µM) and IBMX (100 µM) stimulation. ****P = 9.63 × 10−7; **P = 7.96 × 10−3; paired, two-tailed Student t test. Arrowheads indicate two puncta undergoing coalescence. (F) Representative fluorescence images of photobleaching and fluorescence recovery of basal and cAMP-stimulated RIα-GFP2 puncta in MIN6 β cells. (G) Quantification of the normalized recovery after photobleaching of stimulated bulk cytosol (n = 44 regions), stimulated puncta (n = 41 puncta), and basal large puncta (n = 48 puncta). ***P = 3.75 × 10−4, stimulated bulk cytosol versus stimulated puncta; ****P < 1 × 10−15, stimulated bulk cytosol versus basal large puncta; and ****P = 2.07 × 10−11, stimulated puncta versus basal large puncta; Brown-Forsythe and Welch one-way ANOVA with Dunnett’s T3 multiple comparisons test. Error bars indicate mean ± SEM. All scale bars: 10 µm. The data underlying this figure can be found in S1 Data.
Fig 2
Fig 2. Loss of RIα LLPS impairs cAMP compartmentalization.
(A) Raw cyan/yellow (C/Y) emission ratios measured in WT and RIα-null MIN6 β cells expressing either ICUE4 or ICUE4 (R279E), showing basal cAMP levels. n = 217 (WT) and 232 cells (KO) for ICUE4, and n = 108 (WT) and 103 cells (KO) for ICUE4 (R279E). **P = 8.47 × 10−3; ns, P = 0.29; unpaired, two-tailed Student t test. Error bars indicate mean ± SEM. (B) Time course of normalized C/Y emission ratios in WT and RIα KO MIN6 β cells expressing cAMPFIRE, showing cytosolic cAMP levels (left). Cells were stimulated with GLP-1 (1 µM) at t0. Area under curve (AUC) analysis from t0 to t5min, normalized to wild-type values (right). n = 12 (WT) and n = 10 (KO). *P = 0.0116, unpaired two-tailed Student t test. Data represent mean ± SEM. (C) Time course of the max-normalized emission ratio change (ΔRRmax) (left) and quantification of Fsk-stimulated response (right) in WT (n = 31 cells) and RIα KO (n = 46 cells) MIN6 β cells expressing PDE4D2cat-ICUE4 and sequentially stimulated with Fsk (50 µM), Roli (1 µM), IBMX (100 µM). Solid lines indicate the mean, and shaded areas indicate SEM. **P = 0.0065; unpaired, two-tailed Student t test. (D) Raw C/Y emission ratios measured in RIα-null MIN6 β cells expressing either RIαWT (WT) or RIαY122A (Y122A) plus either ICUE4 or ICUE4 (R279E). n = 113 (WT) and 96 cells (Y122A) for ICUE4, and n = 170 (WT) and 177 cells (Y122A) for ICUE4 (R279E). *P = 0.043; ns, P = 0.057; unpaired, two-tailed Student t test. Error bars indicate mean ± SEM. (E) Time course of normalized C/Y emission ratios of cAMPFIRE in RIα-null MIN6 β cells expressing either RIαWT (WT) or RIαY122A (Y122A). Cells were stimulated with GLP-1 (1 µM) at t0 (left). Area under curve (AUC) analysis from t0 to t5min, normalized to RIαWT (right). n = 16 (RIαWT) and n = 17 (RIαY122A). **P = 0.0079, unpaired two-tailed Student t test. Data represent mean ± SEM. (F) Time course of the max-normalized emission ratio change (ΔRRmax) (left) and quantification of Fsk-stimulated response (right) in RIα-null MIN6 β cells expressing either RIαWT (WT, n = 24 cells) or RIαY122A (Y122A, n = 30 cells) plus PDE4D2cat-ICUE4 and stimulated as in (B). Solid lines indicate the mean, and shaded areas SEM. ****P = 5.17 × 10⁻⁶; unpaired, two-tailed Student t test. The data underlying this figure can be found in S1 Data.
Fig 3
Fig 3. RIα LLPS regulates MIN6 β cell function.
(A) Heatmap (left) showing Ca2+ oscillations in individual RIα-null MIN6 β cells (each row) expressing either RIαWT (WT, upper) or RIαY122A (Y122A, lower), plotted as normalized RCaMP intensity. Cells were ordered by the period of the first two Ca2+ peaks after TEA stimulation. Representative single-cell traces of Ca2+ oscillation (top right) and quantification of oscillation period (bottom right) in WT (n = 34 cells) or Y122A (n = 37 cells). **P = 9.2 × 10−3; unpaired, two-tailed Student t test. Data represent mean ± SEM. (B) Heatmap (left) depicting temporal dynamics of cAMP oscillations in individual RIα-null MIN6 β cells (each row) expressing either RIαWT (WT, upper) or RIαY122A (Y122A, lower), shown as normalized cAMPFIRE C/Y emission ratios. Cell ordering reflects the period between the initial two cAMP peaks following TEA stimulation. Representative cAMP oscillation traces (top right) and period quantification (bottom right) in WT (n = 33 cells) or Y122A (n = 27 cells). ***P = 0.0006; unpaired, two-tailed Student t test. Data represent mean ± SEM. (C) Relative insulin secretion level between RIα-null MIN6-6 cells expressing RIαWT (WT) or RIαY122A (Y122A) upon glucose (25 mM)/ GLP-1(1 µM) stimulation. n = 3 for both, **P = 0.0016; unpaired, two-tailed Student t test. Error bars indicate mean ± SEM. (D) Western blot of CREB and phospho-CREB (p-CREB) (top) and quantification of p-CREB/CREB (bottom) in RIα-null MIN6 β cells expressing RIαWT (WT) or RIαY122A (Y122A). *P = 0.011; unpaired, two-tailed Student t test (n = 5 experiments). (E) Quantification of Cyr61 and JunB mRNA levels in RIα-null MIN6 β cells expressing RIαWT (WT) or RIαY122A (Y122A). *P = 0.036; **P = 0.0015; unpaired, two-tailed Student t test. (F) Quantification of cell proliferation in RIα-null MIN6 β cells expressing RIαWT (WT) or RIαY122A (Y122A) (n = 4 experiments). ****P = 6.98 × 10−5; Multiple paired t test. Error bars indicate mean ± SEM. The data underlying this figure can be found in S1 Data and S1 Raw Images.

References

    1. Sassone-Corsi P. The cyclic AMP pathway. Cold Spring Harb Perspect Biol. 2012;4(12):a011148. doi: 10.1101/cshperspect.a011148 - DOI - PMC - PubMed
    1. Yan K, Gao L-N, Cui Y-L, Zhang Y, Zhou X. The cyclic AMP signaling pathway: exploring targets for successful drug discovery (Review). Mol Med Rep. 2016;13(5):3715–23. doi: 10.3892/mmr.2016.5005 - DOI - PMC - PubMed
    1. Drucker DJ. Glucagon-like peptide-1 and the islet beta-cell: augmentation of cell proliferation and inhibition of apoptosis. Endocrinology. 2003;144(12):5145–8. doi: 10.1210/en.2003-1147 - DOI - PubMed
    1. Tengholm A. Cyclic AMP dynamics in the pancreatic β-cell. Ups J Med Sci. 2012;117:355–69. - PMC - PubMed
    1. Ni Q, Ganesan A, Aye-Han N-N, Gao X, Allen MD, Levchenko A, et al. Signaling diversity of PKA achieved via a Ca2+-cAMP-PKA oscillatory circuit. Nat Chem Biol. 2011;7(1):34–40. doi: 10.1038/nchembio.478 - DOI - PMC - PubMed

MeSH terms

Substances

LinkOut - more resources