. 2025 Jul 24;389(6758):375-379.
doi: 10.1126/science.adv3813. Epub 2025 Jul 24.

De novo design and structure of a peptide-centric TCR mimic binding module

Affiliations

De novo design and structure of a peptide-centric TCR mimic binding module

Karsten D Householder et al. Science. .

Abstract

T cell receptor (TCR) mimics offer a promising platform for tumor-specific targeting of peptide-major histocompatibility complex (pMHC) in cancer immunotherapy. In this study, we designed a de novo α-helical TCR mimic (TCRm) specific for the NY-ESO-1 peptide presented by human leukocyte antigen (HLA)-A*02, achieving high on-target specificity with nanomolar affinity (dissociation constant Kd = 9.5 nM). The structure of the TCRm-pMHC complex at 2.05-Å resolution revealed a rigid TCR-like docking mode with an unusual degree of focus on the up-facing NY-ESO-1 side chains, suggesting the potential for reduced off-target reactivity. Indeed, a structure-informed in silico screen of 14,363 HLA-A*02 peptides correctly predicted two off-target peptides, yet our TCRm maintained peptide selectivity and cytotoxicity as a T cell engager. These results represent a path for precision targeting of tumor antigens with peptide-focused α-helical TCR mimics.


Conflict of interest statement

Competing interests:

K.C.G. is a co-founder of 3T Biosciences and consults for Xaira Therapeutics. All other authors declare no competing interests.

Figures
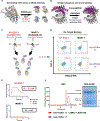
Fig. 1.
Fig. 1.. Design and experimental validation of de novo mini-TCR mimics.
(A) Schematic of RFdiffusion fold-conditioning pipeline generating four hit scaffolds with the NY-ESO-1 HLA-A*02 input (red and gray) out of 100 distinct folds sampled. (B) Schematic of pipeline using ProteinMPNN to design 500 sequences for Scaffold #1 (purple) and predict likely binders with AlphaFold2. (C) Yeast display screening of top de novo designs with NY-ESO-1 (red) vs. MART-1 HLA-A*02 (black) tetramers. (D) Two of five evaluated binders staining NY-ESO-1 but not MART-1 HLA-A*02 tetramer by flow cytometry (see fig. S4A for gating strategy) (two independent experiments). (E) SPR analysis of mini-TCRm 1.1 analyte with immobilized NY-ESO-1 HLA-A*02 (red) vs. MART-1 HLA-A*02 (black). Dissociation constants indicated on sensograms (Kd); n.d., not determined. (F) SEC profiles of mini-TCRm 1.1 (purple) vs. co-eluting complex (red) of mini-TCRm 1.1 with NY-ESO-1 HLA-A*02 and AD01 nanobody. SDS-PAGE gel showing four fractions of co-eluting complex pooled for crystal screens. kDa, kilodaltons.
Fig. 2.
Fig. 2.. High-resolution crystal structure reveals peptide-specific interactions.
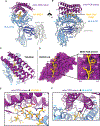
(A) Front view of mini-TCRm/pMHC complex (PDB ID 9MIN). A1-A4 alpha-helices of mini-TCRm (purple); α1 and α2 helices of HLA-A*02 and full chain (light blue); NY-ESO-1 peptide (gold); β2M (dark blue); AD01 nanobody (white). (B) Side view of complex with Met4-Trp5 bulge on the NY-ESO-1 peptide. (C) Top-down view of complex. (D) Bottom-up view of peptide-specific interactions with surface of mini-TCRm (purple). Box zooming in on NY-ESO-1’s Met4-Trp5 motif (gold) fitting into mini-TCRm pockets formed between the A2 and A3 helices (key residue labels in white). (E) Hydrogen bonds (dashed lines) and key peptide-centric residues between mini-TCRm and NY-ESO-1 peptide. (F) Hydrogen bonds and salt bridges (dashed lines) between mini-TCRm and HLA-A*02.
Fig. 3.
Fig. 3.. Comparison to existing antibody TCR mimic and TCR.
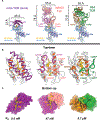
(A) Front view comparison between mini-TCRm (purple), 3M4E5 Fab (magenta and salmon), and 1G4 TCR (brown and green) bound to NY-ESO-1 peptide (gold) and HLA-A*02 (light blue). Height and width of binders shown in Angstroms (Å). (B) Top-down comparison of docking footprints of each binder with MHC contact residues (red orange) and NY-ESO-1 peptide side chains (gold). (C) Bottom-up comparison of interactions between the NY-ESO-1 peptide (gold) and binding pockets, with the Met4-Trp5 motif labeled. Dissociation constants (Kd) for each complex is shown at the bottom. nanomolar, nM; micromolar, μM.
Fig. 4.
Fig. 4.. Mini-TCR mimic therapeutics exhibit peptide selectivity and cytotoxicity for NY-ESO-1 HLA-A*02.
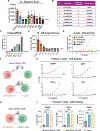
(A) Flow cytometry analysis of mini-TCRm staining T2 cells pulsed with NY-ESO-1 peptide variants (see data S2 for sequences; see fig. S4B for gating strategy). MART-1 and no peptide were used as negative controls. Data points represent the geometric MFI averaged across technical replicates per experiment (bars are mean ± SD, n=3, N=3). Statistical significance calculated relative to NY-ESO-1 (*P < 0.05, **P < 0.01, ns = not significant, unpaired Student’s t-tests). (B) Table of candidate off-targets identified from the MHC Motif Atlas. (C) Ranking of candidate off-targets based on ProteinMPNN and the crystal structure (see data S2 for scores). (D) Flow cytometry of mini-TCRm staining T2 cells pulsed with off-target candidates (see fig. S4B for gating strategy). Data points show the geometric MFI from technical replicates (mean ± SD, n=3, N=2). Statistical significance calculated relative to NY-ESO-1 (*P < 0.05, **P < 0.01, unpaired Student’s t-tests). (E) Jurkat CD69+ NFAT-eGFP+ reporter activation following co-culture with T2 pulsed with peptides and treated with mini-TCRm T cell engagers (see fig. S4C for gating strategy). Dose shown in log(nM) (dots are mean ± SD, n=3, N=2). (F) Schematic of a soluble mini-TCRm T cell engager (TCE; purple) activating T cells against an NY-ESO-1+ cell (salmon). (G) Cytotoxicity dose-response of mini-TCRm TCE in primary T cell co-cultures with NY-ESO-1-pulsed T2 cells (see fig. S4D for gating strategy). Data represent the percentage of cells positive for the cytotoxicity marker relative to negative controls (dots are mean ± SD, n=3, an independent experiment with lower peptide dosage yielded similar results though not counted as N=2). (H) Schematic of a mini-TCRm CAR-T cell (CAR; purple) targeting an NY-ESO-1+ cell (salmon). (I) Cytotoxic marker expression in mini-TCRm CAR-T cells co-cultured with NY-ESO-1+ A375 cells for 48 hours (see fig. S4E for gating strategy). Mock T cells were activated, untransduced controls. Data represent geometric MFI in CAR+ population (bars are mean ± SD, n=4, N=2). Statistical significance calculated for all pairs (****P < 0.0001, ns = not significant, one-way ANOVA followed by Tukey’s post-hoc test).

Update of

References

    1. Xie N, Shen G, Gao W, Huang Z, Huang C, Fu L, Neoantigens: promising targets for cancer therapy. Sig Transduct Target Ther 8, 9 (2023). - PMC - PubMed
    1. Klebanoff CA, Chandran SS, Baker BM, Quezada SA, Ribas A, T cell receptor therapeutics: immunological targeting of the intracellular cancer proteome. Nat Rev Drug Discov 22, 996–1017 (2023). - PMC - PubMed
    1. Rossjohn J, Gras S, Miles JJ, Turner SJ, Godfrey DI, McCluskey J, T Cell Antigen Receptor Recognition of Antigen-Presenting Molecules. Annu. Rev. Immunol 33, 169–200 (2015). - PubMed
    1. Cresswell P, Ackerman AL, Giodini A, Peaper DR, Wearsch PA, Mechanisms of MHC class I‐restricted antigen processing and cross‐presentation. Immunological Reviews 207, 145–157 (2005). - PubMed
    1. Garcia KC, Adams EJ, How the T Cell Receptor Sees Antigen—A Structural View. Cell 122, 333–336 (2005). - PubMed

MeSH terms