

Longitudinal Changes in Brain Diffusion Characteristics Associated With Cognition and Vascular Risk Factors: The ARIC-NCS Study
- PMID: 40705997
- PMCID: PMC12296637
- DOI: 10.1212/WNL.0000000000213867
Longitudinal Changes in Brain Diffusion Characteristics Associated With Cognition and Vascular Risk Factors: The ARIC-NCS Study
Abstract
Background and objectives: It remains unclear whether longitudinal changes in brain microstructural integrity, measured by diffusion MRI, relate to cognition and vascular risks. We investigated whether annualized changes in fractional anisotropy (FA) and mean diffusivity (MD) are associated with changes in cognitive domains among nondemented older adults, and how these patterns differ by vascular risk factors.
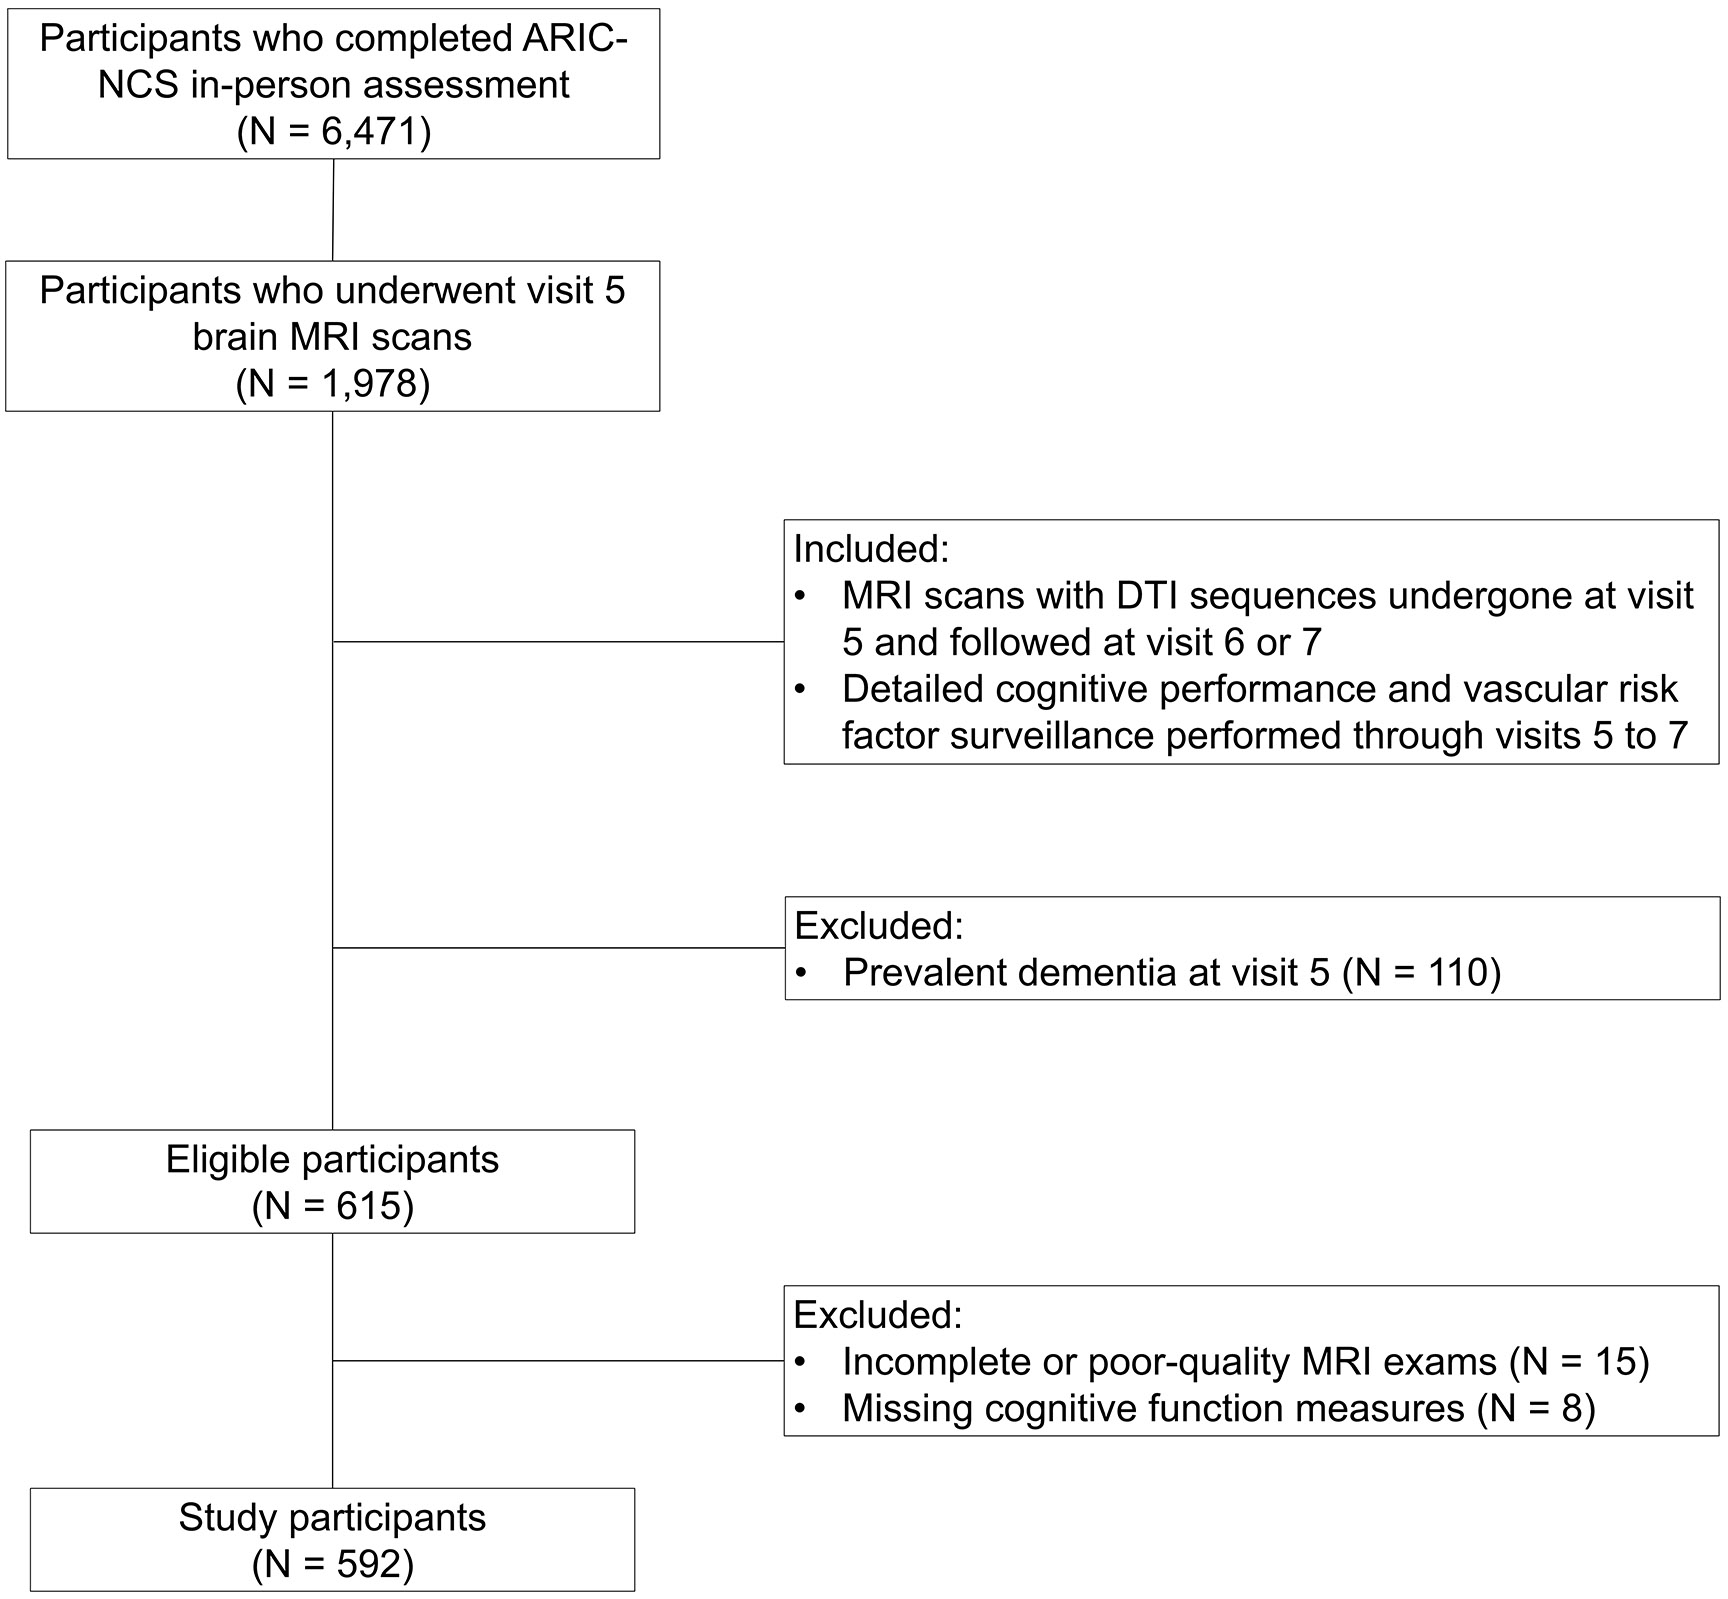
Methods: Data were longitudinally collected from the Atherosclerosis Risk in Communities Neurocognitive Study, conducted across 4 US sites with 6,471 participants attending the baseline assessment. Individuals who underwent diffusion MRI and neurocognitive evaluations at least twice between 2011 and 2019 were included; those with baseline dementia were excluded. Linear mixed-effects models assessed associations between FA and MD values in 140 brain regions and domain-specific cognitive scores (executive function, language, and memory). Annualized changes in FA and MD values were compared between individuals with and without vascular risk factors.
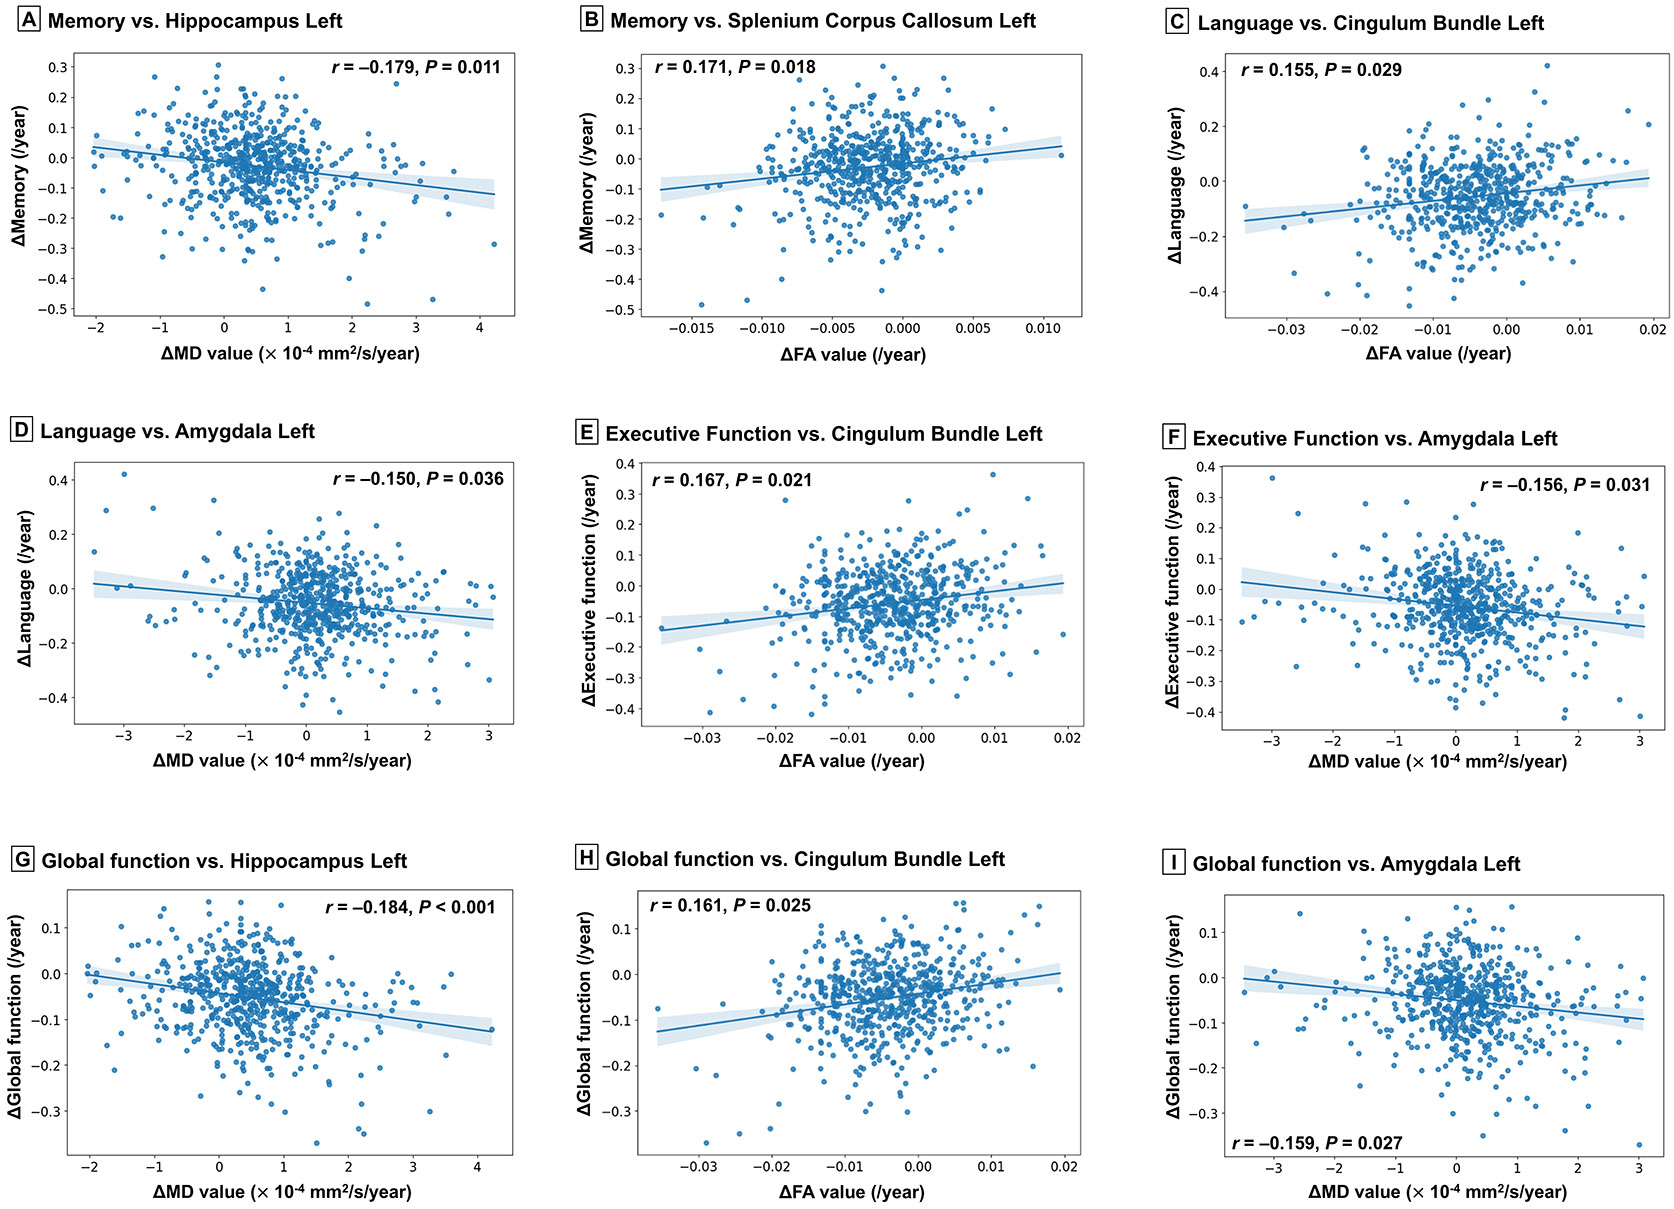
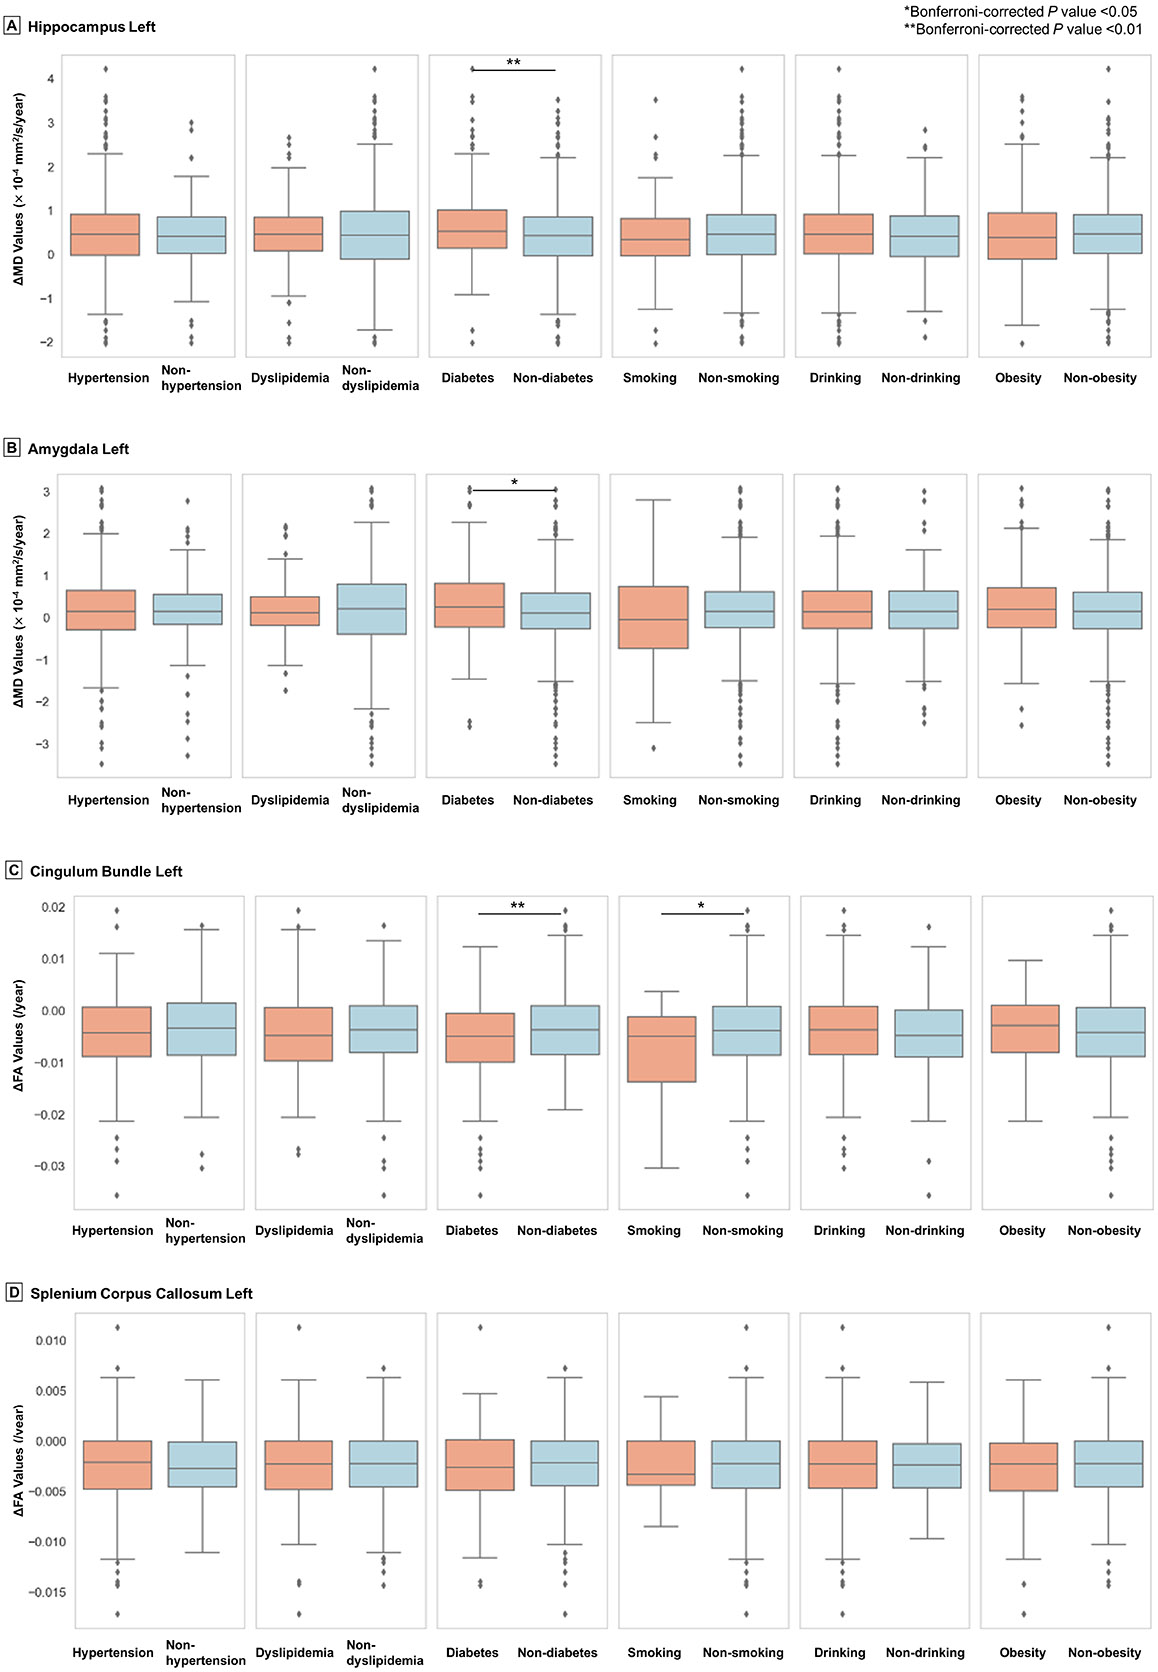
Results: 592 participants (mean age: 75.8 ± 4.6 years; 56% women) were followed for 6 years on average. A 1-SD decrease in FA values in the left cingulum bundle was associated with a 0.166-SD reduction in executive function (95% CI 0.065-0.267; p = 0.025) and a 0.158-SD reduction in language (95% CI 0.054-0.263; p = 0.031). In addition, a 1-SD increase in MD values in the left hippocampus was associated with a 0.191-SD reduction in memory (95% CI -0.306 to -0.076; p = 0.009). Significant differences in annualized changes in these FA and MD values were found depending on the presence or absence of type 2 diabetes and smoking.
Discussion: Deterioration in microstructural integrity-reflected by lower FA in the left cingulum bundle and higher MD in the left hippocampus-was associated with declines in executive function, language, and memory. Furthermore, longitudinal changes in these FA and MD values had differences based on the presence of type 2 diabetes and smoking. These findings provide a foundational basis for future research to determine whether managing vascular risk factors can delay cognitive decline by affecting the microstructural integrity of the brain.
Conflict of interest statement
Potential Conflicts of Interest
KOi is a consultant for Corporate-M and AnatomyWorks. This arrangements is being managed by the Johns Hopkins University in accordance with its conflict-of-interest policies. YU, KOn, KN, AKN, BGW, and BAW declare no competing interests.
Figures
References
-
- Deary IJ, Corley J, Gow AJ, et al. Age-associated cognitive decline. British Medical Bulletin 2009;92:135–152. - PubMed
MeSH terms
Grants and funding
LinkOut - more resources
Full Text Sources
Medical