. 2025 Jul 18:85:103779.
doi: 10.1016/j.redox.2025.103779. Online ahead of print.

Ether lipids and sphingolipids drive sex-specific human aging dynamics

Affiliations

Ether lipids and sphingolipids drive sex-specific human aging dynamics

Joaquim Sol et al. Redox Biol. .

Abstract

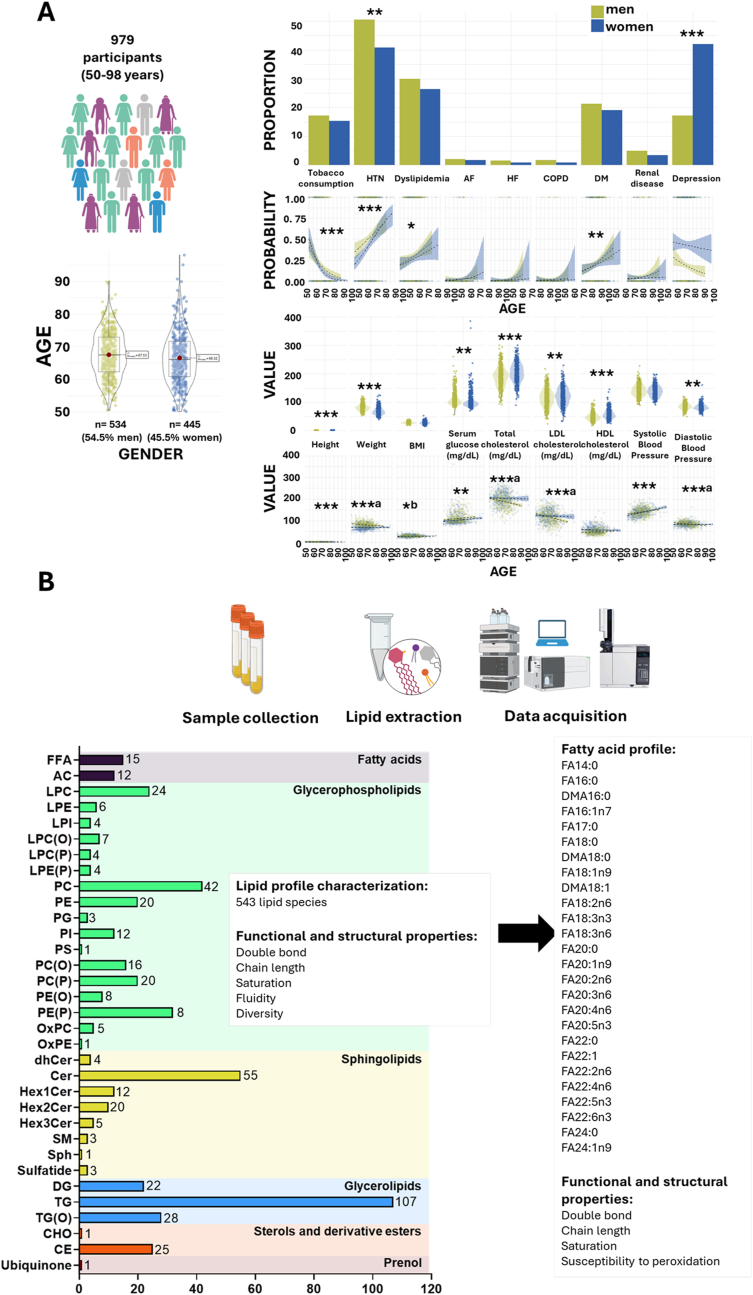
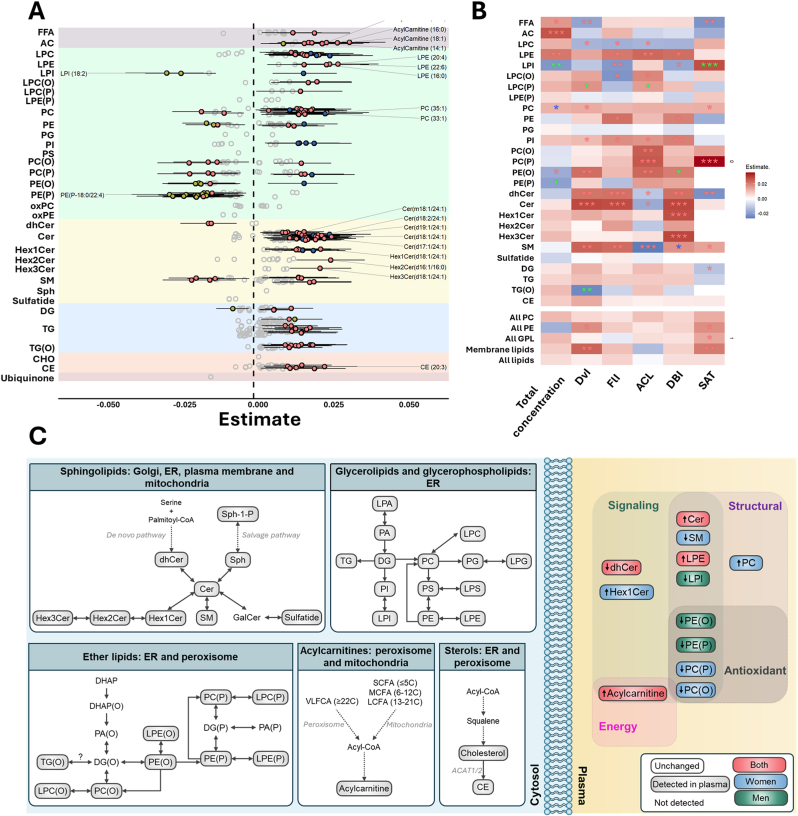
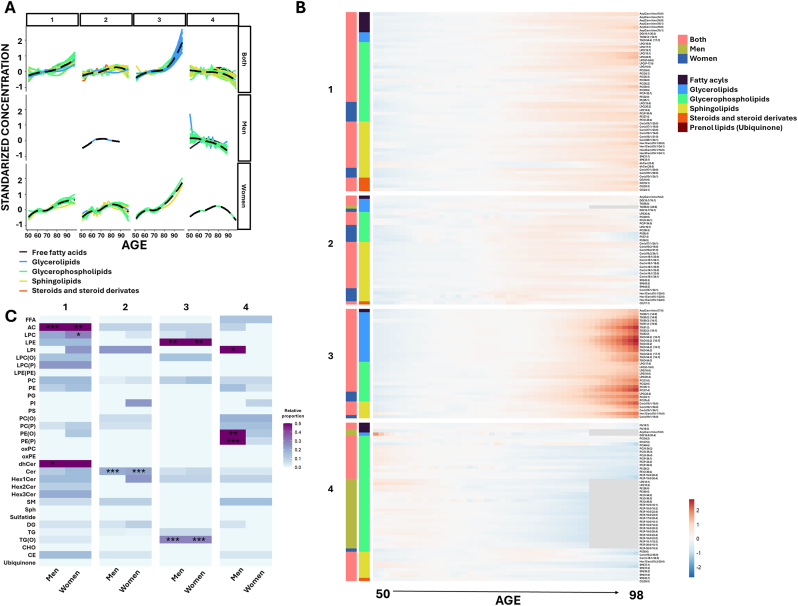
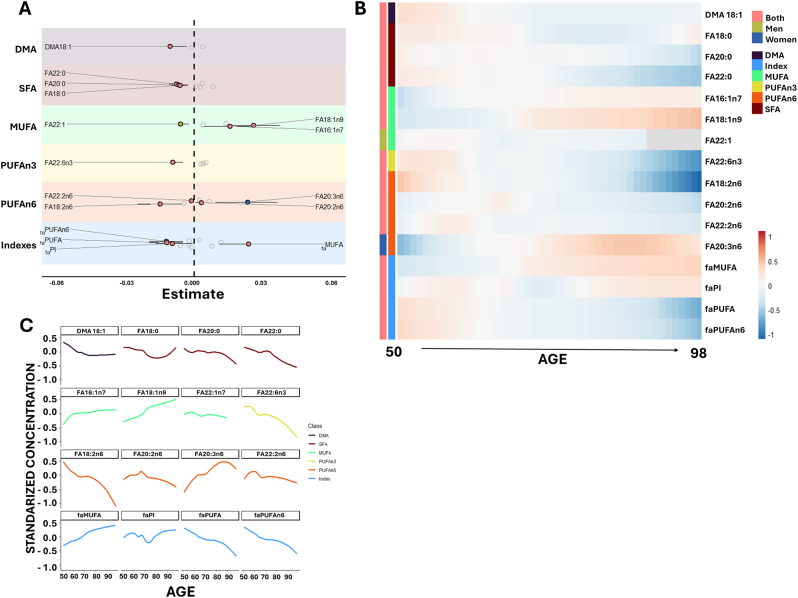
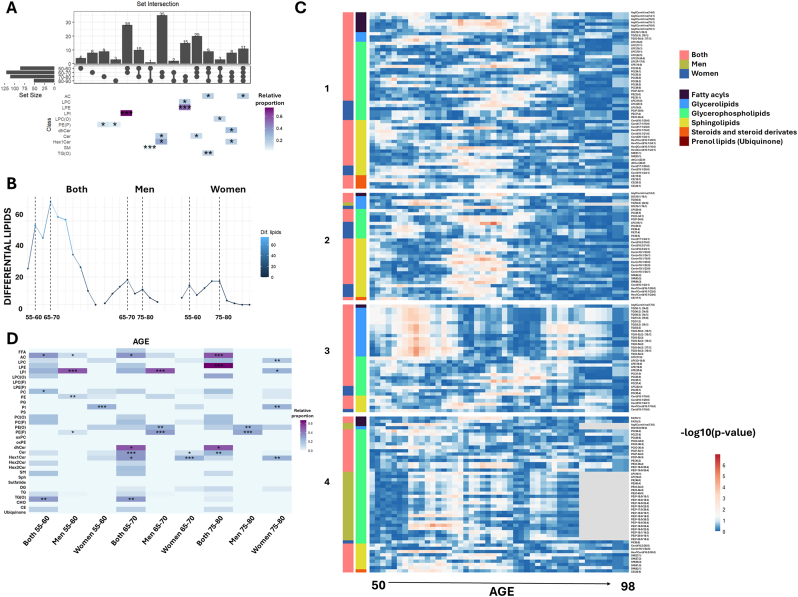
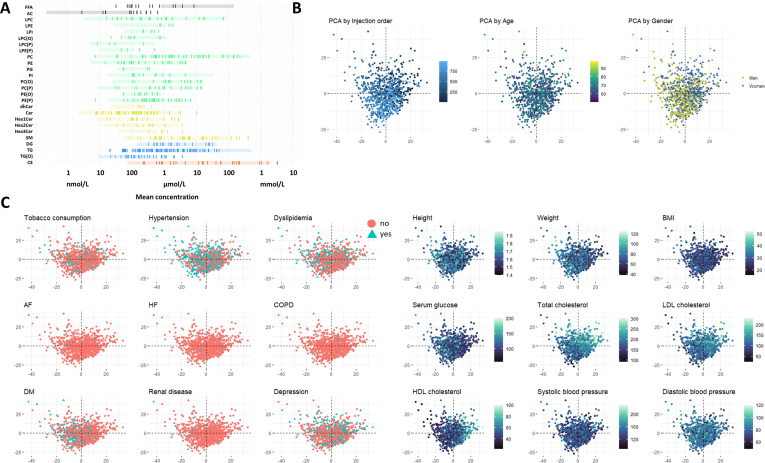
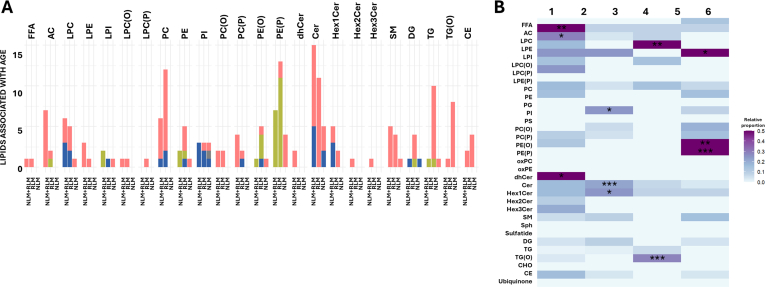
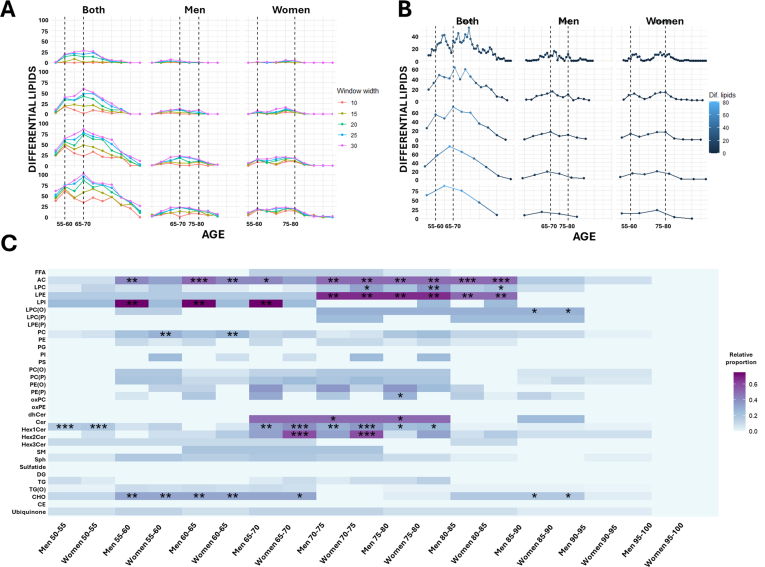
Aging is a dynamic process characterized by complex molecular changes, including shifts in lipid metabolism. To systematically define lipidome dynamics with age and identify sex-specific lipidomic signatures, we performed targeted lipidomic profiling of plasma samples from 1030 adults aged 50-98 years, analyzing 543 lipid species across all lipid classes using high-throughput mass spectrometry and assessing the circulating fatty acid composition by gas chromatography. Our results reveal age-related lipidomic shifts, with ceramides and ether-linked phospholipids most affected. We identified three aging crests (55-60, 65-70, 75-80 years), with the 65-70 years crest dominant in men and the 75-80 years crest in women. Lipid enrichment analyses highlight acylcarnitines, sphingolipids and ether-linked phospholipids as key contributors, with functional indices indicating compositional shifts in lipid species. These findings suggest an impairment of lipid functional categories, including loss of dynamic properties, alterations in bioenergetics, antioxidant defense, cellular identity, and signaling platforms. This study underscores the non-linear nature of lipid metabolism in aging and provides a foundation for identifying biomarkers and interventions to promote healthy aging.

Keywords: Aging crests; Aging dynamics; Ether-linked phospholipids; Lipid metabolism; Metabolic adaptation; Sex-specific lipidomics; Sphingolipids.


Conflict of interest statement

Declaration of competing interest The authors declare that they have no known competing financial interests or personal relationships that could have appeared to influence the work reported in this paper.

Figures

Fig. 1
Fig. 1
Study population characteristics and plasma lipidomics workflow. A. Demographic and clinical characteristics of the study population. The figure presents the demographic composition, clinical pathologies, and biochemical parameters of the study population (n = 979), consisting of individuals aged between 50 and 98 years. The cohort includes 54.5 % males and 45.5 % females. Pathological conditions and biochemical markers are shown, stratified by sex, to illustrate differences and distributions across the population. ∗p < 0.05, ∗∗p < 0.01, ∗∗∗p < 0.0001, a significant only in men, b significant only in women. AF: atrial fibrillation, COPD: Chronic Obstructive Pulmonary Disease, DM: diabetes mellitus, HTN: hypertension, HF: heart failure. B. Overview of the lipidomics workflow for plasma analysis. The figure outlines the lipidomics workflow, starting with plasma sample collection, followed by lipid extraction, and data acquisition using liquid chromatography coupled to a triple quadrupole mass spectrometer (LC-QQQ-MS). A total of 543 lipid species, spanning all major lipid families, and 26 fatty acids were detected. From these lipids, functional and structural properties of the plasma lipidome were calculated, including double bond content, saturation level, chain length, susceptibility to peroxidation, lipid fluidity, and lipid diversity.
Fig. 2
Fig. 2
Plasma lipid species linearly associated with age, grouped by class. A. The forest plot illustrates the significant associations (FDR p-value <0.05) between the relative abundance of each lipid metabolite (z-scored) and age, using robust linear regression models. Models were adjusted for weight, height, body mass index, systolic and diastolic blood pressure, history of depression, hypertension, dyslipidemia, cardiac insufficiency, renal disease, atrial fibrillation, COPD, tobacco consumption, as well as serum glucose, total cholesterol, and HDL and LDL cholesterol. Dots represent the robust linear regression estimates for age, with whiskers indicating bootstrapped 95 % confidence intervals. Positive associations are shown in red for both sexes, blue for females, and green for males. Lipid classes are color-coded as follows: fatty acyls (gray), glycerophospholipids (green), sphingolipids (yellow), glycerolipids (blue), steroids and derivatives (orange), and ubiquinone (maroon). Top 20 lipids with lowest p-value are displayed. B. Heatmap representation of the robust linear regression estimates of the functional and structural properties of the lipidome, including significant lipid classes that show association with age for both sexes or separately for males and females. Properties include metrics such as total content, double bond content, chain length, saturation, lipid diversity, and lipid fluidity. A red asterisk indicates significance for both sexes, blue for females only, and green for males only (∗p < 0.05, ∗∗p < 0.01, ∗∗∗p < 0.001). C. Schematic representation of the main affected lipid pathways. On the left (cytosol), lipid metabolic pathways are depicted, highlighting cellular compartments where the metabolic processing of detected lipids occurs. Pathways include additional lipid species that are part of these pathways but were not detected in the present study. On the right (plasma), only lipids identified as significant in the enrichment analyses are displayed, stratified for both sexes, as well as separately for males and females. Positive associations are shown in red for both sexes, blue for females, and green for males. FFA: free fatty acids; SCFA: short chain fatty acids; MCFA: medium chain fatty acids; LCFA: long chain fatty acids VLCFA: very-long chain fatty acids; LPC: lysophosphatidylcholine; LPE: lysophosphatidylethanolamine; LPI: lysophosphatidylinositol; LPC(O): alkyl-lysophosphatidylcholine; LPC(P): alkenyl (plasmalogen)- lysophosphatidylcholine; LPE(P): alkenyl (plasmalogen)- lysophosphatidylethanolamine; PC: phosphatidylcholine; PE: phosphatidylethanolamine; PG: phosphatidylglycerol; PI: phosphatidylinositol; PS: phosphatidylserine; PC(O): alkyl-phosphatidylcholine; PC(P) alkenyl (plasmalogen)- phosphatidylcholine; PE(O): alkyl-phosphatidylethanolamine; PE(P): alkenyl (plasmalogen)- phosphatidylethanolamine; oxPC: oxidized phosphatidiylcholine; oxPE: oxidized phosphatidylethanolamine; dhCer: dihydroceramide; Cer: ceramide; Hex1Cer: hexosyl1ceramide; Hex2Cer: hexosyl2ceramide; Hex3Cer: hexosyl3ceramide; SM: sphingomyelin; Sph: sphingosine; DG: diacylglycerol; TG: triglyceride; TG(O): ether-linked triglyceride; CHO: cholesterol; CE: cholesteryl ester; LPA: Lysophosphatidic Acid; PA: Phosphatidic Acid; PG: Phosphatidylglycerol; LPG: lysophosphatidylglycerol; LPS: lysophosphatidylserine; Sph-1-P: sphingosine-1-phosphate; GalCer: galactosylceramide; AC: acylcarnitine; DHAP: dihydroxyacetone phosphate; DG(O): ether-linked diacylglycerol. All PC: sum of the concentration of all phosphatidylcholines; All PE: sum of the concentration of all phosphatidylethanolamine; All GPL: sum of the concentration of all glycerophospholipids; Membrane lipids: sum of the concentration of all glycerophospholipids and sphingolipids; ACL: average chain length; DBI: double bond index; FlI: fluidity index. DvI: diversity index. FlI is calculated according to chain length and double bonds of their fatty acids. DvI represents the probability that two lipids randomly selected from a sample will belong to different species. Higher diversity values indicate higher diversity of lipids within the specified lipid class.
Fig. 3
Fig. 3
Clustering analysis and age-associated lipid patterns. A. Clustering analysis of lipids associated with age across the study population, separated into six distinct clusters. The analysis considers lipid associations common in both sexes, and those specific for males and females. Solid lines represent the optimized LOESS smoothed function for each lipid and are colored according to lipid class. Dashed lines represent the overall cluster trend. B. Heatmap representation of lipid abundance by age, displaying the lipids within each cluster. Lipids are ordered according to their lipid class. The associations are indicated by color-coded bars: red for both sexes, green for males, and blue for females. C. Heatmap representing the proportion of lipids from each lipid category within each cluster, showing significant results from the enrichment analysis (∗p < 0.05, ∗∗p < 0.01, ∗∗∗p < 0.001). Results are stratified by sex, highlighting enriched lipid classes separately for males and females. Lipid classes are color-coded as follows: fatty acyls (gray), glycerophospholipids (green), sphingolipids (yellow), glycerolipids (blue), steroids and derivatives (orange), and ubiquinone (maroon). FFA: free fatty acids; AC: acylcarnitine; LPC: lysophosphatidylcholine; LPE: lysophosphatidylethanolamine; LPI: lysophosphatidylinositol; LPC(O): alkyl-lysophosphatidylcholine; LPC(P): alkenyl (plasmalogen)- lysophosphatidylcholine; PC: phosphatidylcholine; PE: phosphatidylethanolamine; PG: phosphatidylglycerol; PI: phosphatidylinositol; PS: phosphatidylserine; PC(O): alkyl-phosphatidylcholine; PC(P) alkenyl (plasmalogen)- phosphatidylcholine; PE(O): alkyl-phosphatidylethanolamine; PE(P): alkenyl (plasmalogen)- phosphatidylethanolamine; oxPC: oxidized phosphatidylcholine; oxPE: oxidized phosphatidylethanolamine; dhCer: dihydroceramide; Cer: ceramide; Hex1Cer: hexosyl1ceramide; Hex2Cer: hexosyl2ceramide; Hex3Cer: hexosyl3ceramide; SM: sphingomyelin; Sph: sphingosine; DG: diacylglycerol; TG: triglyceride; TG(O): ether-linked triglyceride; CHO: cholesterol; CE: cholesteryl ester.
Fig. 4
Fig. 4
Age-Associated Changes in Circulating Fatty Acid Profile A. Forest plot illustrating the significant associations (FDR p-value <0.05) between the relative abundance of each fatty acid and related indexes (z-scored) and age, using robust linear regression models. Models were adjusted for weight, height, body mass index, systolic and diastolic blood pressure, history of depression, hypertension, dyslipidemia, cardiac insufficiency, renal disease, atrial fibrillation, COPD, tobacco consumption, as well as serum glucose, total cholesterol, and HDL and LDL cholesterol. Dots represent the regression estimates for age, with whiskers indicating bootstrapped 95 % confidence intervals. Positive associations are color-coded: red for both sexes, blue for females, and green for males. Only statistically significant fatty acids and indexes are displayed. B. Heatmap representing fatty acid abundance and related indexes across age, displaying lipids within each cluster. Associations are indicated by color-coded bars: red for both sexes, green for males, and blue for females. C. Non-linear trends for statistically significant fatty acids associated with age. Solid lines represent the optimized LOESS-smoothed function for each fatty acid. Color coding indicates fatty acid groups: dimethyl acetals (DMA) in purple, saturated fatty acids (SFA) in red, monounsaturated fatty acids (MUFA) in green, polyunsaturated fatty acids n-3 (PUFAn-3) in yellow, PUFAn-6 in orange, and derived indexes in blue. FA: fatty acid.
Fig. 5
Fig. 5
Lipidomic changes across decades and aging crests. A. UpSet plot illustrating common lipid changes by decade. Each bar represents an intersection, as indicated by the dots below, and the height of the bar, along with the number on top, reports the number of significant lipids within each intersection. Enriched lipid categories in each intersection are shown as a heatmap, with colors indicating the proportion relative to all analyzed lipids in that category. Asterisks represent significant results from enrichment analysis (∗p < 0.05, ∗∗p < 0.01, ∗∗∗p < 0.001). B. Dot plot representing the number of differentially expressed lipids across ages, grouped into five-year intervals. C. Heatmap of the p-value distribution for lipid differences at each age. Colors represent the negative logarithm of p-values derived from Mann-Whitney U tests comparing lipid concentrations before and after each specified age. Lipids are ordered by lipid class, with associations indicated by color-coded bars: red for both sexes, green for males, and blue for females. D. Heatmap depicting the proportion of lipids from each lipid category within each aging crest. Significant results from enrichment analyses are indicated by asterisks (∗p < 0.05, ∗∗p < 0.01, ∗∗∗p < 0.001). Results are stratified by sex, highlighting enriched lipid classes separately for males and females. Lipid categories are color-coded as follows: fatty acyls (gray), glycerophospholipids (green), sphingolipids (yellow), glycerolipids (blue), steroids and derivatives (orange), and ubiquinone (maroon). FFA: free fatty acids; AC: acylcarnitine; LPC: lysophosphatidylcholine; LPE: lysophosphatidylethanolamine; LPI: lysophosphatidylinositol; LPC(O): alkyl-lysophosphatidylcholine; LPC(P): alkenyl (plasmalogen)- lysophosphatidylcholine; PC: phosphatidylcholine; PE: phosphatidylethanolamine; PG: phosphatidylglycerol; PI: phosphatidylinositol; PS: phosphatidylserine; PC(O): alkyl-phosphatidylcholine; PC(P) alkenyl (plasmalogen)- phosphatidylcholine; PE(O): alkyl-phosphatidylethanolamine; PE(P): alkenyl (plasmalogen)- phosphatidylethanolamine; oxPC: oxidized phosphatidylcholine; oxPE: oxidized phosphatidylethanolamine; dhCer: dihydroceramide; Cer: ceramide; Hex1Cer: hexosyl1ceramide; Hex2Cer: hexosyl2ceramide; Hex3Cer: hexosyl3ceramide; SM: sphingomyelin; Sph: sphingosine; DG: diacylglycerol; TG: triglyceride; TG(O): ether-linked triglyceride; CHO: cholesterol; CE: cholesteryl ester.
figs1
figs1
figs2
figs2
figs3
figs3

Similar articles

References

    1. Jové M., Portero-Otín M., Naudí A., Ferrer I., Pamplona R. Metabolomics of human brain aging and age-related neurodegenerative diseases. J. Neuropathol. Exp. Neurol. 2014;73:640–657. doi: 10.1097/NEN.0000000000000091. - DOI - PubMed
    1. Sol J., Ortega-Bravo M., Portero-Otín M., Piñol-Ripoll G., Ribas-Ripoll V., Artigues-Barberà E., Butí M., Pamplona R., Jové M. Human lifespan and sex-specific patterns of resilience to disease: a retrospective population-wide cohort study. BMC Med. 2024;22 doi: 10.1186/S12916-023-03206-W. - DOI - PMC - PubMed
    1. Rodgers J.L., Jones J., Bolleddu S.I., Vanthenapalli S., Rodgers L.E., Shah K., Karia K., Panguluri S.K. Cardiovascular risks associated with gender and aging. J. Cardiovasc. Dev. Dis. 2019;6 doi: 10.3390/JCDD6020019. - DOI - PMC - PubMed
    1. Poewe W., Seppi K., Tanner C.M., Halliday G.M., Brundin P., Volkmann J., Schrag A.E., Lang A.E. Parkinson disease. Nat. Rev. Dis. Primers. 2017;3:1–21. doi: 10.1038/NRDP.2017.13. - DOI - PubMed
    1. Hy L.X., Keller D.M. Prevalence of AD among whites: a summary by levels of severity. Neurology. 2000;55:198–204. doi: 10.1212/WNL.55.2.198. - DOI - PubMed

LinkOut - more resources