. 2025 Aug:118:105857.
doi: 10.1016/j.ebiom.2025.105857. Epub 2025 Jul 23.

Rapid, sensitive, and species-independent detection of Crimean Congo hemorrhagic fever virus nucleoprotein and GP38 antibodies

Affiliations

Rapid, sensitive, and species-independent detection of Crimean Congo hemorrhagic fever virus nucleoprotein and GP38 antibodies

Elif Karaaslan et al. EBioMedicine. 2025 Aug.

Abstract

Background: Crimean-Congo hemorrhagic fever virus (CCHFV), a zoonotic agent in the Nairoviridae family (genus Orthonairovirus), is a high-priority pathogen. CCHFV infection causes Crimean-Congo hemorrhagic fever (CCHF), a human disease with case fatality rates of up to 40%. Serological surveillance of CCHFV in animals and humans is crucial for ecological studies and public health.

Methods: We developed CCHFV mix-and-read assays utilizing split-NanoLuc technology (NanoBiT) to detect anti-CCHFV antibodies against the nucleoprotein (NP) stalk region and the GP38 glycoprotein. These species- and isotype-agnostic assays provide results in ∼30 min. Using serum samples from RT-PCR-confirmed CCHF cases collected during and after hospitalization, we investigated anti-NP and anti-GP38 antibody development. The performance of the mix-and-read assays was compared to the NP-based IDScreen® CCHF commercial assay using human sera, and cross-reactivity potential was evaluated using a diverse panel of anti-orthonairovirus antisera raised in mice.

Findings: In human convalescent cases (n = 21), mix-and-read assay concordance between anti-GP38 and anti-NP antibody detection was 100%. Both mix-and-read assays and IDScreen® CCHF demonstrated identical sensitivity of 95.2% in convalescent patients. The specificity of the NP assay was 98.9%, and that of GP38 was 99.7%, both comparable to IDScreen® CCHF (specificity: 99.7%). Cross-reactivity against CCHF NP and GP38, regardless of assay type, was primarily observed in antisera raised against other orthonairoviruses within the Nairobi sheep disease genogroup.

Interpretation: The simplicity and robust performance of the CCHFV mix-and-read assays make them ideal tools for supporting serological surveillance in humans and animals. Furthermore, the inclusion of the GP38 antigen alongside NP enhances the precise identification of retrospective CCHF cases, further strengthening broad surveillance efforts.

Funding: CDC Emerging Infectious Disease Research Core Funds, funding for reagent, CDC personal, travel. Defence Threat Reduction Agency (HDTRA12210007): E.K. salary. Oak Ridge Institute for Science and Education (ORISE): E.K. salary and travel. National Institute of Allergy and Infectious Diseases (1R01AI180125-01A1): sample acquisition. Funding sources did not have a role in the writing or decision to submit the publication.

Keywords: Animal surveillance; Antibody detection; Antibody kinetics; Biosensor; CCHF; Crimean-Congo hemorrhagic fever; Cross-reactivity; Diagnostic techniques; Disease severity; ELISA; GP38; Nucleoprotein; Orthonairovirus; Serological diagnosis; Serosurveillance; Tick-borne diseases.


Conflict of interest statement

Declaration of interests E.K. was supported by the Oak Ridge Institute for Science and Education (ORISE) fellowship. M.M.S., E.B., and S.D.P. were supported by the National Institute of Allergy and Infectious Diseases (NIAID) grant 1R01AI180125-01A1. E.B. and S.D.P. also received funding from NIAID (1R01AI151006) and the Defence Threat Reduction Agency (HDTRA12210007). The funding sources had no role in the design, writing, or decision to submit this manuscript.

Figures

Fig. 1
Fig. 1
CCHFV mix-and-read assay. Schematic representation of mix-and-read (MR) assay, antigen designs for combined CCHFV MR assay, and initial assessments. (a) MR assay is performed using 15 μL of optimized biosensor mix and 15 μL of the test sample. The binding of antigens to specific antibodies brings the small and large subunits of the luciferase together, reconstituting enzyme activity. After 20 min of incubation, luciferase substrate is added. The reconstitution of luciferase following antibody binding results in a luminescence signal upon substrate addition. The signal is measured 10 min after the substrate is added. (b) CCHFV NP protein structure. Colour-coded fragments represent the corresponding region in the protein structure. NP1 and NP3 fragments correspond to the head domain, and NP2 fragment corresponds to the stalk domain. (c) NP1 (purple square), NP2 (blue circle), and NP3 (orange triangle) biosensors were tested using a human sample collected from a recovered CCHF patient. All biosensors were used in 1, 10, and 100 nm final concentrations. (d) NP MR assay was performed using biosensor concentrations ranging between 0.8 and 100 nM, and samples from CCHFV-infected rabbit (red square), and mouse (blue triangle) were tested. (e) Commercial anti-NP monoclonal antibodies (mAbs) 9D5 (purple rhombus) and 2B11 (blue circle) were tested using concentrations of 0.05–100 nM, with optimized biosensor concentration. (f) Schematic representation of GP38 MR assay biosensor design. (g) GP38 MR assay was performed using biosensor concentrations of 0.05–100 nM; samples from CCHFV-infected human (orange circle), rabbit (red square), and mouse (blue triangle) were tested. (h) Commercial anti-GP38 mAbs 6B12 (site I, dark blue square), 5A5 (site II, dark purple rhombus), and 7F5 (site III, light blue star) were tested using concentrations of 0.05–100 nM with optimized biosensor concentration. Graphs are plotted based on results from a single measurement or technical replicates with standard deviation when replicates are available. A luminescence signal from normal human serum was used as the assay background. Results are represented as signal/background (S/B) ratios calculated by dividing the signal from the test sample by the signal from normal human serum.
Fig. 2
Fig. 2
CCHFV MR assay detects antibodies in convalescent patient samples. The CCHFV MR assay was validated using CCHFV-positive samples from an endemic country and CCHFV-negative human samples from a non-endemic country. 21 samples collected during the early convalescent period (3–6 months post-infection) were tested with NP and GP38 MR assays and IDScreen® CCHF for comparison. ROC curves for (a) NP and (b) GP38 mix and read assays and (c) IDScreen® CCHF are shown. The curves show the trade-off between sensitivity and specificity. The area under the curve (AUC), sensitivity, and specificity along with 95% confidence intervals and p-values at the cut-off values are given for each analysis. (d) The signal-to-background ratios of NP and GP38 MR (left Y-axis) and S/P% of IDScreen® CCHF (right Y-axis) results are presented. Each dot represents the result of an individual sample, and red symbols represent the samples selected for tittering assay. Horizontal dotted lines indicate cut-off values for each assay: NP MR cut-off = 3, GP38 MR cut-off = 1.8, and IDScreen® CCHF cut-off = 30 Sample-to-Positive Percentage (S/P%).
Fig. 3
Fig. 3
Serological assays detect the development of anti-CCHFV antibodies in acute case samples. Patient samples were grouped based on days post-symptom onset. The Signal/Background Ratios of (a) NP and (b) GP38 MR assays and S/P% for (c) IDScreen® CCHF were presented. The orange dashed horizontal lines on the graphs represent the assays cut-off values, green lines indicate the median of each time point. (d) The sensitivity of each assay at each time point is presented with 95% CI. (e) The area under the curves of each assay at each time point is presented with 95% CI. NP MR: grey triangle, GP38 MR: blue square, Combined MR: light blue circle, IDScreen® CCHF: orange inverse triangle ∗convalescence:3–6 months post-infection. Sample number in D2:10, D3:53, D4:81, D5:94, D6:93, D7:86, D8:80, D9:76, D10: 52, D11-22: 89, convalescence:21.
Fig. 4
Fig. 4
Comparative analysis of antibody kinetics in mild/moderate versus severe cases. Patient samples were grouped based on disease severity and sample collection post-symptom onset. The samples from mild/moderate cases are shown with blue triangles, and severe cases are shown with green squares. The sensitivity of (a) NP MR, (c) GP38 MR, (e) IDScreen® CCHF, and (g) Combined MR were presented with 95% CI. The Signal/Background Ratios of (b) NP MR, (d) GP38 MR, and (f) S/P% IDScreen® CCHF were presented. The black dashed horizontal lines on the graphs represent the cut-off values for each assay, and the black lines represent the median of each time point. The statistical differences in signal-to-background ratios and S/P% were tested with the Mann–Whitney U test, and p-values are given. Mild/moderate cases sample number in D2:6, D3:19, D4:27, D5:29, D6:41, D7:24, D8:33, D9:22, D10:33, D11–22:42. Severe cases sample number in D2:4, D3:34, D4:54, D5:65, D6:52, D7:62, D8:47, D9:54, D10:29, D11–22:47.
Fig. 5
Fig. 5
CCHFV MR assay allows for cross-species detection of anti-CCHFV antibodies. To assess cross-species anti-CCHFV antibody detection with CCHFV MR assays, 478 sheep and 304 goat samples were tested using the cut-off values derived from confirmed human CCHF cases. (a) The Signal/Background Ratios of sheep samples using NP and GP38 MR are shown. Each dot represents reads from individual samples, and green horizontal dashed lines show the cut-off values of the given assay. Text boxes above each assay column display the overall positivity rate, calculated as the percentage of samples above the cut-off values. (b) Positivity rates of sheep samples for each assay with 95% CI are given. (c) The distribution of sheep sample numbers that tested positive are given in a Venn diagram. (d) The Signal/Background Ratios of goat samples using NP and GP38 MR are represented. Each dot represents reads from individual samples, and green horizontal dashed lines show the cut-off values of the given assay. Text boxes above each assay column display the overall positivity rate, calculated as the percentage of samples above the cut-off values. (e) Positivity rates of goat for each assay, with 95% CI are given. (f) The distribution of goat sample numbers that tested positive is given in a Venn diagram. NP MR cut-off: 3; GP38 MR cut-off: 1.8; IDScreen® CCHF cut-off: 30% of Positive control.
Fig. 6
Fig. 6
Performance of MR assays compared to IgG ELISA and IDScreen CCHF using animal samples. Subsets of sheep (n = 90) and goat (n = 95) samples were tested with IgG ELISA, IDScreen® CCHF, and GP38, NP, and combined MR assays. (a) Results of sheep samples tested with GP38 and NP MR assays or IDScreen® CCHF are represented. Each dot represents individual sample reads, and green horizontal dashed lines show the cut-off values of the given assay. Text boxes above each assay column display the overall positivity rate, calculated as the percentage of samples above the threshold. (b) Positivity rates of sheep samples for each assay with 95% CI are given. (c) The distribution of sheep sample numbers that tested positive is given in a Venn diagram. (d) Results of goat samples tested with GP38 and NP MR assays or IDScreen® CCHF are represented. Each dot represents reads from individual samples, and green horizontal dashed lines show the cut-off values of the given assay. Text boxes above each assay column display the overall positivity rate, calculated as the percentage of samples above the cut-off values. (e) Positivity rates of goat samples for each assay with 95% CI are given. (f) The distribution of goat sample numbers that tested positive is given in a Venn diagram. NP MR cut-off: 3; GP38 MR cut-off: 1.8; IDScreen® CCHF cut-off: 30.
Fig. 7
Fig. 7
Cross-reactivity of antibodies from mice infected with different CCHFV isolates and other nairoviruses. (a) HMAF samples from mice infected with viruses belonging to NSD genogroup (CCHFV isolates Drosdov, Ar15786, JD-206, UG3010, IbAr10200, HAZV JC280, and DUGV IbAr1792), were used in in-house ELISA, and results were given for full length-NP, stalk domain of NP, and GP38. (b) HMAF samples from mice infected with viruses belonging to non-NSD genogroups (Issyk-Kul virus, Dera Ghazi Khan virus, Keterah virus, Sakhalin virus, Qalyub virus, Thiafora virus) or with control viruses (Rift Valley Fever virus, Parainfluenza virus-1) were used in in-house ELISA, and results were given for full length-NP, stalk domain of NP, and GP38. A 1:50 dilution of HMAF samples was prepared, and a 2-fold serial dilution of the samples was tested. The sum of 3 × standard deviation and mean OD from the background control wells was subtracted from the OD of the samples; data are presented as endpoint titres. The same HMAF samples were tested with NP MR (c), GP38 MR (d), and IDScreen® CCHF (e). Results are presented as the mean of technical replicates with standard deviation when applicable. The dotted horizontal lines on the graphs represent the cut-off values for each assay. NP MR cut-off: 3; GP38 MR cut-off: 1.8; IDScreen® CCHF cut-off: 30.
Supplemental Figure S1
Performance of full-length Hoti NP compared to NP stalk in the mix-and-read assay. The full-length Hoti NP (purple triangle) and NP stalk (blue square) biosensors were used at a final concentration of 5 nM each. Convalescent human serum from Oman, CCHFV-infected rabbit serum, and 12.5 nM of a commercially available anti-NP mAb (2B11) were tested in the MR assay. Results are represented as signal/background (S/B) ratios, calculated by dividing the signal from the test sample by the signal from negative human serum. The symbols represent the mean of the technical replicates, and the error bars indicate the standard deviation when available.
Supplemental Figure S2
2B11 binds to the stalk domain of the CCHFV NP. The binding of two commercially available monoclonal antibodies, 9D5 and 2B11, to full-length NP (2B11: blue circle, 9D5: purple circle) and the NP stalk domain (2B11: pink circle, 9D5: green circle) was tested by ELISA. Plates were coated with 50 ng/well of recombinant proteins, and monoclonal antibodies were tested at concentrations ranging from 0.1 to 100 nM. The binding of mAbs was detected using an anti-mouse IgG-HRP secondary antibody. The cut-off value was determined by the sum of 3× standard deviation and the mean of the background control wells. The symbols represent the single read for a given concentration.
Supplemental Figure S3
Alignment of NP and GP38 with Dugbe virus, Hazara virus, and Nairobi sheep disease virus. Protein sequences of (a) NP and (b) GP38 from CCHFV Hoti (accession numbers; AAZ32529 for nucleoprotein, ABW04159 for glycoprotein precursor) isolate were aligned with DUGV (accession numbers; AAL73399 for nucleoprotein, AMT75393 for glycoprotein precursor), HAZV (accession numbers; YP_009507852 for nucleoprotein, YP_009507851 for glycoprotein precursor) and Nairobi sheep disease virus (NSDV) (accession numbers; AAM33323 for nucleoprotein, ACH99800 for glycoprotein precursor). Identity, similarity, and gaps are given as percentages, and the intensity of the blue colour corresponds to percentages ranging from 0 to 100. Conserved residues were highlighted in yellow. Alignment and calculations were performed using SnapGene 5.1.7.
Supplemental Figure S4
Study population and serological assays. Schematic representation of human samples used in the study. (a) 714 samples were collected from 203 real-time RT-PCR-confirmed acute CCHFV cases at different time points post-symptom onset. Samples were heat-inactivated at 56 °C for 30 minutes before use, and all testing was performed in a biosafety cabinet. 21 convalescence samples collected 3-6 months after CCHFV infection from real-time RT-PCR-confirmed cases were used as early convalescence samples. Non-case samples (from the USA) consisted of commercially obtained healthy human serum samples, which were used to determine baseline signals of the assays. Additionally, 300 non-case samples from Turkey were collected from patients admitted to Bezmialem Vakif University for routine checkups or blood donations. Serological assays used in the study are summarized below in the figure. (b) The bar graph shows the sample collection schedules from confirmed CCHFV cases and total number of samples collected at each time point.
Supplemental Figure S5
Evaluating the potential hook effect in MR assays using clinical samples. To investigate the hook effect, four samples exhibiting the highest signal-to-background ratios were tested with a 2-fold dilution series and results are given for (a) NP MR and (b) GP38 MR. The horizontal dotted lines represent the cut-off values of each assay. The symbols represent a single read from the corresponding dilution of the given sample. Patient 1: green circle, patient 2: blue square, patient 3: purple inverse triangle, Patient 4: pink rhombus.
Supplemental Figure S6
Distribution of single and double positive samples for NP and GP38 antibodies. 714 samples from acute CCHFV patients and 21 convalescent samples were grouped based on sample collection post-symptom onset. The percentages of samples that tested positive with only the NP or GP38 MR assays, as well as those positive with both assays, were reported for each time point with 95% confidence intervals. Single NP positive: grey triangle, single GP38 positive: blue square, NP and GP38 positive: orange inverse triangle.
Supplemental Figure S7
Comparison of the performance of the species-agnostic assays, IgG ELISA, and IgM ELISA using acute case samples. Two hundred thirty-four samples were grouped based on collection time post-symptom onset, and the sensitivity of each assay is presented with 95% confidence intervals. CDC IgG ELISA: black open circle, NP MR: grey triangle, GP38 MR: blue square, IDScreen® CCHF: orange inverse triangle, Combined MR: light blue circle, CDC IgM ELISA: green rhombus.
Supplemental Figure S8
Differences in assay signals between mild/moderate and severe cases. The area under the curve was calculated for patients from whom at least four sequential samples were collected. The AUCs of sequential samples from 33 mild/moderate cases and 71 severe cases were presented with group medians. Differences in assay signals between mild/moderate and severe cases were tested using the Mann–Whitney U test, and exact p-values are given.
Supplemental Figure S9
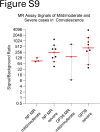
Comparison of mix-and-read assay reads of convalescence samples of mild/moderate and severe cases. Twelve convalescence samples were grouped based on disease severity. The red horizontal lines show the group medians and the error bars represent the 95% confidence intervals. The statistical differences in signal-to-background ratios were tested with the Mann-Whitney U test.
Supplemental Figure S10
Correlation between assays using control samples from Turkey. Samples were collected from 300 patients admitted to Bezmialem Vakif University for various reasons (bloodwork, blood donation, routine check-ups, etc.) (a) The XY graph with NP MR on the X-axis and GP38 MR on the Y-axis is given. Spearman r with 95% CI, and p-value are given. (b) A subset of these samples (n = 90) was tested with IDScreen® CCHF. The XY graph with NP MR on the X-axis and GP38 MR on the Y-axis is given. Triple-negative samples (NP MR, GP38 MR, and IDScreen® CCHF); blue square, triple-positive samples (NP MR, GP38 MR, and IDScreen® CCHF); red circle, NP MR and IDScreen® CCHF; green triangle, NP MR single positives; purple inverse triangle, GP38 MR single positives; brown circle, IDScreen® CCHF single positives; orange square. Each dot represents the results of an individual sample, and horizontal and vertical lines represent the cut-off values of the assay given on the corresponding axes. NP MR assay cut-off: 3; GP38 MR assay cut-off: 1.8. The quadrants of the graphs are labelled with the percentage of samples tested as double negative, single positive, and double positive for the given assays.
Supplemental Figure S11
Correlation analysis of MR assay performances using sheep and goat samples. 478 sheep and 304 goat samples were tested with NP and GP38 MR, and Spearman correlation analysis was performed. The XY graphs with NP MR on the X-axis and GP38 MR on the Y-axis were given for sheep samples in (a) and for goat samples in (b). Each dot represents the results of an individual sample, and horizontal and vertical lines represent the cut-off values of the assay given on the corresponding axes. NP MR assay cut-off 3; GP38 MR assay cut-off: 1.8. The quadrants of the graphs are labelled with the percentage of samples tested as single or double positive. The r-values with 95% confidence intervals, and p-values of each correlation analysis are given below.
Supplemental Figure S12
IgG ELISA titres and MR signals of sheep and goat samples. Agreement between IgG ELISA titres and MR signals from NP MR and GP38 MR assays for sheep (n = 478) (a,b) and goat (n = 304) (c,d) samples. Each sample is colour-coded to represent its IgG ELISA results. Black symbols: IgG-negative; blue symbols: IgG-positive. Horizontal dotted lines represent the cutoffs of the MR assay represented in the corresponding graph. The percentage positivity of the MR assay for each titre is given above the corresponding titre. NP MR cut-off: 3; GP38 MR cut-off: 1.8. Each dot represents the results of an individual sample, and the green line represents the median of the groups. Sheep sample number (n) in 1:50 (369), 1:100 (33), 1:400: (41), 1:1600: (28), ≥1:6400: (6). Goat sample number (n) for NP MR in 1:50 (239), 1:100 (25), 1:400: (22), 1:1600: (12), ≥1:6400: (5). Goat sample number (n) for GP38 MR in 1:50 (240), 1:100 (25), 1:400: (22), 1:1600: (12), ≥1:6400: (4).
Supplemental Table S1
Statistical analysis of assay performances with acute CCHFV case samples. Assay performances were compared using McNemar’s test, and the resulting p values are reported, with p values < 0.05 highlighted in red. Sample number in D2:10, D3:53, D4:81, D5:94, D6:93, D7:86, D8:80, D9:76, D10:52, D11-22: 89.
Supplemental Table S2
Statistical analysis of assay performances with small subset from acute CCHFV case samples. Assay performances were compared using McNemar’s test, and the resulting p values are reported, with p values < 0.05 highlighted in red. Sample number in D2:6, D3:17, D4:24, D5:24, D6:39, D7:22, D8:29, D9:23, D10:19, D11-22: 31.
Supplemental Table S3
Statistical analysis of assay performances on samples from mild/moderate and severe cases. Assay performances were compared using McNemar’s test for paired samples and Fisher’s exact test for unpaired samples, and the resulting p values are reported, with p values < 0.05 highlighted in red. Mild/moderate cases sample number in D2:6, D3:19, D4:27, D5:29, D6:41, D7:24, D8:33, D9:22, D10:33, D11-22:42. Severe cases sample number in D2:4, D3:34, D4:54, D5:65, D6:52, D7:62, D8:47, D9:54, D10:29, D11-22:47.
Supplemental Table S4
Statistical analysis of assay performances with sheep and goat samples. Assay performances based on results from 478 sheep and 304 goat samples were compared using McNemar’s test, and the resulting p values are reported.
Supplemental Table S5
Sequence similarity of nairoviruses tested for cross-reactivity. Amino acid sequences were aligned with pairwise sequence alignment, and similarities were calculated with BLOSUM62 matrix (EMBL-EBI).

References

    1. Dvm P.F., Schnepf G., Gonzalez-Martin F., Bi Z. In: Crimean-Congo hemorrhagic fever. Ergonul O., Whitehouse C.A., editors. 2007. International surveillance and control of Crimean-Congo hemorrhagic fever outbreaks; pp. 295–303. Dordrecht: Springer Netherlands.
    1. Estrada-Peña A., Jameson L., Medlock J., Vatansever Z., Tishkova F. Unraveling the ecological complexities of tick-associated Crimean-Congo hemorrhagic fever virus transmission: a gap analysis for the western Palearctic. Vector Borne Zoonotic Dis. 2012;12(9):743–752. - PubMed
    1. Utunen H., Tokar A., Dancante M., Piroux C. Online learning for WHO priority diseases with pandemic potential: evidence from existing courses and preparing for Disease X. Arch Public Health. 2023;81(1):61. - PMC - PubMed
    1. Bente D.A., Forrester N.L., Watts D.M., McAuley A.J., Whitehouse C.A., Bray M. Crimean-Congo hemorrhagic fever: history, epidemiology, pathogenesis, clinical syndrome and genetic diversity. Antiviral Res. 2013;100(1):159–189. - PubMed
    1. W H O . Crimean-Congo Haemorrhagic Fever; 2022. Crimean-Congo haemorrhagic fever.https://www.who.int/news-room/fact-sheets/detail/crimean-congo-haemorrha... [cited 2023 Dec 5]. Available from:

MeSH terms