. 2025 Aug 19;6(8):102244.
doi: 10.1016/j.xcrm.2025.102244. Epub 2025 Jul 23.

Recreating pathophysiology of CLN2 disease and demonstrating reversion by TPP1 gene therapy in hiPSC-derived retinal organoids and retina-on-chip

Affiliations

Recreating pathophysiology of CLN2 disease and demonstrating reversion by TPP1 gene therapy in hiPSC-derived retinal organoids and retina-on-chip

Serena Corti et al. Cell Rep Med. .

Abstract

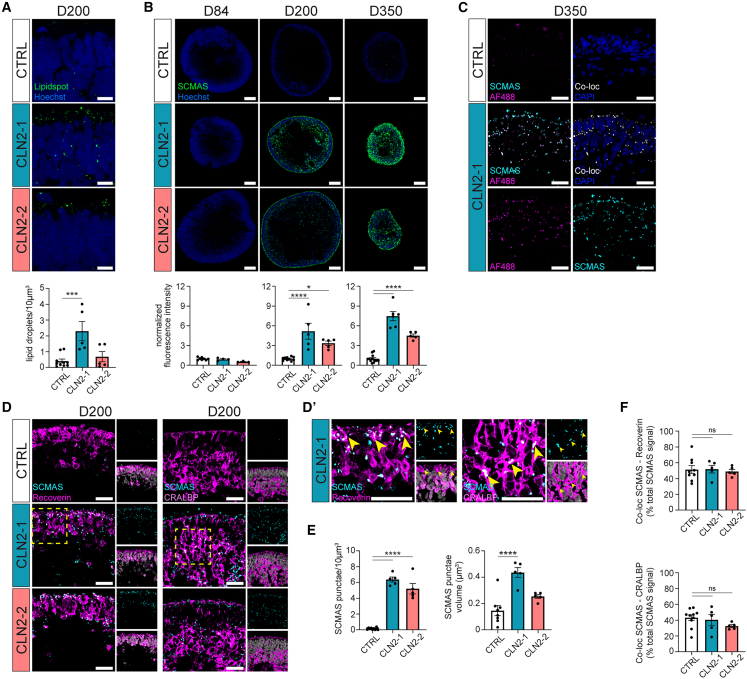
Mutations in the tripeptidyl peptidase 1 (TPP1) gene lead to neuronal ceroid lipofuscinosis type 2 (CLN2), characterized by lysosomal accumulation of lipofuscins predominantly in the brain and retina. The ocular phenotype is characterized by outer retinal degeneration that leads to vision loss. Leveraging human induced pluripotent stem cell (hiPSC)-derived retinal organoids (ROs), retinal pigmented epithelial cells, and the retina-on-chip system, we establish an in vitro CLN2 model that recreates the principal histological hallmarks, namely the accumulation of subunit C of mitochondrial ATP synthase (SCMAS) and lipids mainly in the outer retina. Furthermore, single-cell RNA sequencing reveals a dysregulation of translational and mitochondrial function in CLN2 cones. Finally, adeno-associated virus (AAV)-mediated TPP1 gene therapy can restore TPP1 expression and decrease and even prevent SCMAS accumulations. Our study uses an innovative human-relevant microphysiological retinal disease models, uncovers previously uncharacterized mechanisms of CLN2 pathophysiology, and demonstrates the potential of AAV9.hCLN2 gene therapy for CLN2 disease, potentially treating patient blindness.

Keywords: CLN2; SCMAS; TPP1; gene therapy; neuronal ceroid lipofuscinosis type 2; retina-on-chip; retinal organoids; subunit C of mitochondrial ATP synthase; tripeptidyl peptidase 1.


Conflict of interest statement

Declaration of interests K.H.K., C.B.T., M.H., R.M.R., T.C., and N.B. are current or previous employees of REGENXBIO, Inc. K.H.K. and N.B. are inventors on patent applications related to AAV9.hCLN2 vector delivery methods. N.B. is an inventor on patent applications related to AAV formulations. K.A., S.L., and P. Loskill hold a patent on the RoC technology.

Figures

None
Graphical abstract
Figure 1
Figure 1
Characterization of CLN2 ROs (A) Schematic of the hiPSC lines, RO differentiation protocol, and analysis time points (days 84, 200, and 350) and bright-field image of ROs at day 200. (B and C) Uniform manifold approximation and projection (UMAP) of a single-cell RNA-seq dataset from ROs at day 192 (n = 2 CTRLs, 2 CLN2s) and (C) cell type composition. (D) UMAP of cell type-specific markers (GNGT1: rods; ARR3: cones; TFAP2A: amacrine cells; CA10: bipolar cells; ONECUT1: horizontal cells; RLBP1: Müller glia; KI67: proliferative progenitors). (E) Recoverin (photoreceptors) immunostaining in CTRL1 and CLN2 ROs. (F) UMAP of TPP1 gene expression as expression levels (left) and expression density (right). (G) Heatmap of TPP1 expression (countsTPP1/countscell∗10,000) and percentage of TPP1-expressing cells. (H) TPP1 immunostaining and quantification in CTRL (image: CTRL1) and CLN2 ROs at days 84, 200, and 350. Values were normalized on TPP1 expression in CTRLs. n = 5 ROs, one differentiation. (I) Single confocal plane of TPP1 and recoverin in ROs at day 200. Yellow-dashed square: magnified area in the third column. n = 5 ROs from one differentiation. Graphs shows number of TPP1 punctae per 10 μm3. (J) Single confocal plane showing colocalization of TPP1 with LAMP1 at day 350. Arrowhead: examples of colocalizing. Values: mean ± SEM. Scale bars: (A) 200 μm, (E, H) 100 μm, (I) 25 μm. Hoechst: (E, H) blue, (J) gray. ∗p < 0.05, ∗∗p < 0.01, ∗∗∗p < 0.001, ∗∗∗∗p < 0.0001.
Figure 2
Figure 2
Autofluorescence, SCMAS, and lipid accumulation in CLN2 ROs (A) LipidSpot and quantification of lipid droplets per 10 μm3 at day 200 CTRL (image: CTRL1) and CLN2 ROs. Hoechst: blue. n = 5 ROs from one differentiation. (B) SCMAS immunostaining and quantification in CTRL (image: CTRL1) and CLN2 ROs at days 84, 200, and 350. n = 5 ROs from one differentiation. (C) Single confocal plane showing co-localization of SCMAS and green autofluorescence in day 350 CTRL (image: CTRL1) and CLN2 (image: CLN2-1) ROs. SCMAS and autofluorescent co-localization: white. (D) Single confocal plane showing co-localization of SCMAS with recoverin and CRALBP in CTRL (image: CTRL1) and CLN2 ROs at day 200. Yellow dashed square: magnified area in (D′). (D′) Yellow arrowheads: examples of colocalizing signal. (E) Quantification of SCMAS punctae per 10 μm3 and SCMAS punctae volume in CTRL (CTRL1, CTRL2) and CLN2 ROs at day 200. n = 5 ROs from one differentiation. (F) Co-localization percentage of SCMAS with recoverin and CRALBP in CTRL (CTRL1, CTRL2) and CLN2 ROs at day 200. n = 5 ROs, one differentiation. Values are mean ± SEM. (A, B) Values normalized to CTRL ROs. Scale bars: (A) 10 μm, (B) 100 μm, (C, D) 25 μm. Hoechst: (A, C) blue, (D, D′) gray. ∗p < 0.05, ∗∗p < 0.01, ∗∗∗p < 0.001, ∗∗∗∗p < 0.0001.
Figure 3
Figure 3
scRNA-seq highlights dysregulation of protein translation and mitochondrial function in CLN2 RO cones (A) Differential gene expression (DGE) analysis performed on the cone cluster of the scRNA-seq dataset (n = 2 CTRL and 2 CLN2 RO samples). Heatmap shows top 25 up- and downregulated genes sorted by a Bonferroni-corrected p value in individual cells of each line. Notable genes are highlighted in red. (B) Network plot (CNET) of a gene set enrichment analysis (GSEA) comparing Gene Ontology (GO) terms (biological processes, cellular components, and metabolic function) of cones. Node color: adjusted p value of enrichment. Node size: number of genes in the core enrichment set. (C) UCell score of selected GO terms of three clusters (ribosomes, mitochondrial membrane, and respiration) enriched in the GSEA analysis. Color: average-scaled U-score. (D) iRegulon analysis of cone DGE (CLN2s vs. CTRLs). y axis: normalized enrichment score (NES) of each depicted transcription factor in DGE cone dataset. TP53-selected downstream targets are depicted in the light blue box. (E) RICTOR (regulator of the mTOR complex 2) expression in cones. Adjusted p value: Wilcoxon test and Bonferroni correction. (F) Gene expression heatmap of downstream targets of RICTOR (enriched in a CLN2 brain dataset from Sleat et al., meta-analysis performed by Kline et al.). Red-labeled genes were found significantly different in cones of RO in our dataset. (G and H) Single confocal plane showing TOMM20 with (G) PNA lectin (PNAL) and (H) LAMP2 in ROs at day 158. Scale bars, 20 μm. (I and J) Quantification of TOMM20 signal in the PNAL+ area (I) and TOMM20/LAMP2 co-localization (J). Values are mean ± SEM. n = 14–17 ROs from two differentiations, respectively. (K) Putative dysregulation mechanisms in cones of CLN2 ROs. Hoechst: gray. ∗p < 0.05, ∗∗p < 0.01, ∗∗∗p < 0.001, ∗∗∗∗p < 0.0001.
Figure 4
Figure 4
AAV9.hCLN2 delivery to CLN2 ROs restores TPP1 expression (A) Schematic of AAV9.hCLN2 treatment of ROs. (B and C) UMAP of a single-cell RNA-seq dataset derived from ROs at day 192 (n = 2 CTRLs, 2 CLN2 patient lines, and 2 AAV9.hCLN2-treated CLN2 patient lines) indicating individual cell types and (C) cell type composition. (D) UMAP of TPP1 transgene expression in AAV9.hCLN2-treated ROs as expression levels and expression density. (E) Heatmaps of TPP1 transgene expression levels (countsTPP1/countscell∗10,000) and the percentage of TPP1-expressing cells (in %). (F) Transduction efficiency of RO cell types. Top: cell types colored in shades of red proportionally to their TPP1 transgene expression. Ganglion cells (GCs, gray) were not found in day 192 ROs. Bottom: proportional area chart. HCs, horizontal cells; MGs, Müller glia; BCs, bipolar cells; ACs, amacrine cells. (G–I) TPP1 immunostaining and quantification of ROs treated with AAV9.hCLN2 at days 88, 123, and 260. AAV9.hCLN2 dose 1: 5 × 10⁹, dose 2: 5 × 10¹⁰, and dose 3: 1.67 × 10¹¹ gc/RO. Values were normalized to CTRL ROs (dashed line). Analyzed ROs: CLN2-1 n = 8–11; CLN2-2 n = 3–8; CTRL1 n = 9–14; CTRL2 n = 8–9. (J) Single confocal plane and quantification of TPP1 in day 123 + 35 ROs treated with AAV9.hCLN2. n = 5 ROs, 2 experiments. (K) TPP1 protein concentration in supernatants in day 123 + 35 ROs treated with AAV9.hCLN2, evaluated by electrochemiluminescence (ECL) immunoassay. Analyzed ROs: CLN2-1 n = 21–22, 3 experiments; CLN2-2 n = 16–18, 5 experiments; CTRL1 n = 32 from 5 experiments; CTRL2 n = 25, 3 experiments. Values are mean ± SEM. Scale bars: (G–I) 100 μm, (J) 25 μm. Hoechst: blue. Tx: treatment. ∗p < 0.05, ∗∗p < 0.01, ∗∗∗p < 0.001, ∗∗∗∗p < 0.0001.
Figure 5
Figure 5
AAV9.hCLN2 treatment can decrease and prevent SCMAS accumulation in CLN2 ROs (A–C) SCMAS immunostaining and quantification of ROs treated with AAV9.hCLN2 at days 88, 123, and 260. AAV9.hCLN2 dose 1: 5 × 10⁹, dose 2: 5 × 10¹⁰, and dose 3: 1.67 × 10¹¹ gc/RO. Values were normalized on SCMAS expression in CTRL ROs = dashed line. Number of analyzed RO: see Figures 4G–4I. (D) Single confocal plane of SCMAS immunostaining and quantification in day 123 + 35 ROs treated with AAV9.hCLN2. N = 5 ROs, two experiments. Values are mean ± SEM. Scale bars: (A–C) 100 μm, (D) 25 μm. Hoechst: blue. Tx: treatment.
Figure 6
Figure 6
Characterization and AAV9.hCLN2 treatment of CLN2 RPE cells (A) TPP1 and SCMAS immunostaining and quantification of hiPSC-RPE cultured for 4 weeks. n = 3, one differentiation. (B) Schematics of AAV9.hCLN2 treatment of the hiPSC-RPE. (C and D) TPP1 and SCMAS immunostaining and SCMAS quantification of hiPSC-RPE 63 days after treatment with AAV9.hCLN2. AAV9.hCLN2 dose 1: 105 gc/cell and dose 2: 106 gc/cell. n = 4–5, one differentiation. Values are mean ± SEM. Scale bars: (A) 25 μm, (C, D) 100 μm. Hoechst: blue. Tx: treatment. ∗p < 0.05, ∗∗p < 0.01, ∗∗∗p < 0.001, ∗∗∗∗p < 0.0001.
Figure 7
Figure 7
Evaluation of AAV9.hCLN2 gene therapy in CLN2 RoC (A) Schematics of AAV9.hCLN2 treatment of the RoC. (B and C) TPP1 and SCMAS immunostaining and quantification of day 123 + 28 ROs treated with AAV9.hCLN2 in the RoC. AAV9.hCLN2 dose 1: 6.5 × 10⁹, dose 2: 6.5 × 10¹⁰, and dose 3: 2.17 × 10¹¹ gc/well. TPP1 and SCMAS intensity in CTRL organoids are represented as dashed line. Analyzed ROs: CLN2-1 n = 10–11; CLN2-2 n = 8; CTRL1 n = 16; CTRL2 n = 14. (D) TPP1 immunostaining and quantification of hiPSC-RPE cells in AAV9.hCLN2-treated RoCs. Number of analyzed RoC wells: CLN2-1, CLN2-2 n = 1; CTRLs n = 4. (E and F) Quantification of TPP1 (E) and SCMAS (F) in ROs treated with AAV9.hCLN2 at day 123 + 35 in RO culture (gray line, treatment, doses, and n, see Figure 4) or at day 123 + 28 in RoC (red line, treatment, doses, and n, see B and C). Values were normalized on TPP1 or SCMAS expression in CTRL ROs or RoC = dashed line. (G) TPP1 protein in supernatant of ROs treated with AAV9.hCLN2 in RO culture (gray line) or RoC (red line), evaluated by electrochemiluminescence (ECL) immunoassay. Gray and red dashed lines: average concentration of TPP1 in CTRL samples from RO culture and RoC treatment, respectively. Analyzed RO supernatants: see Figure 4K. Analyzed ROC supernatants: CLN2-1 n = 7–19, 5 RoC; CLN2-2 n = 9–15, 4 RoC; CTRL1 n = 25, 7 RoC; CTRL2 n = 27, 7 RoC. Scale: log10. Values and dots are mean ± SEM. Scale bars: (B, C) 100 μm, (D) 50 μm. Hoechst: blue. Tx: treatment. ∗p < 0.05, ∗∗p < 0.01, ∗∗∗p < 0.001, ∗∗∗∗p < 0.0001.

References

    1. Sleat D.E., Donnelly R.J., Lackland H., Liu C.G., Sohar I., Pullarkat R.K., Lobel P. Association of mutations in a lysosomal protein with classical late-infantile neuronal ceroid lipofuscinosis. Science. 1997;277:1802–1805. doi: 10.1126/SCIENCE.277.5333.1802. - DOI - PubMed
    1. Rawlings N.D., Barrett A.J. Tripeptidyl-peptidase I is apparently the CLN2 protein absent in classical late-infantile neuronal ceroid lipofuscinosis. Biochim. Biophys. Acta. 1999;1429:496–500. doi: 10.1016/S0167-4838(98)00238-6. - DOI - PubMed
    1. Palmer D.N., Martinus R.D., Cooper S.M., Midwinter G.G., Reid J.C., Jolly R.D. Ovine ceroid lipofuscinosis. The major lipopigment protein and the lipid-binding subunit of mitochondrial ATP synthase have the same NH2-terminal sequence. J. Biol. Chem. 1989;264:5736–5740. - PubMed
    1. Palmer D.N., Fearnley I.M., Medd S.M., Walker J.E., Martinus R.D., Bayliss S.L., Hall N.A., Lake B.D., Wolfe L.S., Jolly R.D. Lysosomal storage of the DCCD reactive proteolipid subunit of mitochondrial ATP synthase in human and ovine ceroid lipofuscinoses. Adv. Exp. Med. Biol. 1989;266:211–223. doi: 10.1007/978-1-4899-5339-1_15. - DOI - PubMed
    1. Ezaki J., Takeda-Ezaki M., Kominami E. Tripeptidyl peptidase I, the late infantile neuronal ceroid lipofuscinosis gene product, initiates the lysosomal degradation of subunit c of ATP synthase. J. Biochem. 2000;128:509–516. doi: 10.1093/oxfordjournals.jbchem.a022781. - DOI - PubMed

MeSH terms

Supplementary concepts