Clinical Trial
. 2025 Aug 19;6(8):102247.
doi: 10.1016/j.xcrm.2025.102247. Epub 2025 Jul 23.

IgA2+ B cells and IgA2 anti-dsDNA antibodies are selectively targeted by belimumab after rituximab therapy in systemic lupus erythematosus

Affiliations
Clinical Trial

IgA2+ B cells and IgA2 anti-dsDNA antibodies are selectively targeted by belimumab after rituximab therapy in systemic lupus erythematosus

Daniel McCluskey et al. Cell Rep Med. .

Abstract

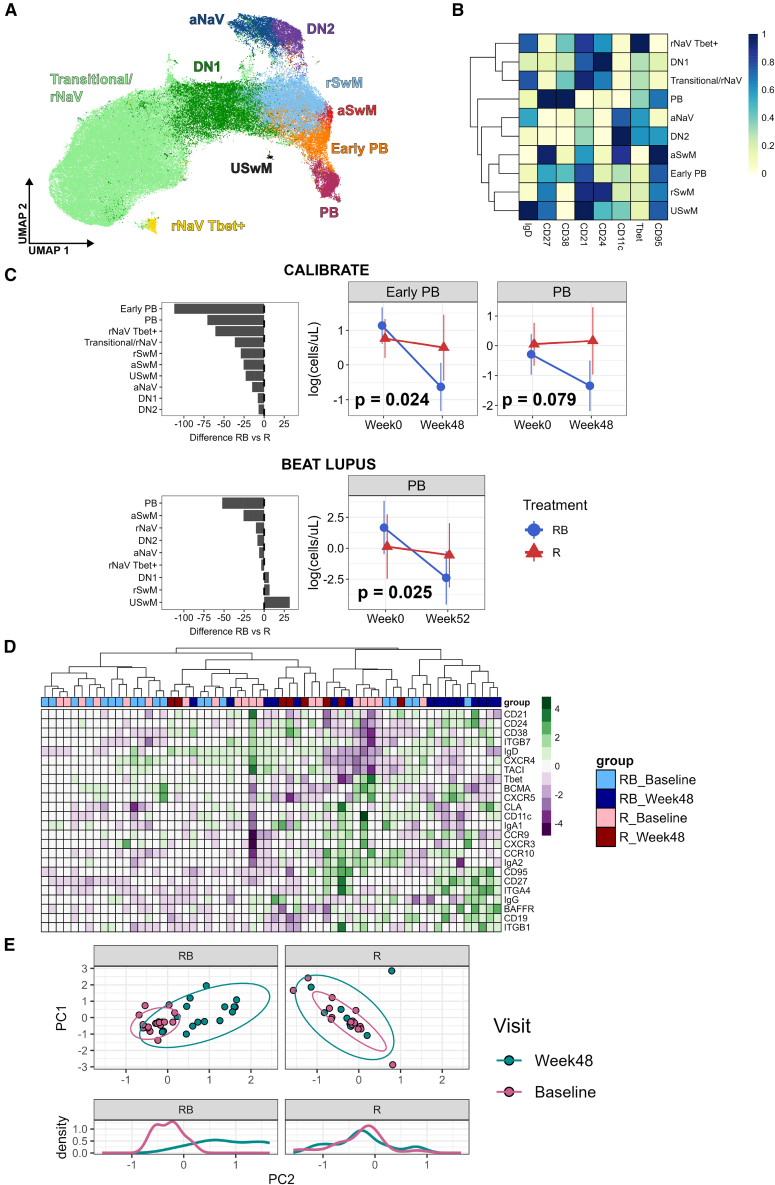
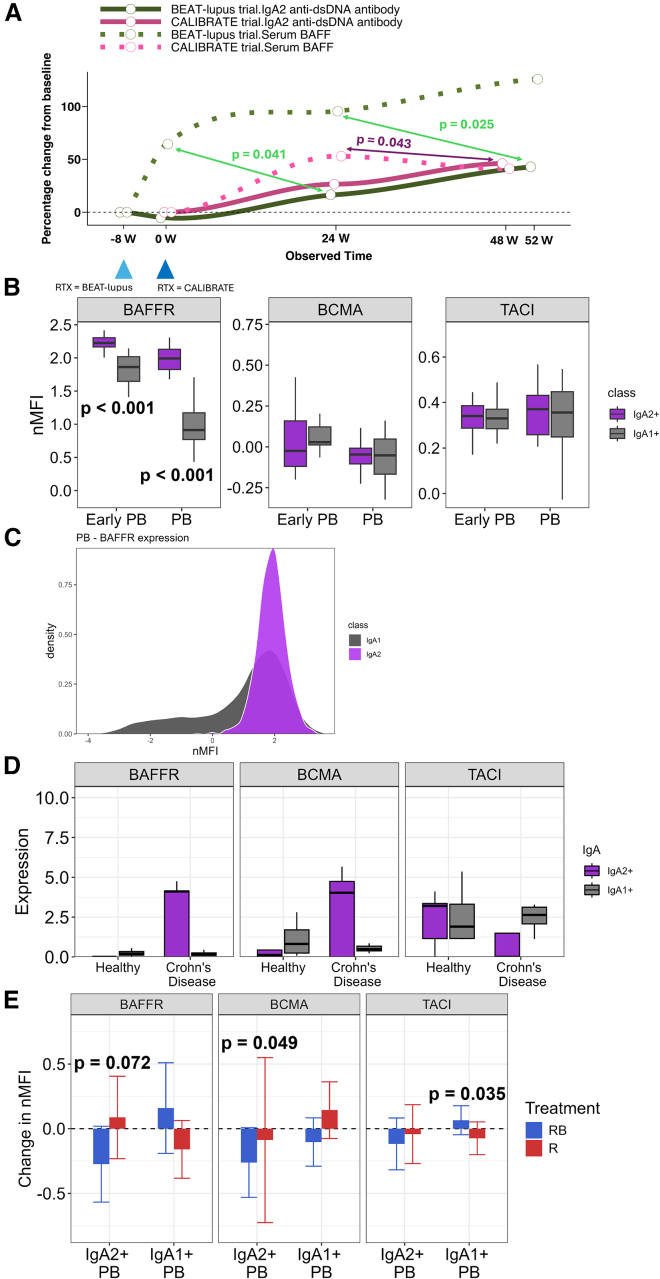
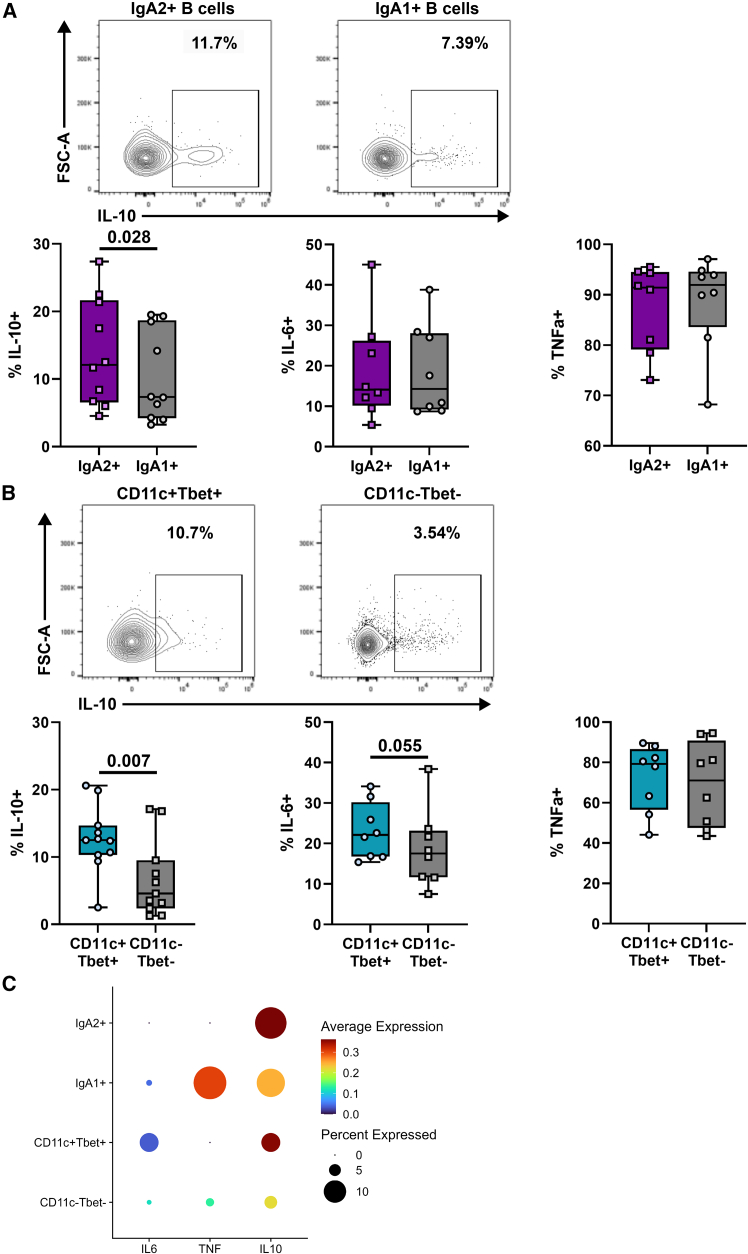
No theragnostic biomarkers exist for systemic lupus erythematosus (SLE) to enable a precision medicine approach. Baseline serum IgA2 anti-double-stranded DNA (dsDNA) antibody levels are associated with response to combination belimumab after rituximab therapy in SLE (BEAT-lupus trial, ISRCTN 47873003). Analysis of the CALIBRATE trial (NCT02260934) confirms that baseline IgA2 anti-dsDNA antibody levels are specifically associated with response to belimumab after rituximab (odds ratio [OR] = 16.9, confidence interval [CI]: 2.8-101, compared to rituximab alone-CALIBRATE and BEAT-lupus combined data). IgA2 anti-dsDNA antibody levels decrease alongside IgA2 expression in plasmablasts only after this combination treatment. Increased serum B cell-activating factor (BAFF) levels are associated with rising IgA2 anti-dsDNA antibody levels after rituximab. IgA2 plasmablasts have increased BAFF receptor and interleukin (IL)-10 expression compared to IgA1 plasmablasts and have a distinct integrin profile implicating a gut mucosal origin. These findings validate IgA2 anti-dsDNA antibodies as a theragnostic biomarker of response and provide mechanistic insight into the selective targeting of IgA2+ B cells by combination belimumab after rituximab in SLE.

Keywords: BAFF; CD11c(+)Tbet(+) age-related B cells; IgA2 anti-dsDNA antibodies; SLE; belimumab; rituximab; theragnostic biomarker.


Conflict of interest statement

Declaration of interests M.R.E. has received grant/research support from GSK. M.R.E. and J.A.J. have received consultancy fees for attending GSK advisory boards. M.R.A.S. and M.R.E. are named on patent application no. 18/864,514 (IgA2 anti-dsDNA antibodies as a biomarker in SLE, the patent is to University College London).

Figures

None
Graphical abstract
Figure 1
Figure 1
Clustering analysis of B cells (A) UMAP of clustered CD3CD19+ B cells with canonical subsets labeled (CALIBRATE trial, n = 38). aNaV, activated naive; aSwM, activated switched memory; rSwM, resting switched memory; DN, double-negative; PBs, plasmablasts; rNaV, resting naive; USwM, unswitched memory. (B) Heatmap of key marker expression across each labeled cluster. (C) Left: difference in the percentage change of absolute number in each subset from baseline to week 48 (CALIBRATE, n = 38) and week 52 (BEAT-lupus, n = 35) between the two arms of the trials. Right: longitudinal measurement of log cells/μL in the plasmablast clusters. Mean plus 95% confidence intervals are shown. Linear mixed-effects model used to analyze difference between the two arms of the trial from baseline to week 48 (CALIBRATE) or week 52 (BEAT-lupus). (D) Heatmap of scaled median expression of each marker included in the flow cytometry panel from each sample (CALIBRATE). Top row is color-coded by treatment and visit. (E) Principal component analysis of patients at baseline and week 48 in each treatment arm (CALIBRATE). Bottom panel displays density histogram of PC2. RB, belimumab after rituximab; R, rituximab. Only p values < 0.1 are shown. See also Figure S1.
Figure 2
Figure 2
Serum IgA2 and IgA1 anti-dsDNA antibody levels and IgA2 and IgA1 expression in terminally differentiated B cell clusters (A) Serum IgA2 and IgA1 anti-dsDNA antibody levels at baseline and week 48 stratified by treatment (CALIBRATE trial). Mean plus 95% confidence intervals are shown. Dotted line represents upper limit of normal (mean +3SD), n = 37. Values are the mean of two technical replicates. p value comparing the difference at week 48 between the two arms of the trial adjusting for baseline values. Linear mixed-effects model used for analysis. (B) Baseline serum IgA2 anti-dsDNA antibody levels were categorized into high (≥12.5 AU) or low (<12.5 AU) levels and used as an effect modifier to predict clinical response at 48 (CALIBRATE) and 52 (BEAT-lupus) weeks in the two arms of the trials. The top panel combines patients from both BEAT-lupus and CALIBRATE, while the bottom panel only shows patients from the CALIBRATE trial. OR, odds ratio. (C) UMAP with three pseudotime trajectories overlaid (CALIBRATE). The rNaV/transitional cluster is the origin point for the trajectories. (D) UMAP of IgA2+ and IgA1+ B cells with kernel density overlaid. (E) Change in nMFI (expression) of IgA2 and IgA1 at week 48 compared to baseline in the terminally differentiated B cell clusters categorized according to treatment (CALIBRATE, n = 38). Mean plus 95% confidence intervals are shown. Linear mixed model used for all comparisons. RB, belimumab after rituximab; R, rituximab; nMFI, normalized mean fluorescence intensity. Only p values <0.1 are shown. See also Figures S2 and S3.
Figure 3
Figure 3
Baseline and longitudinal analysis of BAFF receptors in IgA2 compared to IgA1 plasmablasts (A) Longitudinal percentage change in serum IgA2 anti-dsDNA antibodies and BAFF levels from screening to 52 weeks in the rituximab-alone arm from both the BEAT-lupus and CALIBRATE trials (n = 41). The lines were smoothed using a locally estimated scatterplot smoothing (LOESS) method. A time-lagged longitudinal linear mixed-effects model was fitted, accounting for clustering by patients with random patient effects, and fixed effects of serum BAFF intersecting with trial times. Two infusions of rituximab were administered at weeks 0 and 2 (CALIBRATE) and between 4 and 8 weeks before week 0 (BEAT-lupus). The baseline samples were taken before the rituximab infusions. (B) Expression of BAFFR, BCMA, and TACI in IgA2 and IgA1 plasmablasts (cross-sectional lupus cohort, n = 10). Mean plus 95% confidence intervals are shown. Mann-Whitney test. (C) Histogram of BAFFR expression in IgA2 and IgA1 plasmablasts (cross-sectional lupus cohort). (D) Expression of BAFFR, BCMA, and TACI in IgA2 and IgA1 plasma cells in healthy and Crohn’s disease gut tissue from publicly available single-cell RNA sequencing data, n = 4 healthy controls and n = 5 Crohn’s. Mean plus 95% confidence intervals are shown. (E) Change in expression of BAFFR, BCMA, and TACI at week 48 compared to baseline in the CALIBRATE trial between IgA2 and IgA1 plasmablasts, n = 38. Mean plus 95% confidence intervals are shown. Linear mixed-effects model used for analysis. RB, belimumab after rituximab; R, rituximab. Only p values <0.1 are shown. See also Figure S4.
Figure 4
Figure 4
Chemokine and integrin receptor expression in IgA2 and IgA1 plasmablasts (A) Baseline nMFI of integrin expression comparing IgA2+ vs. IgA1+ cells in memory B cell and plasmablast clusters (CALIBRATE). Mean plus 95% confidence intervals are shown. Two-way ANOVA followed by Tukey HSD was used to compare integrin expression between IgA2 and IgA1 B cells. (B) Histogram of ITGB7 expression in IgA2+ and IgA1+ early plasmablasts. (C) Change in nMFI of integrin and chemokine receptors in IgA2+ and IgA1+ early plasmablasts from baseline to week 48. Linear mixed model comparing the difference in the two arms of the trial at week 48 compared to baseline. Mean plus 95% confidence intervals are shown. (D) Change in percentage of ITGB7+ or ITGB1+ in IgA2+ and IgA1+ early plasmablasts. Mean plus 95% confidence intervals are shown. Linear mixed model used to analyze difference between the two arms at 48 weeks compared to baseline (CALIBRATE). (E) Scatterplot with overlaid kernel density of ITGB7 expression, within IgA2+ early plasmablasts, at baseline and week 48, in both treatment arms (CALIBRATE). Black box highlights the proportion of ITGB7+ cells within the IgA2+ compartment. RB, belimumab after rituximab; R, rituximab. n = 38. Only p values <0.1 are shown. See also Figure S4.
Figure 5
Figure 5
CD11c+Tbet+ B cells are targeted by belimumab after rituximab (A) Percentage of CD11c+Tbet+ B cells in activated naive (aNaV) and double-negative 2 (DN2) B cells at baseline and week 48. Mean plus 95% confidence intervals are shown. Linear mixed-effect model was used to compare values at week 48 (CALIBRATE, n = 38) and week 52 (BEAT-lupus, n = 35) adjusting for baseline values. (B) Expression of BAFFR, BCMA, and TACI in CD11c+Tbet+ compared to CD11cTbet cells in an independent cross-sectional cohort, n = 10. Mean plus 95% confidence intervals are shown. (C) Histogram of BAFFR expression in CD11c+Tbet+ and CD11cTbet DN2 cells. RB, belimumab after rituximab; R, rituximab. Only p values <0.1 are shown. See also Figure S4.
Figure 6
Figure 6
IgA2 and CD11c+Tbet+ B cell cytokine production in patients with SLE (A and B) Summary boxplots of IL-10, IL-6, and TNF-α expressing (A) IgA2 vs. IgA1 and (B) CD11c+TBet+ vs. CD11cTBet B cells stimulated with CpG for 48 h. Representative fluorescence-activated cell sorting plots of IL-10 expression are shown. Mann-Whitney was used for analysis. n = 9. Mean plus 95% confidence intervals are shown for (A) and (B). (C) Expression and percent positivity of IL-6, TNF, and IL-10 genes in IgA2+, IgA1+, CD11c+Tbet+, and CD11cTbet B cells from a publicly available single-cell RNA sequencing dataset derived from purified human B cells stimulated with CpG. Only p values <0.1 are shown.

References

    1. Atisha-Fregoso Y., Toz B., Diamond B. Meant to B: B cells as a therapeutic target in systemic lupus erythematosus. J. Clin. Investig. 2021;131 doi: 10.1172/jci149095. - DOI - PMC - PubMed
    1. Merrill J.T., Neuwelt C.M., Wallace D.J., Shanahan J.C., Latinis K.M., Oates J.C., Utset T.O., Gordon C., Isenberg D.A., Hsieh H.J., et al. Efficacy and safety of rituximab in moderately-to-severely active systemic lupus erythematosus: the randomized, double-blind, phase II/III systemic lupus erythematosus evaluation of rituximab trial. Arthritis Rheum. 2010;62:222–233. - PMC - PubMed
    1. Rovin B.H., Furie R., Latinis K., Looney R.J., Fervenza F.C., Sanchez-Guerrero J., Maciuca R., Zhang D., Garg J.P., Brunetta P., et al. Efficacy and safety of rituximab in patients with active proliferative lupus nephritis: the Lupus Nephritis Assessment with Rituximab study. Arthritis Rheum. 2012;64:1215–1226. - PubMed
    1. Carter L.M., Isenberg D.A., Ehrenstein M.R. Elevated Serum BAFF Levels Are Associated With Rising Anti–Double-Stranded DNA Antibody Levels and Disease Flare Following B Cell Depletion Therapy in Systemic Lupus Erythematosus. Arthritis Rheum. 2013;65:2672–2679. doi: 10.1002/art.38074. - DOI - PubMed
    1. Vincent F.B., Morand E.F., Schneider P., Mackay F. The BAFF/APRIL system in SLE pathogenesis. Nat. Rev. Rheumatol. 2014;10:365–373. doi: 10.1038/nrrheum.2014.33. - DOI - PubMed

Publication types

MeSH terms