. 2025 Jul 24;16(1):6747.
doi: 10.1038/s41467-025-61645-w.

A draft UAE-based Arab pangenome reference

Affiliations

A draft UAE-based Arab pangenome reference

Nasna Nassir et al. Nat Commun. .

Abstract

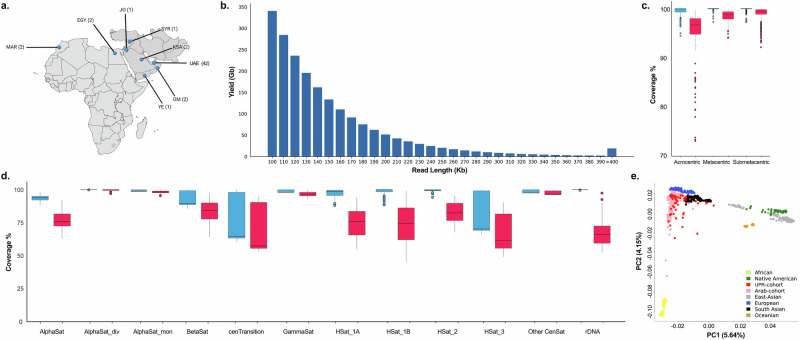
Pangenomes provide a robust and comprehensive portrayal of genetic diversity in humans, but Arab populations remain underrepresented. We present a preliminary UAE-based Arab Pangenome Reference (UPR) utilizing 53 individuals of diverse Arab ethnicities residing in the United Arab Emirates. We assembled nuclear and mitochondrial pangenomes using 35.27X high-fidelity long reads, 54.22X ultralong reads and 65.46X Hi-C reads. This approach yielded contiguous haplotype-phased de novo assemblies of exceptional quality, with an average N50 of 124.28 Mb. We discovered 111.96 million base pairs of previously uncharacterized euchromatic sequences absent from existing human pangenomes, the T2T-CHM13 and GRCh38 reference human genomes, and other public datasets. Moreover, we identified 8.94 million population-specific small variants and 235,195 structural variants within the Arab pangenome, not present in linear and pangenome references and public datasets. We detected 883 gene duplications, including the TATA-binding protein gene TAF11L5, which was uniquely duplicated across all Arab populations and that included 15.06% of genes associated with recessive diseases. By exploring the mitochondrial pangenome, we identified 1,436 bp of previously unreported sequences. Our study provides a valuable resource for future genetic research and genomic medicine initiatives in Arab population and other population with similar genetic backgrounds.


Conflict of interest statement

Competing interests: The authors declare no competing interests.

Figures

Fig. 1
Fig. 1. Cohort characterization and sequencing quality.
a Geographic diversity of sample collection. A map highlighting the distribution of sample collection sites. Each point marks the geographical location of cohorts involved in the study, illustrating the broad recruitment strategy employed to capture genetic diversity. n = 53 individuals. Panel created in BioRender. Jamalalail, B. (2025) https://BioRender.com/ gyyr5q3. b Ultra-long read yield from Oxford Nanopore Technologies (ONT) sequencing. Histogram showing the yield of ultra-long reads (>100 kb) generated by ONT sequencing. The x-axis shows the reads based on length intervals, while the y-axis indicates the total yield per bin. n = 53 individuals. c Chromosome mapping distribution of sequencing reads. Boxplot presenting the distribution of ONT and Pacific Biosciences (PacBio) reads that align to acrocentric, metacentric, and submetacentric chromosomes. Neon pink and teal blue bars represent PacBio and ONT data respectively. Box plots show the 25th and 75th percentiles (interquartile range, IQR), center line indicates the median, and whiskers extend to the minimum and maximum values. Individual data points are overlaid. n = 53 individuals. d Boxplot illustrating the coverage of subtelomeric and pericentric regions by both ONT and PacBio reads. Box plots show the 25th and 75th percentiles (interquartile range, IQR), center line indicates the median, and whiskers extend to the minimum and maximum values. Individual data points are overlaid. n = 53 individuals. e Population structure via Principal Component Analysis (PCA). Two-dimensional scatter plot derived from PCA, visualizing the genetic variance among different ethnicities. Samples from Human Genome Diversity Project (HGDP) and Human Origins database are color coded by ethnicity, with UPR highlighted in red. n = 53 UPR individuals, and n = 1,040 Human Origins individuals, including n = 304 Arabs. The two axes represent the percentage variance explained by PCA1 and PCA2. Source data are provided as a Source Data file.
Fig. 2
Fig. 2. Quality assessment of 53 phased diploid assemblies and gene duplication analysis.
a Assembly contiguity. A line plot showing contig length plotted against cumulative assembly coverage, with reference contiguities for both CHM13 and GRCh38 genomes included for comparison. n = 53 individuals. b Assembly accuracy and completeness. A plot illustrating the mapping rate versus consensus accuracy (Quality value, QV), offering insights into the completeness and accuracy of the assemblies. n = 53 individuals. c Genome fraction. Scatter plot showing the fraction of the genome covered by the assemblies compared to benchmark references CHM13 and GRCh38. n = 53 individuals. d Unaligned length. A scatter plot comparing the unaligned length of the assemblies relative to the CHM13 and GRCh38 references. n = 53 individuals. e Flagger analysis. Bar plot illustrating the reliability of 53 UPR assemblies using read mapping. The plot differentiates between paternal and maternal haplotypes, with regions flagged as reliable (blue) representing the majority of each assembly. The y-axis is broken to emphasize the dominant reliable haploid component and the stratification of the unreliable blocks. f Gene and transcript annotation. Scatter plot showing the percentages of protein-coding and noncoding genes, as well as transcripts annotated from the reference set in each of the assemblies. n = 53 individuals. g Gene duplication per assembly. Histogram showing the number of unique duplicated gene families in each phased assembly in comparison to the number of duplicated genes annotated in GRCh38. n = 53 individuals. h Comparative duplicated gene analysis. Venn diagram visualizing the overlap and unique counts of duplicated genes across UAE-based Arab Pangenome Reference (UPR), Human Pangenome Reference Consortium (HPRC), and Chinese Pangenome Consortium (CPC) assemblies. n = 106 UPR, 88 HPRC, 116 CPC assemblies. i Arab-HPRC duplicated gene overlap. Bar graph showcasing five overlapped duplicated genes with a higher frequency ( ≥5%) in Arab assemblies (blue) compared to HPRC (orange). n = 106 UPR, 94 HPRC assemblies. j Arab-CPC duplicated gene overlap. Bar chart illustrating five overlapped duplicated genes with a significantly higher frequency (≥5%) in Arab assemblies (blue) in contrast to CPC (yellow). n = 106 UPR, 116 CPC assemblies. k Bar graphs indicating the count of UPR unique duplicated genes across chromosome types: acrocentric, metacentric, and submetacentric. l Bar graph showing the count of UPR unique duplicated genes dispersed across all individual chromosomes, highlighting regions of enrichment. m Gene duplication in microsatellite region. Bar graph depicting the count of UPR unique duplicated genes located in microsatellite regions. Source data are provided as a Source Data file.
Fig. 3
Fig. 3. Arab genome specific sequences.
a Bar graph demonstrating the total number of small variants across 53 individuals, distinguishing between singleton (light blue) and polymorphic (dark blue) variants. b Bar graph showcasing the number of UPR-specific small variants for each individual, further differentiating between singleton and polymorphic variants. n = 53 individuals. c Venn diagram comparing the small variants from UPR to those in Human Pangenome Reference Consortium (HPRC), the Chinese Pangenome Consortium (CPC), CHM13, and GRCh38 assemblies. n = 53 UPR, 47 HPRC, 58 CPC individuals. d Stacked bar graph detailing the total structural variants (SVs) per sample, categorizing between singleton and polymorphic variants for both insertions and deletions. n = 53 individuals. e Stacked bar graph illustrating the SVs that are UPR-specific for each sample, for both insertions and deletions. n = 53 individuals. f Venn diagram visualizing the overlap and differences in SVs from UPR with HPRC and CPC datasets, CHM13, GRCh38, 1000 G and DGV. n = 53 UPR, 47 HPRC, 58 CPC individuals. g Visualization of Arab-specific SVs from the pangenome graph across autosomes. Sites of complex SVs are marked with blue. n = 53 individuals. h Pangenome growth curve for UPR graph. Core represents (≥95%), common (≥5%), and singleton (only one haplotype). n = 53. i Bar graph displaying the length distribution of additional identified sequences for each sample, offering insights into the diversity of unreported sequence lengths. n = 53 individuals. Source data are provided as a Source Data file.
Fig. 4
Fig. 4. Visualizing complex structural variation region.
a Preferentially Expressed Antigen in Melanoma Family (PRAMEF) region subgraph. Diagram showcasing the specific location of the PRAMEF genes. b Sample haplotypes in PRAMEF Region. Distinct paths taken by different samples through the PRAMEF region. c PRAMEF region haplotype count. Linear structural diagrams representing the frequency and structural visualization of haplotypes identified by the graph across 106 haplotype assemblies, compared against the Human Pangenome Reference Consortium (HPRC)-the Chinese Pangenome Consortium (CPC) graph. d POLR2J3 - SPDYE2 region subgraph. Diagram highlighting the specific location of the POLR2J3 - SPDYE2 region. e Sample haplotypes in POLR2J3 - SPDYE2 region. Unique paths traversed by different samples through the POLR2J3 - SPDYE2 region. f POLR2J3 - SPDYE2 region haplotype count. Linear structural diagrams depicting the frequency and structural visualization of haplotypes as determined by the graph among 106 haplotype assemblies, compared with the HPRC-CPC graph for a comprehensive comparison. Variation among haplotype walks that did not involve genes was visualized using color coded lines, from red to blue to indicate directions. n = 53 UPR, 47 HPRC, 58 CPC individuals. Source data are provided as a Source Data file.
Fig. 5
Fig. 5. Mitochondrial pangenome analysis and nuclear pangenome performance gain.
a A circular representation of the mitochondrial pangenome, detailing the position and nomenclature of annotated mitochondrial genes within the pangenome. Each bubble or loop represents a haplotype. b Mitochondrial UAE-based Arab Pangenome Reference (mtUPR)variant landscape. A bar chart showcasing the number of UPR-specific small variants observed across different samples in comparison to Human Pangenome Reference Consortium (HPRC), differentiated between polymorphism (dark blue) and singleton (light blue). n = 53 individuals. c Comparative analysis of variant calling performance using linear, assembly and pangenome methods. Violin plot displaying the recall of linear variant calls using assembly-based and pangenome-based methods. n = 10 UPR individuals. d Bar graph illustrating the proportion of errors in Single Nucleotide Polymorphism (SNP) and Insertion and Deletion (Indel) variant calls using three different methods: assembly (red), linear (green), and pangenome (blue). e Mapping accuracy assessment. Box plot illustrating the percentage of properly paired reads in alignments of 9 short read whole genome sequenced Arab samples (from UAE, Saudi, Syria, and Oman) to the UPR and HPRC genomic graphs, compared to the CHM13 reference. Box plots show the 25th and 75th percentiles (interquartile range), center line represents the median, whiskers extend to the minimum and maximum values, and individual data points are overlaid. f Genotyping recall for SNPs. Box plot depicting the recall rates for genotyping of polymorphic variants in easy genomic region based on CHM13 variant calls. Easy genomic regions are defined as parts of the genome excluding segmental duplications, centromeric/satellite sequences, composite repeats, satellites, chrXY sequence classes, telomeres, and palindromes/inverted repeats. n = 9 Arab individuals. g Structural variants across samples in easy genomic regions. Line graph comparing the count of structural variants identified across Arab samples mapped to the UPR and HPRC graphs. h Line graph depicting the frequency of SV lengths across Arab samples mapped to UPR and HPRC graphs. n = 53 UPR, 47 HPRC individuals. Source data are provided as a Source Data file.

References

    1. Wang, T. et al. The Human Pangenome Project: a global resource to map genomic diversity. Nature604, 437–446 (2022). - PMC - PubMed
    1. 1000 Genomes Project Consortium et al. A global reference for human genetic variation. Nature526, 68–74 (2015). - PMC - PubMed
    1. Bergström, A. et al. Insights into human genetic variation and population history from 929 diverse genomes. Science367, eaay5012 (2020). - PMC - PubMed
    1. Nurk, S. et al. The complete sequence of a human genome. Science376, 44–53 (2022). - PMC - PubMed
    1. Rhie, A. et al. The complete sequence of a human Y chromosome. Nature621, 344–354 (2023). - PMC - PubMed

LinkOut - more resources