. 2025 Jul 24;16(1):6836.
doi: 10.1038/s41467-025-62154-6.

The A-C linker controls centriole structural integrity and duplication

Affiliations

The A-C linker controls centriole structural integrity and duplication

Lorène Bournonville et al. Nat Commun. .

Abstract

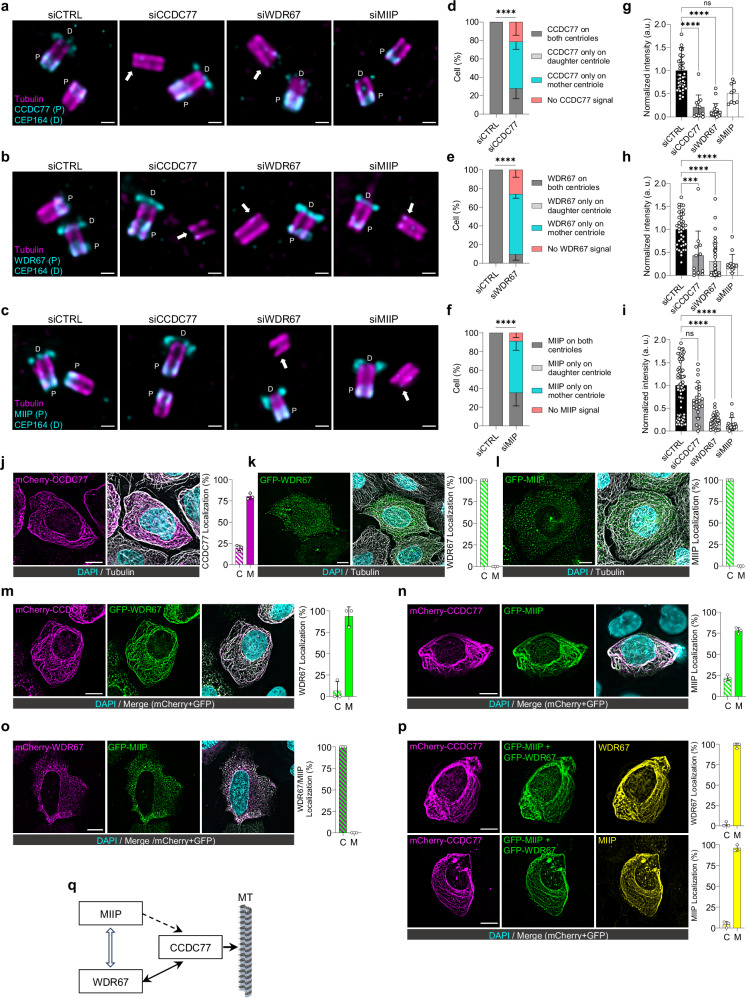
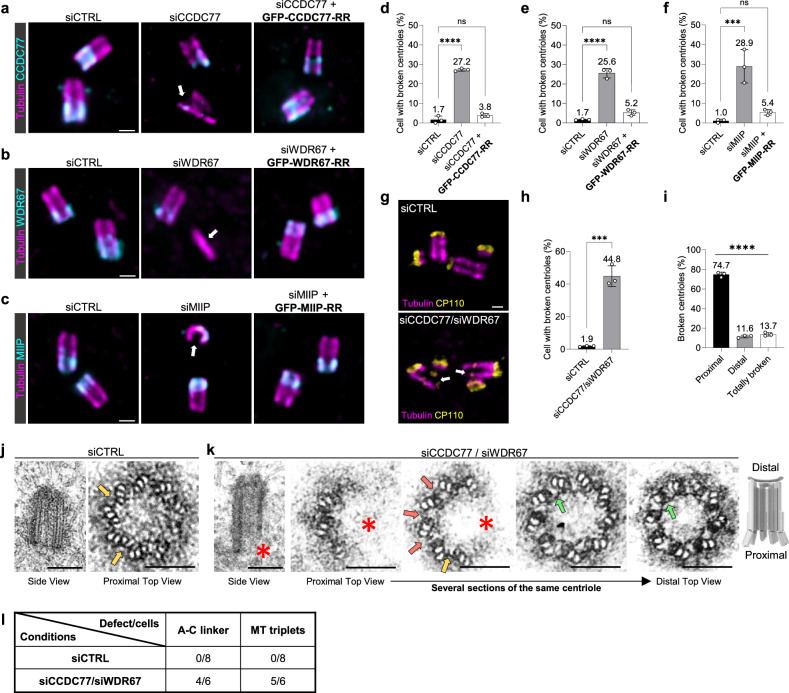
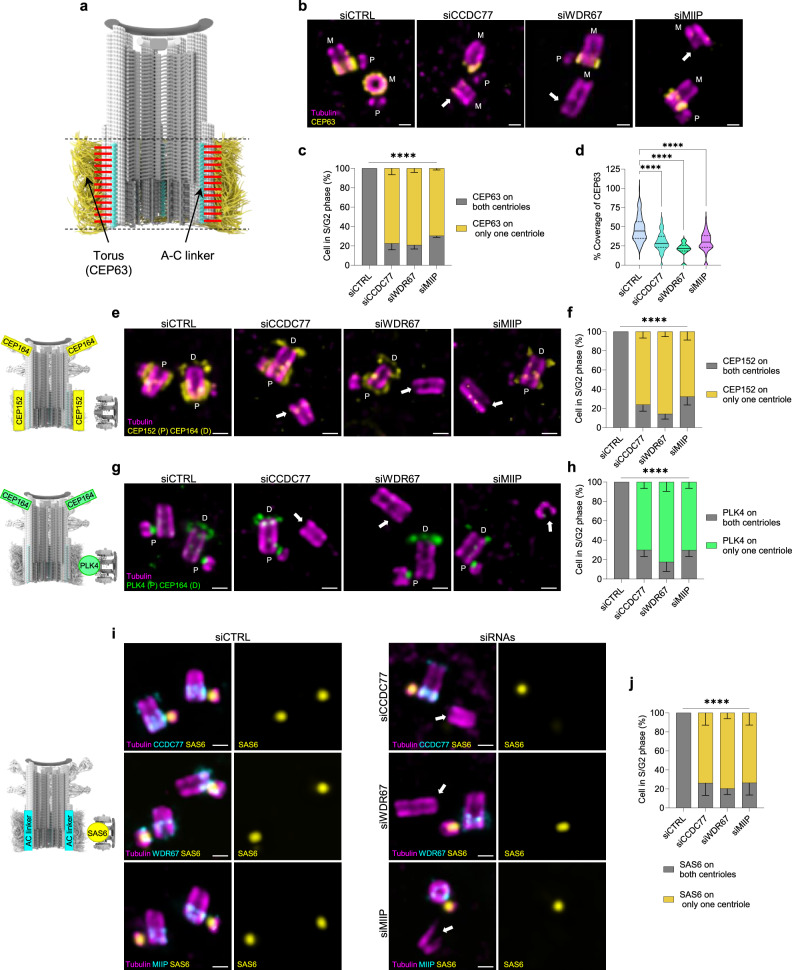
Centrioles are evolutionarily conserved barrel-shaped organelles playing crucial roles in cell division and ciliogenesis. These functions are underpinned by specific structural sub-elements whose functions have been under investigation since many years. The A-C linker structure, connecting adjacent microtubule triplets in the proximal region, has remained unexplored due to its unknown composition. Here, using ultrastructure expansion microscopy, we characterized two recently identified A-C linker proteins, CCDC77 and WDR67, and discovered MIIP as an additional A-C linker protein. Our findings reveal that these proteins localize between microtubule triplets at the A-C linker, forming a complex. Depletion of A-C linker components disrupt microtubule triplet cohesion, leading to breakage at the proximal end. Co-removal of the A-C linker and the inner scaffold demonstrates their joint role in maintaining centriole architecture. Moreover, we uncover an unexpected function of the A-C linker in centriole duplication through torus regulation, underscoring the interplay between these protein modules.


Conflict of interest statement

Competing interests: The authors declare no competing interests.

Figures

Fig. 1
Fig. 1. MIIP as an A-C linker protein.
a Common DepMap genes among the top 100 genes most correlated (Pearson) with WDR67 and CCDC77 (https://depmap.org/portal/). U2OS cells in interphase (b, n = 3) or mitosis (c, n = 3) stained for DNA (DAPI, grey), Centrin (magenta), and MIIP (cyan). Scale bars = 5 μm. Dashed line squares correspond to insets. Confocal images of expanded U2OS centrioles in longitudinal view stained for α/β-tubulin (magenta) and MIIP (cyan, N = 150, n = 7) (d), WDR67 (cyan, N = 136, n = 8) (e) or CCDC77 (cyan, N = 116, n = 6) (f). Scale bars = 100 nm. Average longitudinal and radial localization of MIIP (d), WDR67 (e), or CCDC77 (f) is shown on the right. g Radial positions of proteins relative to tubulin. For MIIP, N = 74, n = 4; for WDR67, N = 32, n = 3; for CCDC77, N = 89, n = 4. h Confocal images of expanded U2OS procentrioles during assembly in longitudinal view, stained for α/β tubulin (magenta) and MIIP (cyan). Scale bar = 100 nm. i Centriole length, with (+ MIIP, N = 27, n = 2) or without (− MIIP, N = 21, n = 2) MIIP. Cyan line: average tubulin length when MIIP appears (≈115 nm). j Confocal images of expanded U2OS centrioles (top view) stained for α/β tubulin (magenta) and MIIP (cyan), n = 3. Scale bar = 100 nm. The fluorescence intensity profile along two successive MTTs demonstrates the precise position of MIIP (bottom part). SDs as dashed lines. Yellow arrow: measurement axis. k Huygens deconvolution of expanded U2OS centrioles using iU-ExM from top view stained for α/β tubulin (magenta) and MIIP (cyan – top panel), WDR67 (cyan – middle panel) or CCDC77 (cyan – bottom panel). Scale bars = 100 nm. Fluorescence intensity profile of each protein (cyan) through the walls (tubulin signal) of an entire centriole using the plugin “Polar Transform” from Fiji, n = 3. l Human centriole model in top view centered on the A-C linker (cyan), showing CCDC77, WDR67, and MIIP localization. Dots show samples, and bars represent mean ± SD. N: number of centrioles, n: number of independent experiments. Source data for this figure are provided as a Source Data file.
Fig. 2
Fig. 2. Co-dependency of CCDC77, WDR67 and MIIP.
Expanded centrioles in longitudinal view treated with siCTRL, siCCDC77, siWDR67, and siMIIP stained for α/β tubulin (magenta) and CCDC77 + CEP164 (a, cyan), WDR67 + CEP164 (b, cyan), or MIIP + CEP164 (c, cyan). CEP164 marks the mother centriole. P = proximal, D = distal. White arrow: signal depletion under each siRNA condition. Scale bars = 200 nm. Percentage of cells with CCDC77 (d, siCTRL, N = 150, n = 4; siCCDC77, N = 138, n = 4), WDR67 (e, siCTRL, N = 212, n = 5; siWDR67, N = 216, n = 5), or MIIP (f, siCTRL, N = 159, n = 4; siMIIP, N = 99, n = 4) signal on both mature centrioles (dark grey), only on daughter centriole (light grey), only on mother centriole (cyan), or absent (red) in the indicated siRNA. Two-way ANOVA, two-sided. Normalized relative intensity of CCDC77 (g, siCTRL, N = 48, n = 3; siCCDC77, N = 12, n = 3; siWDR67, N = 21, n = 3; siMIIP, N = 9, n = 3), WDR67 (h, siCTRL, N = 40, n = 3; siCCDC77, N = 12, n = 3; siWDR67, N = 39, n = 3; siMIIP, N = 14, n = 3) or MIIP (i, siCTRL, N = 72, n = 3; siCCDC77, N = 23, n = 3; siWDR67, N = 32, n = 3; siMIIP, N = 18, n = 3) in the different siRNA conditions in expanded daughter centrioles. Non-parametric Kruskal-Wallis test. U2OS cells expressing mCherry-CCDC77 (j, N = 131, n = 3), GFP-WDR67 (k, N = 148, n = 3), or GFP-MIIP (l, N = 218, n = 3) were stained for DAPI (cyan) and α/β tubulin (white). Scale bars = 10 μm. Percentage of cells showing CCDC77 (j), WDR67 (k), or MIIP (l) within the cytoplasm (C) or associated with microtubules (M). U2OS cells co-expressing mCherry-CCDC77 (magenta) with GFP-WDR67 (green) (m, N = 108, n = 3), mCherry-CCDC77 (magenta) with GFP-MIIP (green) (n, N = 127, n = 3), mCherry-WDR67 (magenta) with MIIP-GFP (green) (o, N = 227, n = 3) stained for DAPI (cyan). Scale bars = 10 μm. Percentage of cells showing WDR67 (m), MIIP (n), or both (o) within the cytoplasm (C) or associated with microtubules (M). p U2OS cells co-expressing mCherry-CCDC77 (magenta) with GFP-WDR67 (green) and GFP-MIIP (green) stained for DAPI (cyan) and WDR67 (yellow, top part, N = 81, n = 3), or MIIP (yellow, bottom part, N = 75, n = 3). Scale bars = 10 μm. Percentage of cells showing WDR67 (top part), or MIIP (bottom part) within cytoplasm (C) or associated with microtubules (M) is presented next to the corresponding images. q Schematic view of the interactions between CCDC77, WDR67, and MIIP. MT stands for microtubule. Dots show samples or replicates, and bars represent mean ± SD. N: number of centrioles/cells, n: number of independent experiments. ***p < 0.001, ****p < 0.0001. Source data for this figure are provided as a Source Data file.
Fig. 3
Fig. 3. Depletion of A-C linker proteins leads to broken centrioles.
Expanded centrioles from cells stably expressing GFP alone or RNAi resistant GFP-CCDC77-RR (a), GFP-WDR67-RR (b), or GFP-MIIP-RR (c), stained for α/β tubulin (magenta) and the protein of interest (cyan) in different siRNA conditions. White arrows: broken centrioles. Scale bars = 200 nm. Percentage of cells with broken centrioles in the indicated siRNA conditions, (d, siCTRL, N = 192, n = 3; siCCDC77, N = 143, n = 3; siCCDC77+GFP-CCDC77-RR, N = 102, n = 3), (e, siCTRL, N = 182, n = 3; siWDR67, N = 177, n = 3; siWDR67+GFP-WDR67-RR, N = 110, n = 3), (f, siCTRL, N = 163, n = 3; siMIIP, N = 150, n = 3; siMIIP+GFP-MIIP-RR, N = 164, n = 3). One-way ANOVA, two-sided (Dunn’s multiple comparison). g Confocal images of expanded U2OS cells treated with siCTRL or siCCDC77/siWDR67 and stained for α/β tubulin (magenta) or CP110 (yellow). White arrows: broken centriole at the proximal region. Scale bar = 200 nm. h Percentage of cells with broken centrioles in the indicated siRNA conditions, siCTRL, N = 213, n = 3; siCCDC77/siWDR67, N = 242, n = 3. Unpaired two-sided t-test. i Percentage of cells with broken centrioles in different centriolar regions (proximal breakage or deformation, distal breakage or deformation, or totally broken with only blades of microtubules or without any centriole shape), N = 103, n = 3. Unpaired two-sided t-test. j TEM images of U2OS daughter centrioles treated with siCTRL in longitudinal view (left part) or top view (right part), n = 2. Scale bar = 200 nm for side view, 100 nm for top view. Yellow arrow: intact A-C linker structure. k TEM images of a U2OS daughter centriole in longitudinal view (left part) or in top view from several sections of the same centriole across the proximal region to the distal region treated with siCCDC77/siWDR67, n = 2. Scale bars = 200 nm for side view or 100 nm for top view. Orange arrow: absence of the A-C linker structure; red asterisk: broken centriole or/and missing microtubule triplets; yellow arrow: intact A-C linker structure; green arrow: inner scaffold structure at the middle/distal region. Human centriole model on the right indicates proximal breakage. l Table of the quantification of the number of cells showing daughter centrioles with structural defects (A-C linker absent) or defects in microtubule (MT) triplets, siCTRL, N = 8, n = 2; siCCDC77/siWDR67, N = 6, n = 2. Dots show replicates, and bars represent mean ± SD. N: number of cells, n: number of independent experiments. ***p < 0.001, ****p < 0.0001. Source data for this figure are provided as a Source Data file.
Fig. 4
Fig. 4. CEP295 depletion leads to broken centrioles and impacts A-C linker proteins localization.
a Confocal images of expanded U2OS centrioles in top view (top part) and longitudinal view (bottom part) stained for α/β-tubulin (magenta) and CEP295 (cyan). Scale bars = 100 nm. Average longitudinal and radial localization are shown on the right with the coverage percentage, N = 23, n = 3. b Expanded centrioles in longitudinal view treated with siCTRL or siCEP295 stained for α/β tubulin (magenta) and CEP295 + CEP164 (cyan). P = proximal, D = distal. CEP164 marks the mother centriole. White arrow: fluorescent signal depletion of the protein of interest; white star: broken centriole. Scale bars = 200 nm. c Percentage of cells with CEP295 signal on both mature centrioles (dark grey), only on daughter centriole (light grey), only on mother centriole (cyan) or absent (red). siCTRL, N = 109, n = 3; siCEP295, N = 34, n = 3. Two-way ANOVA, two-sided. d Percentage of cells with broken centrioles. siCTRL, N = 109, n = 3; siCEP295, N = 124, n = 3. Unpaired two-sided t-test. e As in b, with CCDC77 + CEP164 staining (cyan). White arrows indicate CCDC77 signal deletion. Scale bars = 200 nm. f Percentage of cells of CCDC77 localization categories as in (c). siCTRL, N = 31, n = 3; siCEP295, N = 41, n = 3. Two-way ANOVA, two-sided. g, h As in e, f, with WDR67 + CEP164 staining (cyan). Scale bars = 200 nm. siCTRL, N = 32, n = 3; siCEP295, N = 52, n = 3. Two-way ANOVA, two-sided. i, j As in e, f, with MIIP + CEP164 staining (cyan). Scale bars = 200 nm. siCTRL, N = 31, n = 3; siCEP295, N = 50, n = 3. Two-way ANOVA, two-sided. k Expanded centrioles in longitudinal view treated with siCTRL, siCCDC77, siWDR67, or siMIIP stained for α/β tubulin (magenta) and CEP295 + CEP164 (cyan). CEP164 marks the mother centriole. P = proximal, D = distal. White arrows indicate CEP295 signal depletion. Scale bars = 200 nm. l Percentage of cells of CEP295 localization under each siRNA condition as in (c), siCTRL, N = 31, n = 2; siCCDC77, N = 24, n = 3; siWDR67, N = 41, n = 2; siMIIP, N = 36, n = 2. Two-way ANOVA- two-sided. Dots show replicates, and bars represent mean ± SD. N: number of cells, n: number of independent experiments. ****p < 0.0001. Source data for this figure are provided as a Source Data file.
Fig. 5
Fig. 5. Impact of A-C linker depletion on other centriolar elements.
a Expanded daughter centrioles in longitudinal view stained for α/β tubulin (magenta) and CEP135 (green), under indicated siRNAs, n = 3. Scale bars = 100 nm. b Normalized CEP135 intensity profiles along the proximal to the distal part of the centriole length (nm) in the siCTRL (black line), siCCDC77 (green line), siWDR67 (cyan line), and siMIIP (magenta line). SDs as dashed lines. Right part: model highlighting CEP135 localization domains, with signal: 1, corresponding to the distal dot localization; 2, corresponding to the proximal localization, and 3 corresponding to the sub-proximal localization. c Normalized relative intensity of CEP135 signal from 180 to 380 nm in length from the graph (b) in the different siRNA conditions in expanded centrioles. siCTRL, N = 13, n = 3; siCCDC77, N = 11, n = 3; siWDR67, N = 9, n = 3; siMIIP, N = 8, n = 3. Kruskal-Wallis test (Dunn’s multiple comparison). d Coverage of CEP135, expressed as a percentage of the tubulin length in the indicated siRNA conditions on daughter centrioles. One-way ANOVA, two-sided (Dunn’s multiple comparison), *p = 0.0239. e CEP135 length of daughter centrioles in the indicated siRNA conditions. d, e siCTRL, N = 89, n = 5; siCCDC77, N = 69, n = 3; siWDR67, N = 67, n = 4; siMIIP, N = 25, n = 3. Kruskal-Wallis test (Dunn’s multiple comparison), **p = 0.0095. f As in a, with CEP44 (green). Right part: model of CEP44 localization. Scale bars = 100 nm. g, h As is d, e, with CEP44. siCTRL, N = 67, n = 8; siCCDC77, N = 42, n = 5; siWDR67, N = 46, n = 5; siMIIP, N = 57, n = 4. Kruskal-Wallis test (Dunn’s multiple comparison). i As in a, with SPICE (cyan). Right part: model of SPICE localization. Scale bars = 100 nm. j, k As in d, e, with SPICE. siCTRL, N = 130, n = 7; siCCDC77, N = 100, n = 4; siWDR67, N = 42, n = 4; siMIIP, N = 40, n = 4. One-way ANOVA, two-sided (j), Kruskal-Wallis test (Dunn’s multiple comparison) (k), *p = 0.02. l As in a, with POC (green). Right part: model of POC5 localization. Scale bars = 100 nm. m, n As in d, e, with POC5. siCTRL, N = 67, n = 6; siCCDC77, N = 31, n = 3; siWDR67, N = 36, n = 5; siMIIP, N = 37, n = 3. One-way ANOVA, two-sided (m, *p = 0.0192, **p = 0.002), Kruskal-Wallis test (Dunn’s multiple comparison) (n, *p = 0.011, **p = 0.0011). Expanded centrioles treated with siCTRL (n), siPOC5 (o), or siWDR67/siPOC5 (p) stained for α/β tubulin (magenta) and POC5 (green) or WDR67 (cyan). Scale bars = 200 nm. White triangle: broken centrioles with distal attachment; white star: pieces of centriole; white arrowhead: microtubule blades. Percentage of cells with broken centrioles (r, siCTRL, N = 68, n = 3; siPOC5, N = 79, n = 3; siWDR67/siPOC5, N = 127, n = 3, One-way ANOVA, two-sided – Dunn’s multiple comparison, **p = 0.0025) or with specific break types (s, siCTRL, N = 68, n = 3; siPOC5, N = 20, n =_3; siWDR67/siPOC5, N = 103, n = 3, Two-way ANOVA, two-sided – Dunn’s multiple comparison) under each siRNA. t As in oq, stained for C2CD3 (green). Right part: model of broken centriole with distal attachment, n = 3. Scale bars = 200 nm. Dots show samples or replicates, and bars represent mean ± SD. N: number of cells, n: number of independent experiments. ****p < 0.0001. Source data for this figure are provided as a Source Data file.
Fig. 6
Fig. 6. Depletion of A-C linker proteins impairs centriole duplication.
U2OS cells in mitosis stained with DAPI (grey), Centrin (magenta), and CCDC77 (a, d – cyan), WDR67 (b, e – cyan) or MIIP (c, f – cyan) in different siRNA conditions. Scale bars = 5 μm. Dashed line squares correspond to insets. Normalized relative intensity of CCDC77 (g, siCTRL, N = 18, n = 3; siCCDC77, N = 6, n = 3, Unpaired t-test), WDR67 (h, siCTRL, N = 14, n = 3; siWDR67, N = 17, n = 3, Man Whitney test, **p = 0.0016) or MIIP (i, siCTRL, N = 54, n = 3; siMIIP, N = 42, n_= 3, Man Whitney test) in the different siRNA conditions in classical immunofluorescence. jl Percentage of cells in mitosis with 4 or less than 4 centrioles (centrin dots) in different siRNA conditions. j siCTRL, N = 188, n = 4; siCCDC77, N = 131, n = 4. ***p = 0.0004. k siCTRL, N = 173, n = 4; siWDR67, N = 143, n = 4. l siCTRL, N = 91, n = 3; siMIIP, N = 84, n = 3. Two-way ANOVA, two-sided (sidak’s multiple comparison), **p = 0.0044. Expanded U2OS stably expressing GFP alone or RNAi resistant GFP-CCDC77-RR (m), GFP-WDR67-RR (n) or GFP-MIIP-RR (o) stained for α/β tubulin (magenta) and the protein of interest (cyan) in different siRNA conditions. Centrioles are in G2/S phase in longitudinal view. Scale bars = 200 nm. White arrow: missing procentrioles. M = mature centriole, P = procentriole. Percentage of cells with two procentrioles, only one or without any procentriole in the indicated siRNA conditions. p siCTRL, N = 192, n = 3; siCCDC77, N = 143, n = 3; siCCDC77+GFP-CCDC77-RR, N = 102, n = 3. q siCTRL, N = 179, n = 3; siWDR67, N = 132, n = 3; siWDR67+GFP-WDR67-RR, N = 100, n = 3. r siCTRL, N = 163, n = 3; siMIIP, N = 150, n = 3; siMIIP+GFP-MIIP-RR, N = 164, n = 3. Dots show samples or replicates, and bars represent mean ± SD. N: number of cells, n: number of independent experiments. ****p < 0.0001. Source data for this figure are provided as a Source Data file.
Fig. 7
Fig. 7. The A-C linker plays a role in the recruitment of centriolar duplication factors.
a Model of a human mature centriole displaying structural elements, highlighting the A-C linker (cyan) and torus (yellow). The red lines indicate the potential connection between the A-C linker and the torus. b Expanded G2/S centrioles stained for CEP63 (yellow) and α/β tubulin (magenta) under indicated siRNAs. Scale bars = 200 nm. White arrow: missing procentrioles. M = mature centriole; P = procentriole. c Percentage of cells with CEP63 signal on both mature centrioles (dark grey) or only on one centriole (yellow) in the indicated siRNA conditions, siCTRL, N = 150, n = 3; siCCDC77, N = 67, n = 3; siWDR67, N = 123, n = 3; siMIIP, N = 92, n = 3. Two-way ANOVA, two-sided. d CEP63 coverage relative to tubulin length, siCTRL, N _ = 105, n = 7; siCCDC77, N = 59, n = 3; siWDR67, N = 27, n = 3; siMIIP, N = 59, n = 3. Kruskal-Wallis test (Dunn’s multiple comparison). e As in b, stained for CEP152 + CEP164 (yellow). CEP164 marks the mother centriole. Left part: centriole model highlighting torus (yellow) and distal appendages localizations. Scale bars = 200 nm. f Percentage of cells with CEP152 signal on both mature centrioles (dark grey) or only on one centriole (yellow) in the indicated siRNA conditions, siCTRL, N = 34, n = 3; siCCDC77, N = 39, n = 3; siWDR67, N = 28, n = 3; siMIIP, N = 41, n = 3. Two-way ANOVA, two-sided. g As in b, stained for PLK4 + CEP164 (green). CEP164 marks the mother centriole. Left part: centriole model highlighting PLK4 (green) and distal appendages localization. Scale bars = 200 nm. h Percentage of cells with PLK4 signal on both mature centrioles (dark grey) or only on one centriole (green) in the indicated siRNA conditions, siCTRL, N = 34, n = 3; siCCDC77, N = 35, n = 3; siWDR67, N = 31, n = 3; siMIIP, N = 34, n = 3. Two-way ANOVA, two-sided. i Expanded centrioles in G2/S phase stained for α/β tubulin (magenta), SAS6 (yellow), and A-C linker proteins (cyan) in the indicated siRNA conditions. Scale bars = 200 nm. White arrow: missing procentrioles. Model of a human mature centriole displaying the cartwheel with SAS6 signal (yellow) and the A-C linker structure (cyan). j Percentage of cells with SAS6 signal on both mature centrioles (dark grey) or only on one centriole (yellow) in the indicated siRNA conditions, siCTRL, N = 53, n = 3; siCCDC77, N = 32, n = 3; siWDR67, N = 35, n = 3; siMIIP, N = 25, n = 3. Two-way ANOVA, two-sided. Bars represent mean ± SD. N: number of cells, n: number of independent experiments. ****p < 0.0001. Source data for this figure are provided as a Source Data file.
Fig. 8
Fig. 8. Model of the proximal human centriole illustrating functional roles of the A–C linker.
a Model of the proximal region of the human centriole showing the dual roles of the A–C linker. The A–C linker contributes to centriole duplication through its association with the torus and maintains structural integrity by connecting neighboring microtubule triplets. b Schematic of the hierarchical organization of proteins from the pinhead region inside the mother centriole (MC) to the external surface, extending to the cartwheel of the procentriole (PC). The A–C linker is positioned centrally within this molecular network, bridging components across centriole substructures. Note that this model is intended as a schematic overview to illustrate the proteins examined in this study, and that the hierarchy does not reflect direct interactions between proteins.

Similar articles

Cited by

References

    1. Nigg, E. A. & Raff, J. W. Centrioles, centrosomes, and cilia in health and disease. Cell139, 663–678 (2009). - PubMed
    1. Doxsey, S. Re-evaluating centrosome function. Nat. Rev. Mol. Cell Biol.2, 688–698 (2001). - PubMed
    1. Bettencourt-Dias, M. & Glover, D. M. Centrosome biogenesis and function: centrosomics brings new understanding. Nat. Rev. Mol. Cell Biol.8, 451–463 (2007). - PubMed
    1. Gönczy, P. Centrosomes and cancer: revisiting a long-standing relationship. 10.1038/nrc3995 (2015). - PubMed
    1. Bornens, M. Centrosome Cycle. Life Sci.521, 1–6 (2002).

Substances

LinkOut - more resources