. 2025 Jul 24;11(1):142.
doi: 10.1038/s41522-025-00780-0.

Human gut microbiome gene co-expression network reveals a loss in taxonomic and functional diversity in Parkinson's disease

Affiliations

Human gut microbiome gene co-expression network reveals a loss in taxonomic and functional diversity in Parkinson's disease

Rémy Villette et al. NPJ Biofilms Microbiomes. .

Abstract

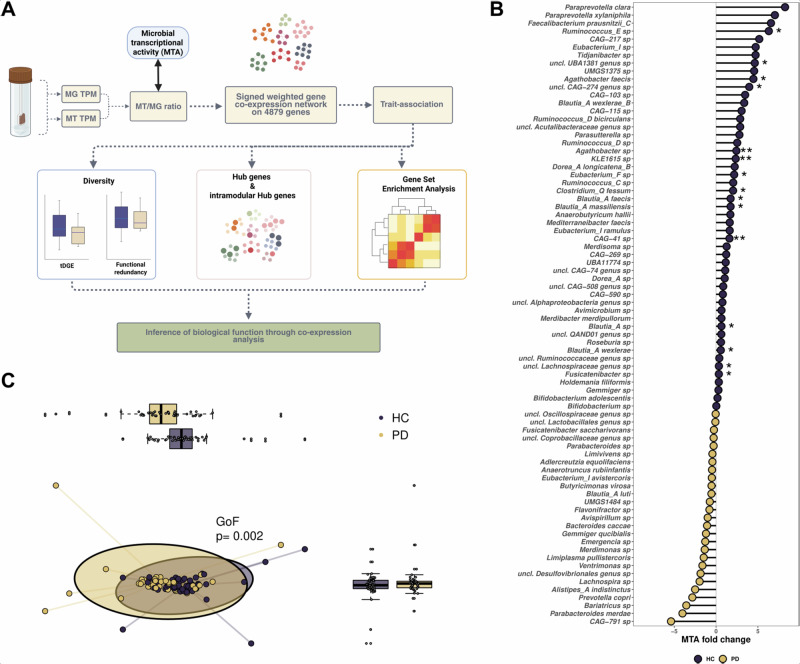
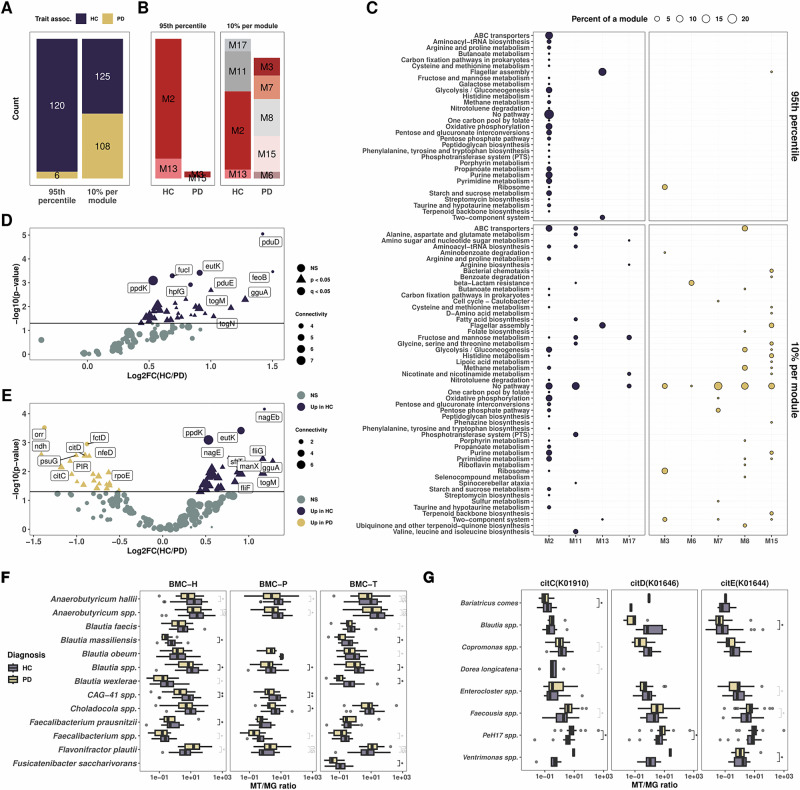
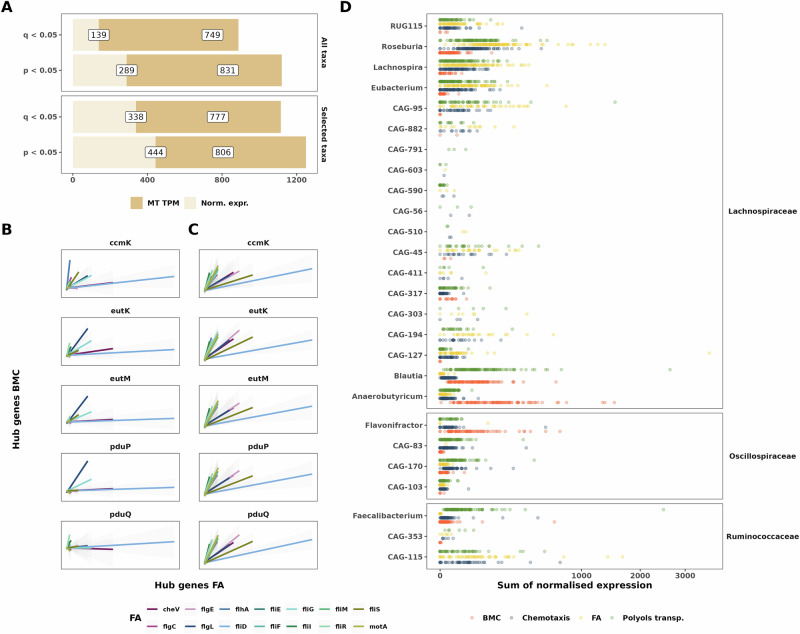
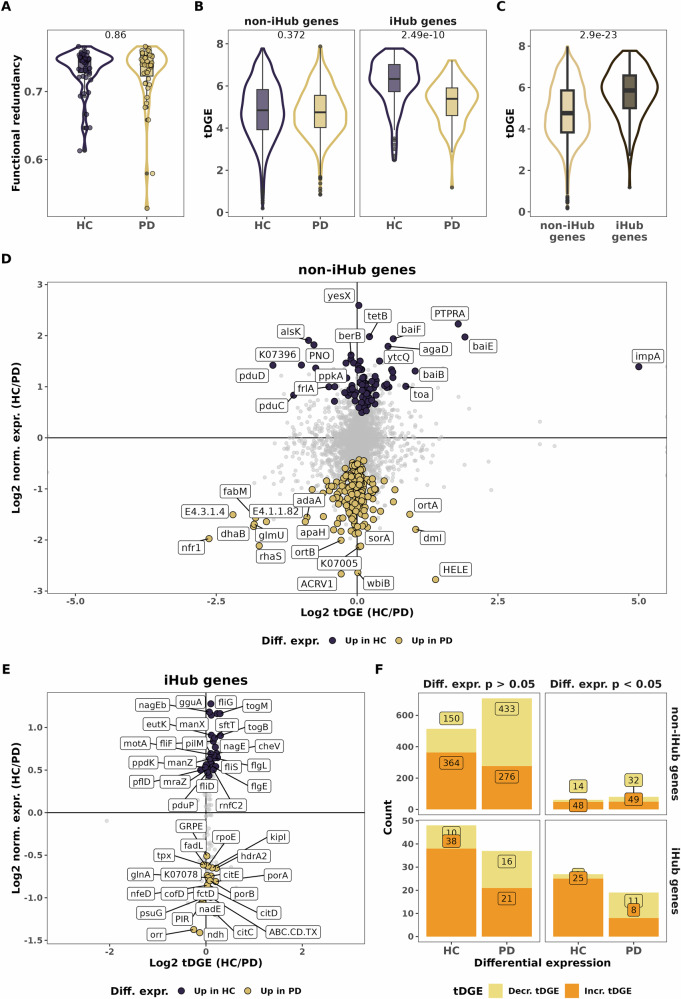
Gut microbiome alterations are linked to various diseases, including neurodegeneration, but their ecological and functional impacts remain unclear. Using integrated multi-omics (metagenomics and metatranscriptomics), we analyse microbiome gene co-expression networks in Parkinson's disease (PD) and healthy controls (HC). We observe a significant depletion of hub genes in PD, including genes involved in secondary bile acid biosynthesis, bacterial microcompartments (BMCs), polysaccharides transport and flagellar assembly (FA). Blautia, Roseburia, Faecalibacterium and Anaerobutyricum genera are the main contributors to these functions, showing significantly lower expression in PD. Additionally, we identify a strong correlation between BMC and FA expression, and an apparent dysregulation in cross-feeding between commensals in PD. Finally, PD also exhibits reduced gene expression diversity compared to HC, whereby higher gene expression correlates with greater diversity. We identify disruptions in gut metabolic functions, at both taxonomic and functional level, and microbiome-wide ecological features, highlighting targets for future gut microbiome restoration efforts.


Conflict of interest statement

Competing interests: The authors declare no competing interests.

Figures

Fig. 1
Fig. 1. Analysis workflow and analysis of microbial transcriptional activity taxonomically resolved.
A Metagenomic (MG) and metatranscriptomic (MT) counts per gene were converted into values representing the normalized gene expression MT/MG ratio. A co-expression gene network was then constructed based on a dataset of 4879 genes derived from both PD and HC individuals. This network revealed 17 distinct gene modules. Among these, modules significantly associated with either PD or HC were selected. Further analyses focused on gene diversity analysis, hub genes and gene set enrichments, aiming to uncover the ecological relevance of these modules in relation to the disease. Gene set enrichment analysis (GSEA), Parkinson’s disease (PD), healthy control (HC). B Differential MTA analysis at the species level. All taxa represented have been filtered on 50% prevalence in the cohort and a p < 0.05. Asterisks represent species differentially active after FDR correction. C Principal component analysis of MTA between HC and PD, MTA values have been scaled using Centered Log Ratio. P value results from environmental factor fitting coined GoF, for Goodness of fit.
Fig. 2
Fig. 2. Weighted correlation gene network analysis reveals module associations with disease.
A Module trait relationship heatmap with correlation and p-values for each module. Modules are sorted from left to right (healthy to Parkinson’s disease) based on the eigenvector value. The top panel represents the number of genes belonging to each module. B Network topology analysis for the modules grouped by trait association. A Kruskal and Wallis test was performed according to the trait association to compare modules based on their associations or not to one of the two groups. C Correlation between module diversity and other topology features. Correlation tests are spearman tests.
Fig. 3
Fig. 3. Gene set enrichment analysis on KEGG pathway highlights enrichment in HC modules but not in PD modules.
A. Count of genes within a module with undescribed pathways or not belonging to any KEGG pathway. B. Gene Set Enrichment Analysis of the different modules. All dots plotted are representing a significant enrichment before correction (p < 0.05), coloured by −log10(p value). Asterisks represent significant enrichments after FDR correction (q < 0.05).
Fig. 4
Fig. 4. Hub genes are mostly associated with healthy individuals.
A Bar plot highlighting the counts of hub genes selected based on top 100 connected genes (A) and 10% top connected genes per module (B). C Dot plot representing the count of pathways per module for the hub genes and iHub genes. The size of the dots represents the proportion of a given pathway within a module. D, E Volcano plots of differential expression of genes for the hub genes selected with the 95th percentile connected genes in the network (D) and top 10% connected per modules, also called iHub genes (E). Dots are colorized by group and shaped on the level of significance, triangular shape for p < 0.05 and round coloured shape for q < 0.05. F, G. Boxplots representing gene normalized expression resolved at the species level for the BMC shell proteins (F) and citrate lyases (G). All tests are Wilcoxon signed rank test with q values (FDR corrected) depicted in black and p values (q > 0.05 after FDR correction) depicted in grey.
Fig. 5
Fig. 5. Bacterial microcompartments are correlated with genes involved in flagellar assembly.
A Bar plots highlighting the number of positive correlations before and after FDR correction for normalized expression and MT TPM when taking all taxa expressing the BMCs genes and FA genes (upper panel) and relevant taxa from Fig. 4 (lower panel). All tests are based on the Spearman correlation. Correlation plots including selected taxa, both for normalized expression (B) and MT TPM (C), considering only hub genes from the 10% per modules approach. Tests are based on the Spearman correlation and all correlations are significant after FDR correction (q < 0.05). D Dot plot representing the sum of normalised expression per sample for a given process. BMC, FA and Chemotaxis gene grouping comprise all genes detected in the dataset, while ABC transporters only include the following genes: togBMNA, lacDEFGAICR, man, gguAB, ganAQ, msmEFGX, and wzm. Genera represented here are the “selected taxa” presented in (A, B).
Fig. 6
Fig. 6. Gene diversity is decreased in PD.
A Boxplot representing functional redundancy for each sample according to disease status. B Boxplot representing gene expression diversity according to disease status. C Boxplot representing gene expression diversity grouped by hub genes belonging or not. AC figures represent p-values from Mann-Whitney tests. D, E. Differential abundance versus gene expression diversity for a given gene for non-Hub genes (D) and Hub genes (E). Y-axis represents log2-fold change of normalized expression and X-axis the log 2-fold change of gene expression diversity. Dots are labelled and coloured for genes with p value < 0.05. F Stacked bar plot representing the counts of genes with an increased or decreased tDGE for iHub and non-iHub genes. Genes are classified into the PD or HC groups according to the sign of log2FC of normalized expression and faceted according to DEG significance.

References

    1. Elbaz, A., Carcaillon, L., Kab, S. & Moisan, F. Epidemiology of Parkinson’s disease. Rev. Neurol.172, 14–26 (2016). - PubMed
    1. Howell, M. J. & Schenck, C. H. Rapid eye movement sleep behavior disorder and neurodegenerative disease. JAMA Neurol.72, 707–712 (2015). - PubMed
    1. Fasano, A., Visanji, N. P., Liu, L. W. C., Lang, A. E. & Pfeiffer, R. F. Gastrointestinal dysfunction in Parkinson’s disease. Lancet Neurol.14, 625–639 (2015). - PubMed
    1. Braak, H., Rüb, U., Gai, W. P. & Del Tredici, K. Idiopathic Parkinson’s disease: possible routes by which vulnerable neuronal types may be subject to neuroinvasion by an unknown pathogen. J. Neural Transm.110, 517–536 (2003). - PubMed
    1. Cryan, J. F., O’Riordan, K. J., Sandhu, K., Peterson, V. & Dinan, T. G. The gut microbiome in neurological disorders. Lancet Neurol.19, 179–194 (2020). - PubMed

LinkOut - more resources