. 2025 Jul 25;15(1):27025.
doi: 10.1038/s41598-025-12209-x.

The origin of modern North Africans as depicted by a massive survey of mitogenomes

Affiliations

The origin of modern North Africans as depicted by a massive survey of mitogenomes

Giulia Colombo et al. Sci Rep. .

Abstract

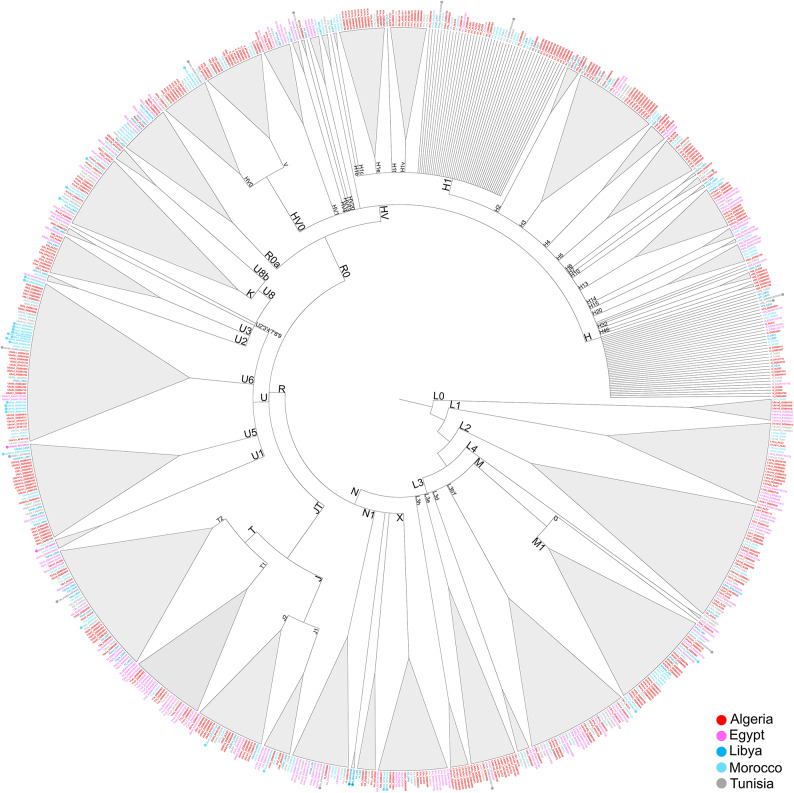
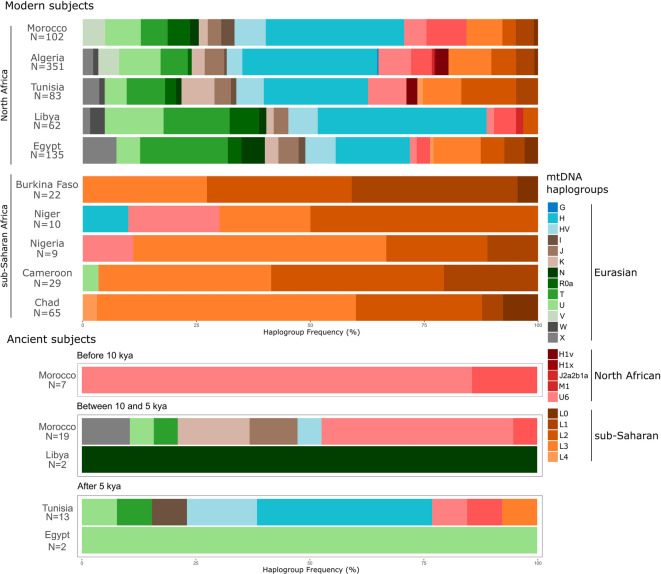
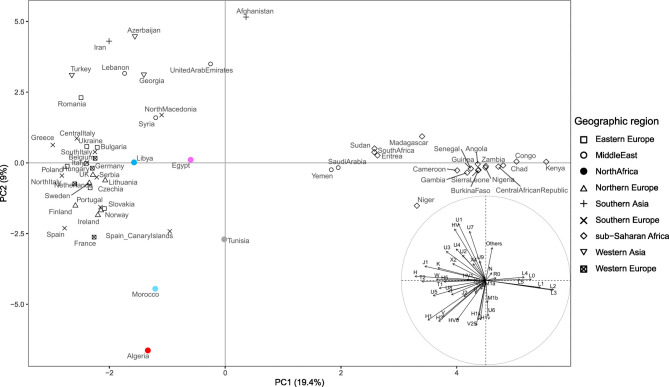
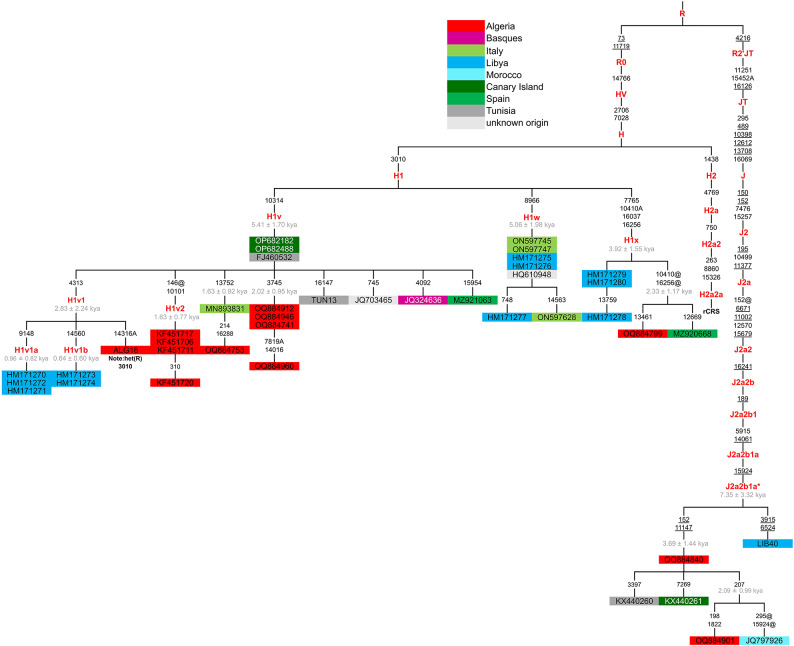
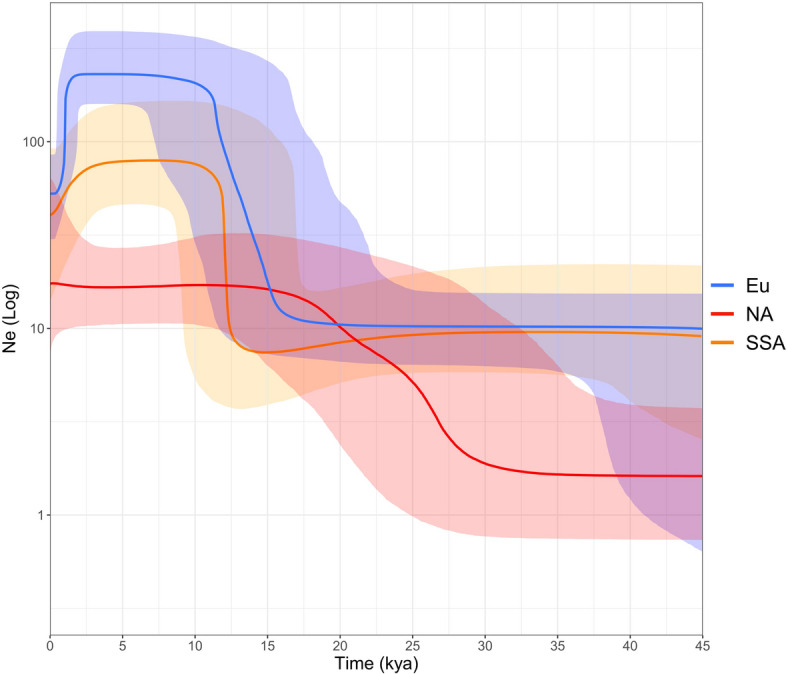
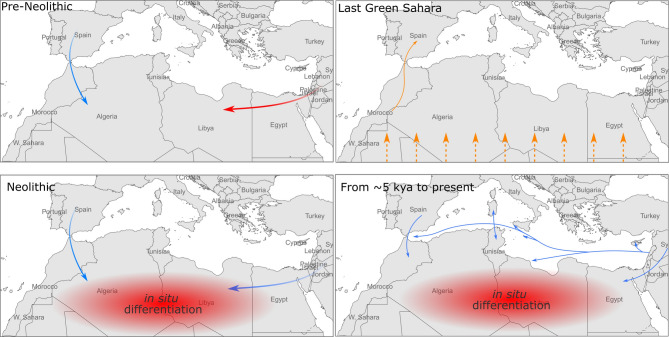
North Africa occupies a unique geographical position in the Mediterranean basin. The genetic profile of modern North African populations is the result of ancient and recent movements of people and periods of isolation. In this paper, we provide a comprehensive mitogenome analysis based on unbiased population sampling from across North Africa including a dataset of 733 modern (238 of which new) and 43 ancient mitogenomes from Morocco, Algeria, Tunisia, Libya and Egypt, compared with modern mitogenomes from Eurasia and sub-Saharan Africa. Our analyses, based on a phylogeographic and demographic approach suggest that mitogenome variability in North African populations (i) can be traced back to three main origins - Eurasia, North Africa and sub-Saharan Africa - and (ii) has been defined during crucial key time periods - from the Palaeolithic to the last millennia. In particular, we identified a signal for population movements from sub-Saharan Africa to North Africa during the favourable climatic period of the Green Sahara, providing evidence from complete mitogenomes that the human dispersals associated with this period also involved females.


Conflict of interest statement

Declarations. Competing interests: The authors declare no competing interests.

Figures

Fig. 1
Fig. 1
Schematic phylogenetic tree of modern (N = 733) and ancient (N = 43) mitogenomes from North Africa. Grey triangles correspond to different haplogroups and sub-haplogroups and their width is proportional to the number of included samples. Ancient subjects are indicated in bold italic and are flanked with a circular marker (see Supplementary Figure S1 for details).
Fig. 2
Fig. 2
Barplots illustrating macro-haplogroup/haplogroup frequencies (as reported in Supplementary Table S4) in North African (Morocco, Algeria, Tunisia, Libya, and Egypt from west to east) and sub-Saharan (Burkina Faso, Niger, Nigeria, Cameroon, and Chad from west to east) modern and ancient mitogenomes analysed in this study. Ancient subjects are clustered into three groups based on their age estimates (before 10 kya, between 10 and 5 kya and after 5 kya). Haplogroups on the right are grouped according to their geographic origin/distribution.
Fig. 3
Fig. 3
PCA plot showing the genetic variation of North Africa in the context of neighbouring sub-Saharan African and Western Eurasian landscapes. Data from sub-Saharan Africans are from the present study, while the Eurasian dataset includes over 18 thousand sequences available in public databases (Supplementary Table S3). The plot is based on modern mtDNA haplogroup frequencies from both this study and the literature. Reference populations are indicated by the country name, followed by a symbol to represent their macro-area. North African populations analysed in this study are highlighted in different colours: red (Algeria); pink (Egypt); blue (Libya); light blue (Morocco) and grey (Tunisia). The inset shows haplogroup contributions to PC1 and PC2 (accounting for 19.4% and 9.0% of the total variance, respectively).
Fig. 4
Fig. 4
Phylogenetic tree of the North African-specific haplogroups H1v, H1x, H1w, and J2a2b1a* (included mitogenomes are listed in Supplementary Table S6).
Fig. 5
Fig. 5
Bayesian Skyline Plot showing the effective population size trends (Ne) of haplogroups found in the dataset of 733 modern and 43 ancient mitogenomes from North Africa. Haplogroups were divided into three groups, according to the three genetic components (as reported in Supplementary Tables S4 and S5) contributing to the North African gene pool, Eu (Eurasian), NA (North African) and SSA (sub-Saharan African). Solid lines are the median estimates obtained by employing the mutation rates proposed by Soares et al.; the shadings show the highest posterior density limits.
Fig. 6
Fig. 6
Representation of the major movements of the three maternal genetic components reported in this study. The colours of the arrows are in agreement with the three genetic components identified (Eurasiatic -blue-, sub-Saharan -orange- and North African -red-). The underlying map was built using the R package rnaturalearth v.1.1.0 (https://docs.ropensci.org/rnaturalearth/).

Similar articles

References

    1. Hublin, J. J. et al. New fossils from Jebel irhoud, Morocco and the pan-African origin of Homo sapiens. Nature546, 289–292 (2017). - PubMed
    1. Hunt, C. et al. Site formation processes in caves: the holocene sediments of the Haua fteah,Cyrenaica, Libya. J. Archaeol. Sci.37, 1600–1611 (2010).
    1. Barton, R. N. E. et al. Origins of the iberomaurusian in NW africa: new AMS radiocarbon dating of the middle and later stone age deposits at Taforalt cave, Morocco. J. Hum. Evol.65, 266–281 (2013). - PubMed
    1. Arauna, L. R. et al. Recent historical migrations have shaped the gene pool of Arabs and Berbers in North Africa. Mol. Biol. Evol.34, 318–329 (2017). - PMC - PubMed
    1. Cavalli-Sforza, L. L., Cavalli-Sforza, L., Menozzi, P. & Piazza, A. The History and Geography of Human Genes (Princeton University Press, 1994).

Substances

LinkOut - more resources