. 2025 Sep;44(17):4745-4771.
doi: 10.1038/s44318-025-00506-0. Epub 2025 Jul 24.

ALS-associated RNA-binding proteins promote UNC13A transcription through REST downregulation

Affiliations

ALS-associated RNA-binding proteins promote UNC13A transcription through REST downregulation

Yasuaki Watanabe et al. EMBO J. 2025 Sep.

Abstract

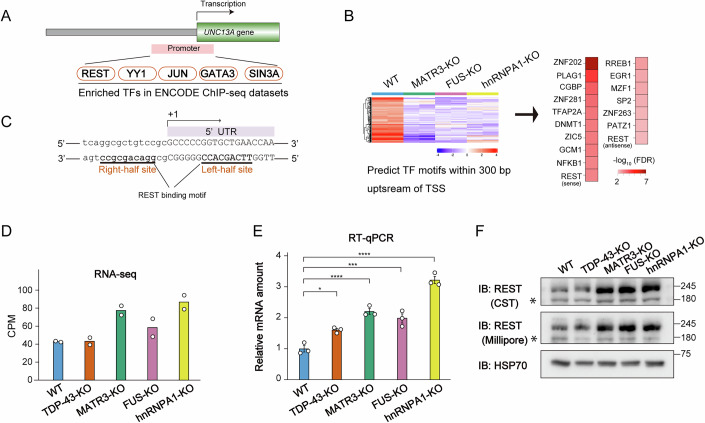
Amyotrophic lateral sclerosis (ALS) is a neurodegenerative disease characterized by selective loss of motor neurons. Although multiple pathophysiological mechanisms have been identified, no comprehensive understanding of these heterogeneous processes has been achieved. The ALS-associated RNA-binding protein (RBP) TDP-43 has previously been shown to stabilize UNC13A mRNA by preventing cryptic exon inclusion. Here, we show that the ALS-associated RBPs MATR3, FUS, and hnRNPA1 regulate UNC13A expression by targeting the transcriptional repressor REST. These RBPs bind to and downregulate REST mRNA to promote UNC13A transcription. Loss of any of these RBPs in cultured cells or in iPSC-derived motor neurons carrying the ALS-causing FUS P525L mutation leads to REST overexpression, and the same is observed in motor neurons of individuals with familial or sporadic ALS. The functional convergence of four RBPs on the regulation of UNC13A expression underscores the important role of this process for synaptic integrity, and its association with ALS pathogenesis could be relevant for the development of new therapeutic agents.

Keywords: ALS; Cryptic Exon; FUS; REST; UNC13A.


Conflict of interest statement

Disclosure and competing interests statement. The authors declare no competing interests.

Figures

Figure 1
Figure 1. UNC13A expression is downregulated in RBP-KO cell lines.
(A) Experimental workflow for RNA-seq analysis of SH-SY5Y cell lines deficient in TDP-43, MATR3, FUS, or hnRNPA1. Illustrations were generated with Biorender.com. (B) The results of expression analysis for RNA-seq data from WT as well as TDP-43-, MATR3-, FUS-, and hnRNPA1-KO cell lines. The RNA-seq analysis was performed with biologically independent duplicates. The top 2000 most differentially expressed genes were classified into six groups by k-means clustering with the use of iDEP version 2.01 (http://bioinformatics.sdstate.edu/idep) (Ge et al, 2018), and the data were mean-centered for each gene (left). The heatmap color key represents Z-score normalized expression values. Genes in cluster 1 were subjected to Gene Ontology (GO) biological process and Kyoto Encyclopedia of Genes and Genomes (KEGG) pathway analysis, and the associated processes and pathways were visualized as a network (right). Color intensity indicates the false discovery rate (FDR) value, representing statistical significance, whereas circle size indicates fold enrichment. (C) Venn diagram showing the overlap between genes in cluster 1 (B) and ALS-related genes classified in the ALS Online Database (ALSod: http://alsod.iop.kcl.ac.uk) as definitive ALS genes, clinical modifiers, and genes with strong to moderate genetic evidence for ALS (Wroe et al, 2008), which are listed in Appendix Table S1. (D) RT-qPCR analysis of UNC13A mRNA in the four RBP-KO cell lines and WT cells. Data are means ± SEM from three biological replicates. ****P < 0.0001 (one-way ANOVA followed by Tukey’s post hoc test); exact P values: WT vs TDP-43-KO, P = 2.1e−11; WT vs MATR3-KO, P = 1.9e−11; WT vs FUS-KO, P = 2.9e−11; WT vs hnRNPA1-KO, P = 2.3e−11. (E) Immunoblot (IB) analysis of UNC13A, TDP-43, MATR3, FUS, and hnRNPA1 in the four RBP-KO cell lines and WT cells. HSP70 was examined as a loading control. (F) RT-qPCR analysis of UNC13A mRNA in WT cells and in three RBP-KO cell lines complemented with a corresponding doxycycline-inducible RBP vector (or the empty vector as a control) and treated with doxycycline. Data are means ± SEM from three biological replicates. ***P < 0.001, ****P < 0.0001 (Student’s t test); exact P values: MATR3-KO, P = 0.00072; FUS-KO, P = 5.9e-05; hnRNPA1-KO, P = 1.2e−05. See also Appendix Figs. S1, S2, Dataset EV1, and Appendix Table S1. Source data are available online for this figure.
Figure 2
Figure 2. TDP-43 stabilizes UNC13A mRNA by blocking cryptic splicing, whereas MATR3, FUS, and hnRNPA1 promote UNC13A transcription.
(A) RT-qPCR analysis of UNC13A transcripts including the cryptic exon (CE) in WT cells and the four RBP-KO cell lines. The PCR primer sequences were referenced from Ma et al (2022), and their locations are illustrated in the upper right corner. The forward primer was designed to span the junction between the canonical exon and the cryptic exon. Data are means ± SEM from three biological replicates. ***P < 0.001 (Student’s t test); exact P value = 0.00030. (B) RT-PCR analysis of WT or TDP-43-KO cells transfected with either a GC duplex (negative control, Ctrl) or two different small interfering RNAs (siRNAs #1 or #2) for UPF1. The PCR primer sequences were referenced from Ma et al (2022), and their locations are shown below the gel images; they flanked the CE of UNC13A or recognized a region of UNC13A mRNA unaffected by CE inclusion (FL). GAPDH was examined as an internal control. Among the PCR products amplified with the primers flanking the CE of UNC13A, (i–iii) indicate different intron retention patterns for products containing the CE, whereas (iv) indicates a product lacking the CE. (CE) RT-qPCR analysis of UNC13A-CE mRNA in TDP-43-KO cells (C), UNC13A-FL mRNA in TDP-43-KO cells (D), and UNC13A-FL mRNA in WT, MATR3-KO, FUS-KO, and hnRNPA1-KO cells (E) after treatment with either cycloheximide (CHX, 100 µg/ml) or dimethyl sulfoxide (DMSO) vehicle for 6 h. Data are means ± SEM from three biological replicates. *P < 0.05, **P < 0.01; N.S., not significant (Student’s t test); exact P values: (C) P = 0.038; (D) P = 0.0022. (F, G) RT-qPCR analysis of nascent UNC13A-FL mRNA in WT and TDP-43-KO cells (F) as well as in WT, MATR3-KO, FUS-KO, and hnRNPA1-KO cells (G) that had been labeled with 4-EU. Data are means ± SEM from three (F) or four (G) biological replicates. ***P < 0.001, ****P < 0.0001; N.S., not significant (F, Student’s t test; G, one-way ANOVA followed by Tukey’s post hoc test); exact P values for (G): WT vs MATR3-KO, P = 1.8e−6; WT vs FUS-KO, P = 1.0e−7; WT vs hnRNPA1-KO, P = 0.00074. (H) Proposed mechanisms for the regulation of UNC13A mRNA abundance in WT, TDP-43-KO, and the other three types of RBP-KO cells. See also Appendix Fig. S3. Source data are available online for this figure.
Figure 3
Figure 3. REST is upregulated and binds to the UNC13A promoter in RBP-KO cells.
(A) Identification of transcription factors (TFs) that bind to the UNC13A promoter with the use of ChIP-Atlas (Oki et al, 2018). The UNC13A promoter region was aligned with ChIP-seq data sets from ENCODE that are specific to neuronal cells in order to identify enriched transcription factors. The enrichment score threshold was set at 500, and the analyzed promoter region was a 339-bp ENCODE candidate cis-regulatory element (cCRE) corresponding to chr19:17688234-17688572 in Hg38. The five identified transcriptional factors are shown. UTR, untranslated region. (B) Motif analysis for transcription factors enriched in the promoter regions (300 bp upstream of the TSS) of genes commonly downregulated in MATR3-, FUS-, and hnRNPA1-KO cell lines. The downregulated genes were identified by k-means clustering (left). Transcription factors with an FDR of <0.01 are shown in a heatmap based on the FDR values (right). (C) REST binding motif within the UNC13A promoter region. Bases corresponding to the noncanonical motif on the antisense strand are underlined. (D, E) REST mRNA abundance in four RBP-KO cell lines and WT cells as determined by RNA-seq (D) or RT-qPCR (E) analysis. The RNA-seq data are means from biological duplicates and are presented as counts per million (CPM), and the RT-qPCR data are means ± SEM from three biological replicates. *P < 0.05, ***P < 0.001, ****P < 0.0001 (one-way ANOVA followed by Tukey’s post hoc test); exact P values for (E): WT vs TDP-43-KO, P = 0.017; WT vs MATR3-KO, P = 9.3e−05; WT vs FUS-KO, P = 0.00053; WT vs hnRNPA1-KO, P = 3.0e−07. (F) Immunoblot analysis of REST in four RBP-KO cell lines and in WT cells. The REST protein was detected at a position corresponding to ~210 kDa with two different antibody preparations. Asterisks indicate nonspecific bands. Quantitative data are presented in Appendix Fig. S4C. See also Appendix Fig. S4, Appendix Tables S2, S3, and Table EV1. Source data are available online for this figure.
Figure 4
Figure 4. REST inhibits UNC13A transcription in RBP-KO cells.
(A) Schematic diagram of mock, canonical, and ΔR luciferase reporter constructs for the UNC13A promoter. The ΔR construct lacks a 6-bp sequence essential for REST binding. (B) Line graph showing PhyloP scores for evolutionary conservation of the UNC13A promoter region. The black bars indicate the REST binding motif, and the red bar indicates the region deleted in the ΔR construct. (C) Relative luciferase (Luc) activity for HEK293T cells transfected with the firefly luciferase constructs shown in (A) as well as with a vector for Renilla luciferase. The firefly/Renilla luciferase activity ratio was measured 2 days after transfection. Data are means ± SEM from three biological replicates. ***P < 0.001, ****P < 0.0001 (one-way ANOVA followed by Tukey’s post hoc test); exact P values: Mock vs Canonical, P = 0.00027; Mock vs ΔR, P = 4.5e−07. (D, E) Relative luciferase activity for the canonical (D) and ΔR (E) promoter constructs in HEK293T cells previously transfected with two different pairs of Cas9-single-guide RNA (sgRNA) vectors targeting REST or with a control vector (Ctrl). Data are means ± SEM from three biological replicates. *P < 0.05, **P < 0.01; N.S., not significant (one-way ANOVA followed by Tukey’s post hoc test); exact P values for (D): Ctrl vs #1, P = 0.0095; Ctrl vs #2, P = 0.039. (F) Relative luciferase activity for the mock and canonical promoter constructs in WT and RBP-KO cell lines. Data are means ± SEM from three biological replicates. **P < 0.01, ***P < 0.001, ****P < 0.0001 (one-way ANOVA followed by Tukey’s post hoc test); exact P values: WT vs Mock, P = 1.4e−07; WT vs MATR3-KO, P = 0.00025; WT vs FUS-KO, P = 1.7e−07; WT vs hnRNPA1-KO, P = 0.0025. (G) The ratio of ΔR/canonical promoter construct luciferase activity in WT and RBP-KO cell lines. Statistical significance for the comparison of ΔR/canonical activity ratios between WT and each RBP-KO cell line was assessed. Data are means ± SEM from five biological replicates. ****P < 0.0001 (one-way ANOVA followed by Tukey’s post hoc test); exact P values: WT vs MATR3-KO, P = 5.8e−07; WT vs FUS-KO, P = 2.3e−14; WT vs hnRNPA1-KO, P = 2.1e−12. (H) RT-qPCR analysis of UNC13A mRNA in WT, MATR3-KO, FUS-KO, and hnRNPA1-KO cell lines transfected with a GC duplex (negative control) or two different siRNAs targeting REST. Data are means ± SEM from three biological replicates. *P < 0.05, **P < 0.01, ***P < 0.001, ****P < 0.0001; N.S., not significant (one-way ANOVA followed by Tukey’s post hoc test); exact P values: WT Ctrl vs #1, P = 0.016; WT Ctrl vs #2, P = 0.051; MATR3-KO Ctrl vs #1, P = 0.00045; MATR3-KO Ctrl vs #2, P = 0.00099; FUS-KO Ctrl vs #1, P = 0.0053; FUS-KO Ctrl vs #2, P = 0.0063; hnRNPA1-KO Ctrl vs #1, P = 9.50e−06; hnRNPA1-KO Ctrl vs #2, P = 1.71e−05. See also Appendix Fig. S5. Source data are available online for this figure.
Figure 5
Figure 5. MATR3, FUS, and hnRNPA1, but not TDP-43, bind to REST mRNA.
(A) RT-qPCR analysis of nascent REST mRNA abundance in WT, MATR3-KO, FUS-KO, and hnRNPA1-KO cell lines. Data are means ± SEM from three biological replicates. N.S., not significant (one-way ANOVA followed by Tukey’s post hoc test). (B) Enrichment of TDP-43 and MATR3 by immunoprecipitation from WT cell lysate. The cell lysate (Input) as well as the immunoprecipitate (IP) obtained with antibodies to TDP-43, MATR3 or with control immunoglobulin G (IgG) were subjected to immunoblot analysis with antibodies to TDP-43 or MATR3. An asterisk indicates the dimer of the IgG heavy chain. (C) Detection of REST mRNA by RT-PCR analysis of the samples obtained as in (B). (D) Enrichment of FUS and hnRNPA1 by immunoprecipitation from WT cell lysate. Asterisk indicates the monomer of the IgG heavy chain. (E) Detection of REST mRNA by RT-PCR analysis of the samples obtained as in (D). Source data are available online for this figure.
Figure 6
Figure 6. FUS IDRs are essential for the regulation of REST mRNA.
(A) Schematic representation of FLAG epitope-tagged human FUS mutant constructs (top). Dashed lines indicate deleted domains. FL full length, Gly glycine-rich domain, RRM RNA recognition motif, RGG Arg-Gly-Gly, ZnF zinc finger. The middle schematic illustrates the locations of ALS-associated mutations in FUS, referenced from Kapeli et al, . Disorder prediction for FUS residues by PONDR (http://www.pondr.com) is shown at the bottom. (B) Immunoblot analysis of endogenous FUS in WT cells and of ectopic FLAG-tagged FL or deletion mutant forms of FUS expressed in FUS-KO cells. β-actin was examined as a loading control. (C) RT-qPCR analysis of REST mRNA in WT cells as well as in FUS-KO cells expressing FUS-FL or harboring the empty vector. Data are means ± SEM from three biological replicates. ****P < 0.0001; N.S., not significant (one-way ANOVA followed by Tukey’s post hoc test); exact P value: WT vs Vector, P = 6.2e−07. (D and E) RT-qPCR analysis of REST (D) and UNC13A (E) mRNAs in FUS-KO cells expressing FL or deletion mutant forms of FUS. Data are means ± SEM from three independent experiments. ****P < 0.0001; N.S., not significant (one-way ANOVA followed by Tukey’s post hoc test); exact P values for (D): FL vs ΔGly, P = 6.6e−06; FL vs ΔRGG1, P = 1.1e−06; FL vs ΔRGG2, P = 7.3e−06; exact P values for (E): FL vs ΔGly, P = 2.8e−14; FL vs ΔRRM, P = 1.5e−06; FL vs ΔRGG1, P = 2.8e−14; FL vs ΔZnF, P = 2.1e−10; FL vs ΔRGG2, P = 2.8e−14. (F) Schematic representation of FUS mutants. The 27 NH2-terminal tyrosines are all replaced by serine in 27YS, whereas 27YS-NLS also possesses the NLS of SV40 at its COOH-terminus. (G) Quantification of the percentage of cells with cytoplasmic FUS granules co-localized with G3BP after sodium arsenite treatment (1 mM, 30 min) in U2OS cells expressing FL, 27YS, or 27YS-NLS forms of FUS. At least 90 cells were analyzed per experiment. Data are mean ± SEM from three independent experiments. ****P < 0.0001 (one-way ANOVA followed by Tukey’s post hoc test); exact P values: FL vs 27YS, P = 1.8e−05; FL vs 27YS-NLS, P = 1.0e−06. See also Appendix Fig. S6B for representative images. (H, I) RT-qPCR analysis of REST (H) and UNC13A (I) mRNAs in FUS-KO cells expressing FL, 27YS, or 27YS-NLS forms of FUS. Data are means ± SEM from three biological replicates. ****P < 0.0001 (one-way ANOVA followed by Tukey’s post hoc test); exact P values for (H): FL vs 27YS, P = 5.0e−05; FL vs 27YS-NLS, P = 5.3e−05; exact P values for (I): FL vs 27YS, P = 5.5e−07; FL vs 27YS-NLS, P = 5.3e−07. See also Appendix Fig. S6. Source data are available online for this figure.
Figure 7
Figure 7. REST is overexpressed in spinal motor neurons of individuals with ALS.
(A, B) RT-qPCR analysis of REST (A) and UNC13A (B) mRNA in WT and FUS P525L/+ (FUS-ALS) induced motor neurons (iMNs). Data are means ± SEM from three biological replicates. **P < 0.01, ***P < 0.001 (Student’s t test); exact P values: REST (A), P = 0.00071; UNC13A (B), P = 0.0011. (C, D) RNA-seq analysis was previously performed for lumbar motor neurons isolated from control (non-ALS) individuals (n = 7) and patients with sporadic ALS (sALS, n = 13) by laser capture microdissection (Krach et al, 2018). The data are available under accession number GSE76220 in the GEO database. REST (C) and UNC13A (D) expression levels are shown separately for the non-ALS and sALS. TPM, transcripts per million. Data are presented as box plots, in which the boxes show the median and upper and lower quartile values, and the whiskers represent the range. **P < 0.01, N.S., not significant (Mann–Whitney U test); exact p value: REST (C), P = 0.0070; UNC13A (D), P = 0.27. (E, F) Immunohistochemical staining for FUS in spinal motor neurons of a control (non-ALS) individual with sporadic inclusion body myositis (sIBM) and an individual with familial ALS associated with a FUS mutation (R521C/+), respectively. Scale bars, 25 μm. (G, H) Immunohistochemical staining for REST in spinal motor neurons of a control individual with sIBM and an individual with familial ALS associated with a FUS mutation (R521C/+), respectively. The boxed regions in the main images are shown at higher magnification in the insets. Scale bars, 25 μm. (I) Quantification of REST-positive cells among anterior horn motor neurons by immunohistochemical analysis of spinal cord sections (four sections per individual) from three control individuals (with sIBM, carcinoma peritonitis, or multiple system atrophy; n = 12), one individual with familial ALS associated with a FUS mutation (R521C/+; n = 4), and three individuals with sALS (n = 12). The proportion of REST-positive cells was quantified in a 1-mm2 area in each section and expressed as a percentage of anterior horn motor neurons. Box plots represent the median (center line), interquartile range (IQR; box), and whiskers indicating the most extreme data point within 1.5×IQR from the quartiles. **P < 0.01, ***P < 0.001 (Kruskal–Wallis test followed by Dunn’s test); exact P value: Non-ALS vs FUS-ALS, p = 0.00019; Non-ALS vs sALS, P = 0.00093. See also Appendix Fig. S7D for the values for each individual. (J) Immunohistochemical staining for REST in spinal motor neurons of three individuals with sALS. TDP-43 pathology was apparent in patients (b) and (c), but not in patient (a), as is shown in Appendix Fig. S7D. Scale bar, 25 µm. See also Appendix Fig. S7. Source data are available online for this figure.
Figure EV1
Figure EV1. Characterization of RBP-KO cell lines, related to Fig. 1.
(A) Bright-field images of WT cells and RBP-KO cell lines. Cells were seeded in iMatrix-coated wells, and images were captured the next day. Yellow arrowheads indicate cells with cytoplasmic processes. Scale bar = 200 µm. (B) Immunoblot analysis of PARP and cleaved PARP in WT cells and in RBP-KO cell lines. β-actin served as a loading control. The band intensity for cleaved PARP (normalized by that of β-actin) was quantified by densitometry.
Figure EV2
Figure EV2. Knockdown of REST rescues morphological defects in RBP-KO cell lines, related to Fig. 3.
(A) Bright-field images of MATR3-, FUS-, and hnRNPA1-KO cell lines in iMatrix-coated 6-well plate, 5 days after transfection with either a GC duplex (negative control) or a REST siRNA. Scale bar = 200 μm. (B) Quantification of cytoplasmic process formation in MATR3-KO, FUS-KO, and hnRNPA1-KO cell lines shown in (A), with WT cells included as a reference. Cells were classified as having cytoplasmic processes if their extensions exceeded the length of the major axis of the cell body. Data are mean ± SEM from three independent experiments. **P < 0.01, ***P < 0.001, ****P < 0.0001 (Student’s t test); exact P values: MATR3-KO, P = 0.0036; FUS-KO, P = 0.00027; hnRNPA1-KO, P = 6.6e-05.
Figure EV3
Figure EV3. FUS, MATR3, and hnRNPA1 bind to each other, related to Fig. 5.
(A) Immunoprecipitation of FUS from WT cell lysate. The immunoprecipitate (IP) obtained with antibodies to FUS or with control immunoglobulin G (IgG) were subjected to immunoblot analysis with antibodies to MATR3, FUS or hnRNPA1. (B) Immunoprecipitation of hnRNPA1 from WT cell lysate.
Figure EV4
Figure EV4. Domain structures of MATR3 and hnRNPA1 with ALS-associated mutations, related to Fig. 6.
(A) Schematic representation of the domain structure of MATR3 (top). NES, nuclear export signal; ZnF, zinc finger; RRM, RNA recognition motif; NLS, nuclear localization signal. The locations of ALS-associated mutations in MATR3 referenced from Malik and Barmada, are also shown. Disorder prediction for MATR3 residues by PONDR (http://www.pondr.com) is shown at the bottom. (B) Schematic representation of the domain structure of hnRNPA1 (top). RRM, RNA recognition motif; PrLD, prion-like domain. The locations of ALS-associated mutations in hnRNPA1 referenced from Beijer et al, are also shown. G304Nfs*3 is a frameshift mutation, while *321Eext*6 and *321Qext*6 are extension mutations. Disorder prediction for hnRNPA1 residues by PONDR is shown at the bottom.
Figure EV5
Figure EV5. REST and UNC13A expression in iPSC-derived motor neurons from the Answer ALS platform, related to Fig. 7.
(A, B) Correlation analysis of REST and UNC13A expression using transcriptomics data from iPSC-derived motor neurons available on the Answer ALS platform. Each blue dot represents one sample. The line indicates the linear regression fit. The R² value represents the proportion of variance in UNC13A expression explained by REST expression, and the p value was calculated using Pearson’s correlation test. (A) Non-ALS group (n = 283), (B) ALS group (n = 490). CPM, counts per million. (C, D) Comparison of REST (C) and UNC13A (D) expression between control (non-ALS, n = 283) and ALS (ALS, n = 490) using transcriptomics data from iPSC-derived motor neurons available on the Answer ALS platform. Box plots represent the median (center line), interquartile range (IQR; box), and whiskers indicating the most extreme data point within 1.5×IQR from the quartiles. CPM, counts per million. N.S., not significant (Mann–Whitney U test).

References

    1. Akiyama T, Koike Y, Petrucelli L, Gitler AD (2022) Cracking the cryptic code in amyotrophic lateral sclerosis and frontotemporal dementia: towards therapeutic targets and biomarkers. Clin Transl Med 12:e818 - PMC - PubMed
    1. Akiyama T, Suzuki N, Ishikawa M, Fujimori K, Sone T, Kawada J, Funayama R, Fujishima F, Mitsuzawa S, Ikeda K et al (2019) Aberrant axon branching via Fos-B dysregulation in FUS-ALS motor neurons. EBioMedicine 45:362–378 - PMC - PubMed
    1. Akiyama T, Warita H, Kato M, Nishiyama A, Izumi R, Ikeda C, Kamada M, Suzuki N, Aoki M (2016) Genotype-phenotype relationships in familial amyotrophic lateral sclerosis with FUS/TLS mutations in Japan. Muscle Nerve 54:398–404 - PubMed
    1. Allodi I, Montañana-Rosell R, Selvan R, Löw P, Kiehn O (2021) Locomotor deficits in a mouse model of ALS are paralleled by loss of V1-interneuron connections onto fast motor neurons. Nat Commun 12:3251 - PMC - PubMed
    1. An H, Skelt L, Notaro A, Highley JR, Fox AH, La Bella V, Buchman VL, Shelkovnikova TA (2019) ALS-linked FUS mutations confer loss and gain of function in the nucleus by promoting excessive formation of dysfunctional paraspeckles. Acta Neuropathol Commun 7:7 - PMC - PubMed

MeSH terms