. 2025 Jul 24;15(1):26925.
doi: 10.1038/s41598-025-12222-0.

Chlorogenic acid attenuates cardiac hypertrophy and fibrosis by downregulating galectin 3

Affiliations

Chlorogenic acid attenuates cardiac hypertrophy and fibrosis by downregulating galectin 3

Seong Hoon Kim et al. Sci Rep. .

Abstract

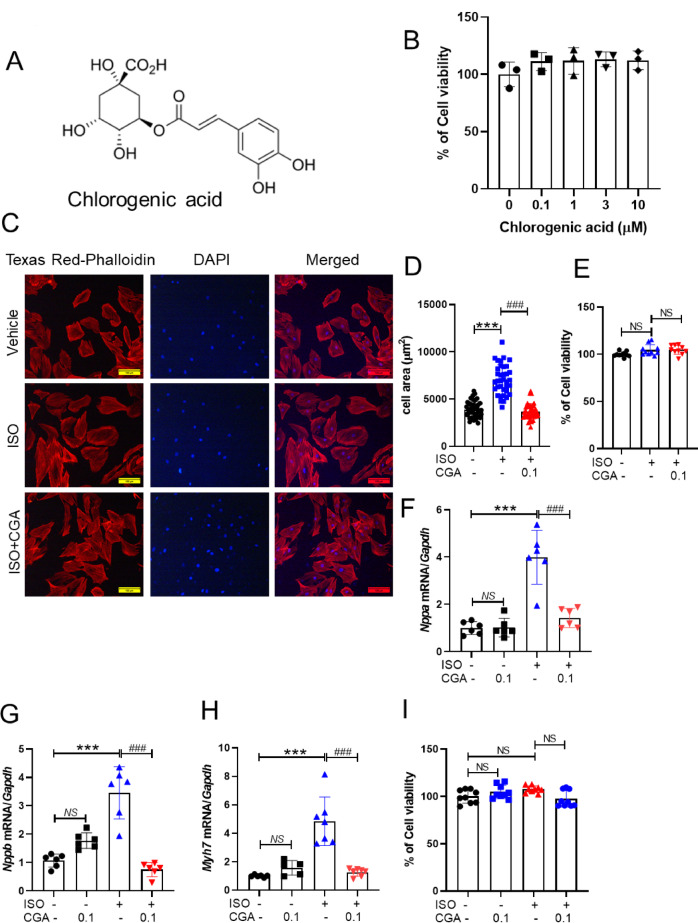
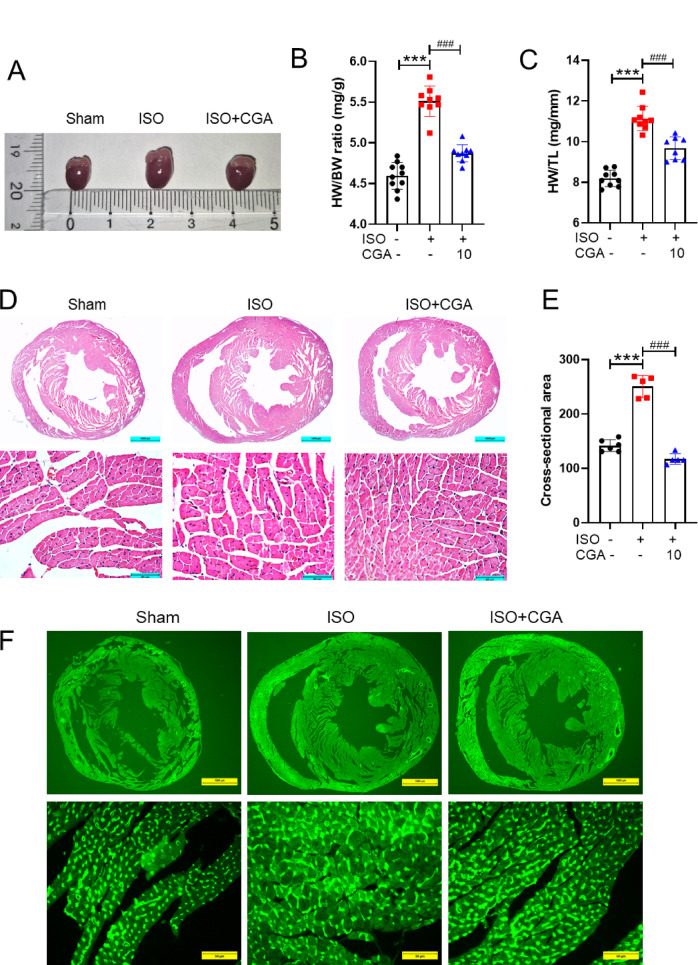
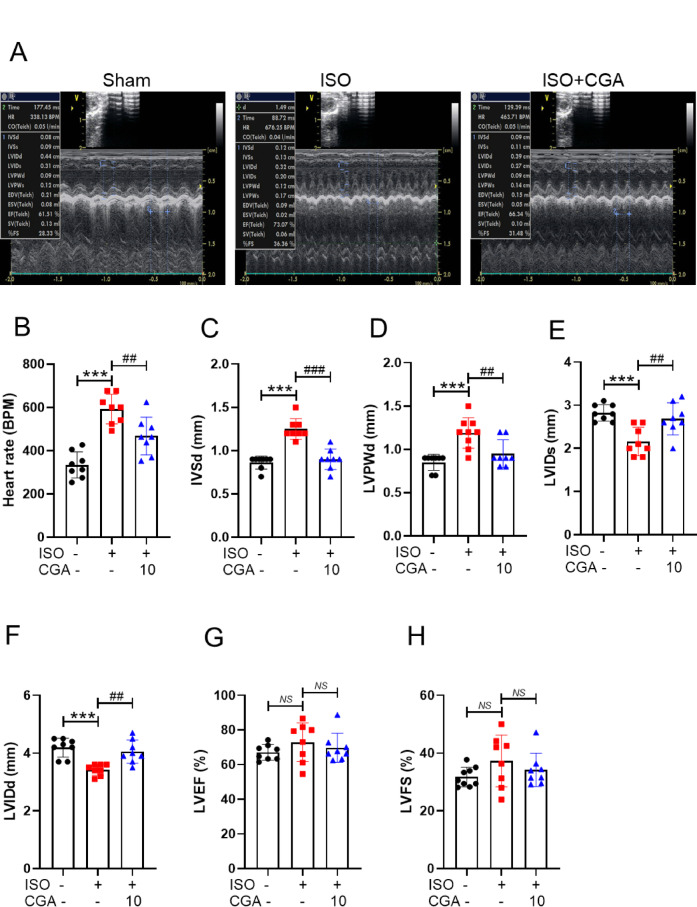
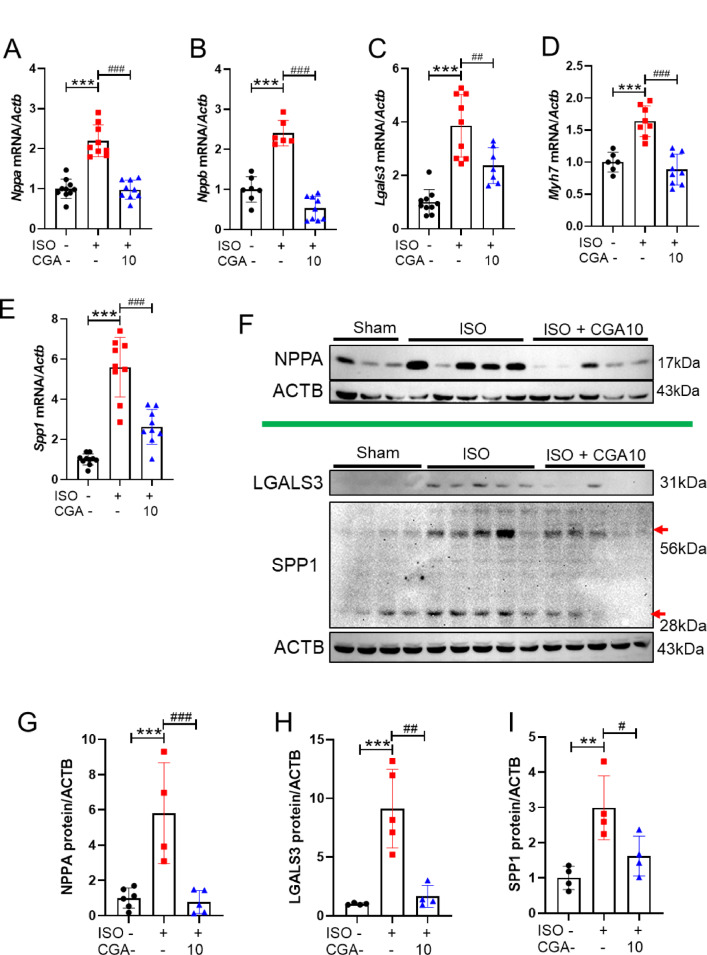
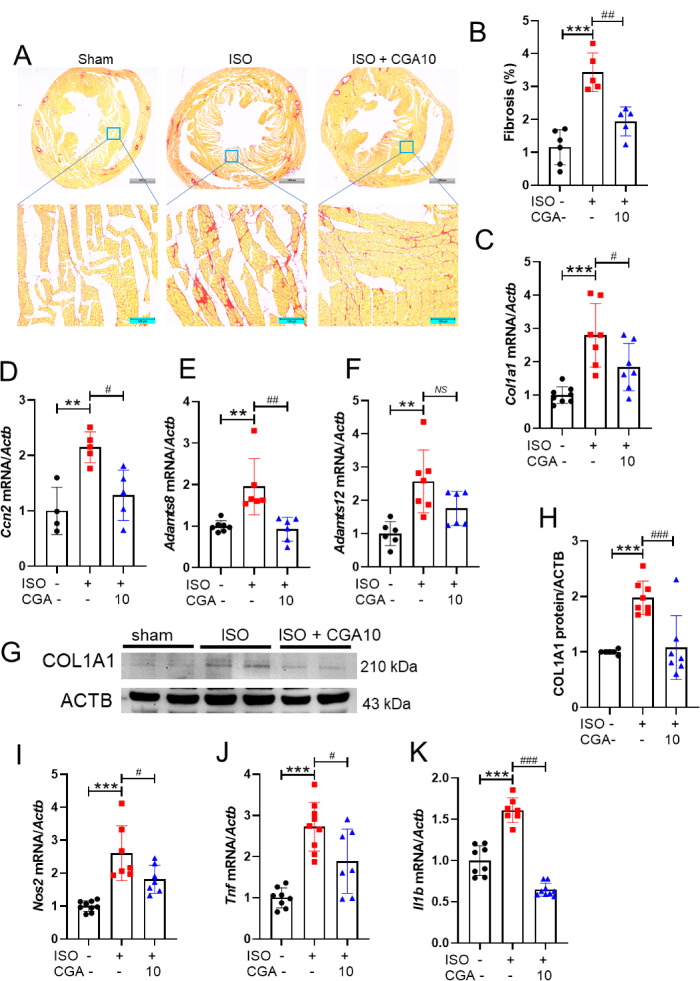
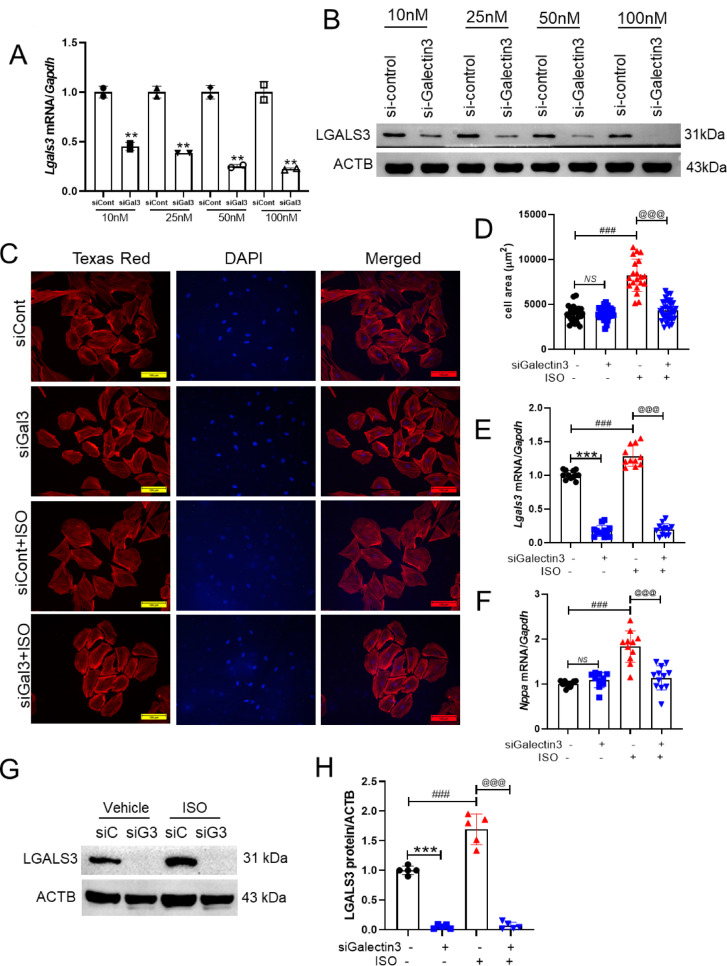
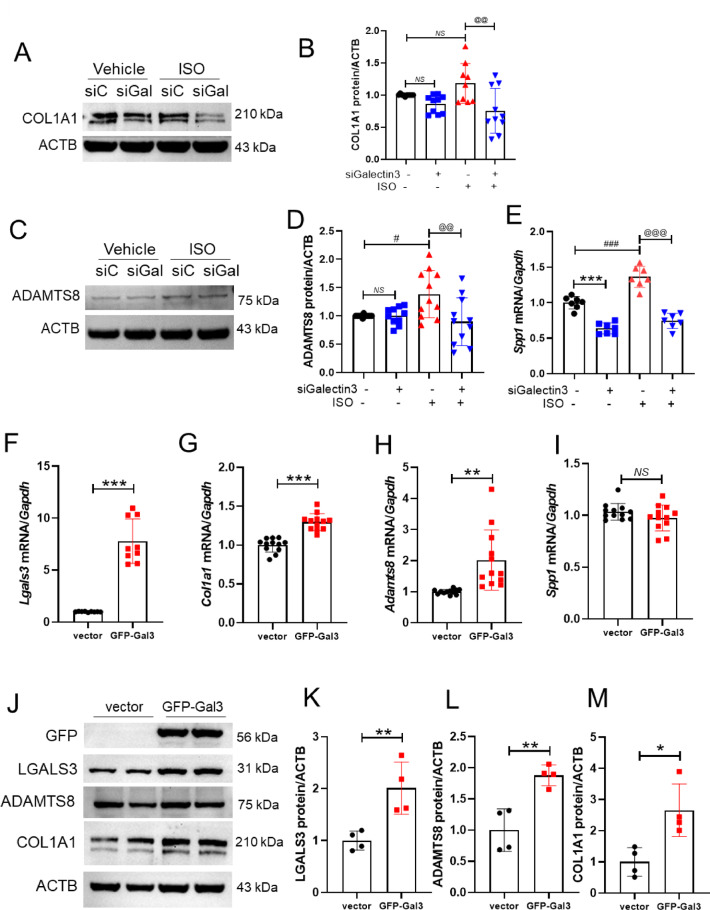
Chlorogenic acid, an ester of caffeic acid and quinic acid, is found in foods such as eggplant and peaches. Its role in heart disease remains poorly understood. This study investigated whether chlorogenic acid affects cardiac hypertrophy and fibrosis in animal and cellular models of isoproterenol-induced cardiac hypertrophy. Treatment of isoproterenol-stimulated cardiomyocytes with chlorogenic acid reduced cell size and the expression levels of cardiac hypertrophy-related genes. In the animal model, isoproterenol was delivered via an osmotic minipump for 2 weeks to induce cardiac hypertrophy, and chlorogenic acid was intraperitoneally administered for the same duration. Echocardiographic analysis showed that chlorogenic acid significantly reduced wall thickness in mice. Picrosirius red staining, quantitative reverse transcription polymerase chain reaction, and Western blot analysis revealed that cardiac fibrosis was attenuated by chlorogenic acid. Chlorogenic acid treatment downregulated galectin 3 (Lgals3), a fibrosis-associated gene that had been upregulated by isoproterenol stimulation. Galectin 3 knockdown ameliorated isoproterenol-induced cardiac hypertrophy and reduced the expression levels of COL1A1 and ADAMTS8; galectin 3 overexpression increased cardiomyocyte size and upregulated COL1A1 and ADAMTS8 expression levels. These findings suggest that chlorogenic acid could serve as a novel treatment for cardiac hypertrophy and fibrosis via downregulation of galectin 3.

Keywords: A disintegrin and metalloproteinase with thrombospondin motifs 8; Cardiac hypertrophy; Chlorogenic acid; Fibrosis; Galectin 3.


Conflict of interest statement

Declarations. Competing interests: The authors declare no competing interests.

Figures

Fig. 1
Fig. 1
Chlorogenic acid attenuated cardiac hypertrophy in H9c2 cells. (A) Chemical structure of chlorogenic acid. (B) Cell viability following treatment with chlorogenic acid (010 μM for 24 h). (C) Representative images of H9c2 cells stained with Texas Red™-X Phalloidin after isoproterenol treatment (10 μM, 24 h) with or without chlorogenic acid (0.1 μM, 24 h). Scale bar = 100 μm. (D) Quantification of cell size. (E) Cytotoxicity under the same conditions as in (C). (F–H) mRNA expression levels of Nppa, Nppb, and Myh7 in H9c2 cells treated with isoproterenol (10 μM) with or without chlorogenic acid (0.1 μM) for 9 h. Gapdh was used for normalization. (I) Cytotoxicity under the same conditions as in (F–H). ***P < 0.001; ###P < 0.001. ISO; isoproterenol, CGA; chlorogenic acid, DAPI; 4’,6-diamidino-2-phenylindole.
Fig. 2
Fig. 2
Chlorogenic acid prevented cardiac hypertrophy in a mouse model of isoproterenol-induced cardiac hypertrophy. (A) Representative gross heart image. Scale on the ruler represents 1 mm. (B–C) Heart weight-to-body weight ratio and heart weight-to-tibia length ratio in three animal groups (n = 9–10 per group). ***P < 0.001; ###P < 0.001. (D) Representative H&E-stained heart tissues (n = 5–6 per group). Top panel: Low magnification (Scale bar = 1000 μm). Bottom panel: High magnification (Scale bar = 50 μm). (E) Quantification of cardiomyocyte area in heart tissues (n = 5–6 per group). (F) Representative wheat germ agglutinin-stained heart tissues. Top panel: Low magnification (Scale bar = 1000 μm). Bottom panel: High magnification (Scale bar = 50 μm). ***P < 0.001; ###P < 0.001. ISO; isoproterenol, CGA; chlorogenic acid.
Fig. 3
Fig. 3
Chlorogenic acid improved cardiac remodeling in isoproterenol-induced cardiac hypertrophy. (A) Representative M-mode echocardiographic images of the sham, isoproterenol, and isoproterenol + chlorogenic acid groups (n = 8 per group). (B–H) Quantification of echocardiographic parameters. IVSd (mm): interventricular septum thickness; LVPWd (mm): left ventricular posterior wall thickness; LVIDs (mm): left ventricular internal diameter at systole; LVIDd (mm): left ventricular internal diameter at diastole; LVFS (%): fractional shortening; LVEF (%): ejection fraction. ***P < 0.001; ##P < 0.01 and ###P < 0.001. ISO; isoproterenol, CGA; chlorogenic acid.
Fig. 4
Fig. 4
Chlorogenic acid attenuated cardiac hypertrophy-related gene expression in isoproterenol-induced cardiac hypertrophy mice. (A–E) mRNA expression levels of Nppa, Nppb, Lgals3, Myh7, and Spp1 in heart tissues, measured by qRT-PCR (n = 6–10 per group). Actb was used for normalization. (F) Western blot images of the three experimental groups. ACTB was used as a loading control. The blots above and below the green line are different gels. (G − I) Protein levels were quantified using ImageJ software (n = 4–6 per group). **P < 0.01 and ***P < 0.001; #P < 0.05, ##P < 0.01, and ###P < 0.001. ISO; isoproterenol, CGA; chlorogenic acid.
Fig. 5
Fig. 5
Chlorogenic acid suppressed isoproterenol-induced cardiac fibrosis and inflammation in mice. (A) Representative picrosirius red-stained images of heart tissues. Top: Low magnification (Scale bar = 1000 μm). Bottom: High magnification (Scale bar = 50 μm). Pink staining indicates collagen deposition. (B) Quantification of cardiac fibrosis in low-magnification images (n = 5 per group). (C–F) mRNA levels of Col1a1, Ccn2, Adamts8, and Adamts12 were measured in heart tissues by qRT-PCR (n = 4–8 per group). (G and H) Representative Western blot images of COL1A1 in heart tissues (n = 6–8 per group). (I–J) mRNA expression levels of Nos2, Tnf, and Ilb in heart tissues, measured by qRT-PCR (n = 7–9 per group). **P < 0.01 and ***P < 0.001; #P < 0.05, ##P < 0.01, and ###P < 0.001. ISO; isoproterenol, CGA; chlorogenic acid.
Fig. 6
Fig. 6
Galectin 3 knockdown reduced isoproterenol-induced cardiomyocyte hypertrophy. (A–B) Galectin 3 mRNA and protein expression after galectin 3 knockdown at 10–100 nM concentrations. (C) Representative fluorescence microscopy images of H9c2 cells stained with Texas Red™-X Phalloidin. Cardiomyocytes were treated as follows: control siRNA (siCont), Galectin 3 siRNA (siGal3), control siRNA with isoproterenol (siCont + ISO), and Galectin 3 siRNA with isoproterenol (siGal3 + ISO). Red color indicates F-actin in the cytoskeleton; blue color indicates cell nuclei. Scale bar = 100 μm. (D) Quantification of cell surface area for each group shown in C. (E–F) Galectin 3 was silenced and stimulated with isoproterenol in H9c2 cells. mRNA levels of Lgals3 and Nppa were measured by RT-PCR. Gapdh was used for normalization. (G–H) Representative Western blot analysis of LGALS3 expression in H9c2 cells transfected with siCont or siGal3, with or without isoproterenol treatment (10 μM for 24 h). **P < 0.01 and ***P < 0.001; ###P < 0.001; @@@P < 0.001. ISO; isoproterenol, CGA; chlorogenic acid.
Fig. 7
Fig. 7
Galectin 3 regulated COL1A1 and ADAMTS8 in cardiomyocytes. (A–D) Western blot analysis of COL1A1 and ADAMTS8 in galectin 3-transfected cells in the presence or absence of isoproterenol (10 μM). ACTB was used as a loading control. B and D show quantification of COL1A1 and ADAMTS8 expression. (E) Spp1 mRNA levels in Galectin 3 siRNA-transfected H9c2 cells in the presence or absence of isoproterenol (10 μM for 24 h). (F–I) mRNA levels of Lgals3, Col1a1, Adamts8, and Spp1 in pCMV3-N-GFPSpark-galectin 3-transfected H9c2 cells. (J–M) Representative immunoblots and quantification in H9c2 cells with galectin 3 overexpression. *P < 0.05, **P < 0.01, and ***P < 0.001; #P < 0.05 and ###P < 0.001; @@P < 0.01 and @@@P < 0.001. ISO; isoproterenol.
Fig. 8
Fig. 8
Galectin 3 overexpression increased cardiomyocyte size. (A–B) Representative images of cells overexpressing pCMV3-N-GFPSpark-galectin 3 and quantification of cell size. Green fluorescence indicates GFP expression. Each merged image represents a combination of the three individual channels. Scale bar = 100 μm. (C) Nppa mRNA levels in galectin 3-overexpressing cells. (D–E) Representative immunoblot images and quantification of NPPA expression in galectin 3-overexpressing cells. **P < 0.01 and ***P < 0.001. GFP; green fluorescent protein. (F) Schematic diagram of the proposed mechanism showing how chlorogenic acid regulates cardiac hypertrophy and fibrosis.

References

    1. Yang, F. et al. Chlorogenic acid inhibits liver fibrosis by blocking the miR-21-regulated TGF-beta1/Smad7 signaling pathway in vitro and in vivo. Front. Pharmacol.8, 929. 10.3389/fphar.2017.00929 (2017). - PMC - PubMed
    1. Gupta, A., Atanasov, A. G., Li, Y., Kumar, N. & Bishayee, A. Chlorogenic acid for cancer prevention and therapy: Current status on efficacy and mechanisms of action. Pharmacol. Res.186, 106505. 10.1016/j.phrs.2022.106505 (2022). - PubMed
    1. Hwang, S. J., Kim, Y. W., Park, Y., Lee, H. J. & Kim, K. W. Anti-inflammatory effects of chlorogenic acid in lipopolysaccharide-stimulated RAW 2647 cells. Inflamm. Res.63(1), 81–90. 10.1007/s00011-013-0674-4 (2014). - PubMed
    1. Liang, N. & Kitts, D. D. Role of chlorogenic acids in controlling oxidative and inflammatory stress conditions. Nutrients10.3390/nu8010016 (2015). - PMC - PubMed
    1. He, K., Wang, X., Li, T., Li, Y. & Ma, L. Chlorogenic acid attenuates isoproterenol hydrochloride-induced cardiac hypertrophy in AC16 cells by inhibiting the Wnt/beta-catenin signaling pathway. Molecules10.3390/molecules29040760 (2024). - PMC - PubMed

MeSH terms

LinkOut - more resources