. 2025 Jul 24;5(1):309.
doi: 10.1038/s43856-025-01024-0.

Simultaneous expression of epithelial and immune cell markers in circulating tumor cells identified in patients with stage 4 breast cancer

Affiliations

Simultaneous expression of epithelial and immune cell markers in circulating tumor cells identified in patients with stage 4 breast cancer

Nikki Higa et al. Commun Med (Lond). .

Abstract

Background: Heterogeneous circulating tumor cells (CTCs) have been implicated in the formation of new metastases. However, circulating cells expressing both tumor and immune cell proteins are often dismissed as insignificant findings in CTC studies.

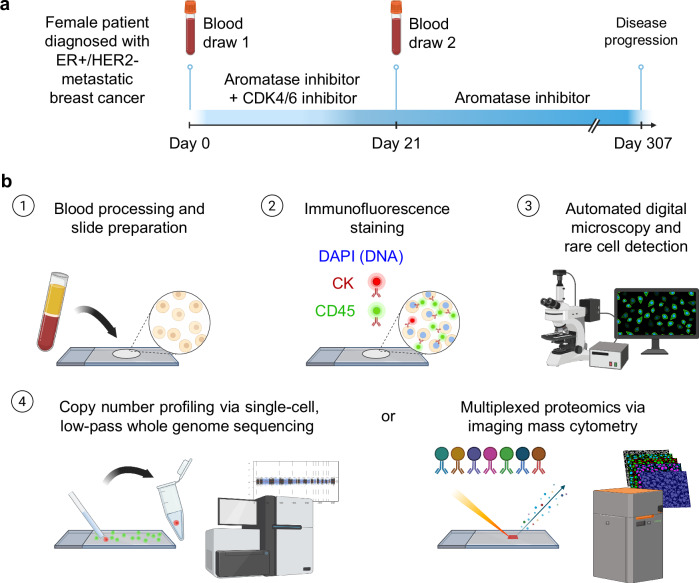
Methods: Two non-contemporaneous blood samples from a metastatic breast cancer patient were analyzed using an enrichment-free platform to identify canonical, epithelial-only CTCs (CD45-/cytokeratin + , epi.CTCs) and CD45 + /cytokeratin+ immune-like CTCs (im.CTCs). Single cells from both samples were subjected to copy number and protein expression profiling. A cohort of 36 metastatic breast cancer patients was then analyzed to search for additional cases with im.CTCs.

Results: Here, we identified and characterized a population of CTCs exhibiting an immune-like state. In two samples from an index patient, im.CTCs outnumbered epi.CTCs, comprising >97% of the CTC population. Single-cell copy number analysis of 43 im.CTCs and 30 epi.CTCs revealed clonal alterations across both populations, confirming a shared tumor origin. Furthermore, im.CTCs contained pseudo-diploid profiles that did not reflect dilution from the addition of a normal diploid genome, indicating that they were unlikely to have originated from tumor-immune cell fusion. Protein expression analysis showed that im.CTCs express CD45 as well as other immune-related markers, such as CD3 and CD4, and the cancer stemness marker, CD44. Subsequent analysis of a metastatic breast cancer cohort identified an additional patient harboring im.CTCs with the same tumor-derived, non-fusion genome as in the index case.

Conclusions: Collectively, these genomic and proteomic features distinguish im.CTCs from previously reported circulating cells may represent a novel form of tumor cell plasticity.

Plain language summary

Tumor cells are known to take on features that allow them to survive and move to new sites. This variation can make it difficult to distinguish them from other cells in the blood. Using a platform to profile rare cells in blood samples, we identified a population of cells expressing cancer and immune cell proteins in a breast cancer patient. Genomics data confirmed that these cells originated from the tumor and that they were different from another cell type sharing a similar protein expression pattern. We analyzed additional samples and found a second patient with these immune-like tumor cells. These findings support the existence of a cancer-immune state that might play a role in helping tumor cells spread.


Conflict of interest statement

Competing interests: P.K. and J.H. hold and receive royalties from Epic Sciences for licensed technology. Epic Sciences and the University of Southern California, USC Michelson Center (P.K. and J.H.), have signed a sponsored research agreement to advance next-generation liquid biopsy technology for precision oncology. All other authors have no conflicts to report.

Figures

Fig. 1
Fig. 1. Case study overview.
a Patient’s clinical and sample collection timeline. b Overview of the HDSCA workflow. Following blood processing and cell plating, slides are stained with immunofluorescent antibodies and imaged to identify candidate cells for downstream analysis. Slides can either be used for single-cell copy number analysis or multiplexed proteomics profiling.
Fig. 2
Fig. 2. CD45+ and CD45- CTCs were detected in the index patient.
a CD45+ CTCs and b classical CD45- CTCs. Composite images are displayed to the left of the individual channel images (color code: blue = DAPI, red = CK, green = CD45; scale bar = 10 μm). c Enumeration of CD45+ and CD45- CTCs from two serial blood draws.
Fig. 3
Fig. 3. Copy number analysis of im.CTCs and epi.CTCs.
a Heatmap of copy number profiles for 77 single cells (43 im.CTCs, 30 epi.CTCs, 4 WBCs). Copy number ratios for 5000 genomic bins spanning chromosome 1 to chromosome Y are represented by the color scale at the right, with gains in red and losses in blue. Cell type and draw number are annotated on the left side of the heatmap. b Overlay of averaged copy number profiles across all epi.CTCs (gray) and im.CTCs (green) sequenced. c Comparison of copy number profiles for an epi.CTC (gray) versus a synthetic tumor-WBC hybrid (green) formed by cell fusion. Fusion cell profile was synthetically generated by combining profiles of a single epi.CTC and a single WBC from the index patient. Bin read counts for each individual cell were summed, corrected for GC-content, and then used to determine new bin ratios for the combined profile.
Fig. 4
Fig. 4. Comparison of CTC proteomic profiles.
a Heatmap of proteomic expression profiles for epi.CTCs and im.CTCs. Cell type and draw number are annotated at the top. Arcsinh-transformed color scale was used to display ion counts. b Distributions of individual marker expression in epi.CTCs (gray) compared to im.CTCs (green). Ion counts are displayed with arcsinh-transformed x-axes. c Spearman correlation matrix displaying pairwise relationships between immune-related markers, CD44, vimentin, and Ki67.
Fig. 5
Fig. 5. Comparison of im.CTC and WBC proteomic profiles.
a UMAP projection constructed from immune marker expression profiles of gated WBC populations and im.CTCs. b Distributions of cancer and immune marker expression across WBCs compared to im.CTCs. Ion counts are displayed with arcsinh-transformed x-axes. Colors correspond to cell types from the legend in (a). c Scatter plot of CD45RO versus CD45RA expression in im.CTCs, indicated as green dots. The density plot in the background was generated from the CD3 + T-cell population for comparison. Ion counts are displayed with arcsinh-transformed axes.
Fig. 6
Fig. 6. Copy number analysis of CTC candidates from two additional metastatic breast cancer patients.
a Heatmaps of copy number profiles for 15 single cells (7 im.CTCs, 6 epi.CTCs, 2 WBCs) from patient #2. b Overlay of individual profiles for epi.CTC and im.CTC candidates from patient #2. One im.CTC with multiple regions of copy number loss is not shown. c Heatmaps of copy number profiles for 17 single cells (9 im.CTCs, 5 epi.CTCs, 3 WBCs) from patient #3.

References

    1. Lin, D. et al. Circulating tumor cells: biology and clinical significance. Signal Transduct. Target Ther.6, 404 (2021). - PMC - PubMed
    1. Welter, L. et al. Cell state and cell type: deconvoluting circulating tumor cell populations in liquid biopsies by multi-omics. Cancers15, 3949 (2023). - PMC - PubMed
    1. Chai, S. et al. Identification of epithelial and mesenchymal circulating tumor cells in clonal lineage of an aggressive prostate cancer case. NPJ Precis. Oncol.6, 41 (2022). - PMC - PubMed
    1. Yu, M. et al. Circulating breast tumor cells exhibit dynamic changes in epithelial and mesenchymal composition. Science339, 580–584 (2013). - PMC - PubMed
    1. Cheng, Y. H. et al. Hydro-Seq enables contamination-free high-throughput single-cell RNA-sequencing for circulating tumor cells. Nat. Commun.10, 2163 (2019). - PMC - PubMed

LinkOut - more resources