. 2025 Jul 24;24(1):300.
doi: 10.1186/s12933-025-02865-8.

Interpretable machine learning-guided single-cell mapping deciphers multi-lineage pancreatic dysregulation in type 2 diabetes

Affiliations

Interpretable machine learning-guided single-cell mapping deciphers multi-lineage pancreatic dysregulation in type 2 diabetes

Xueqin Xie et al. Cardiovasc Diabetol. .

Abstract

Background: Pancreatic cellular heterogeneity is fundamental to systemic metabolic regulation, yet its pathological remodeling in diabetes remains poorly characterized.

Methods: We integrated single-cell RNA sequencing with machine learning frameworks to decode pancreatic heterogeneity. Novel tools included PanSubPred (two-stage feature selection/XGBoost classifier) for multi-lineage annotation and PSC-Stat (XGBoost/Gini optimization) for stellate cell activation analysis.

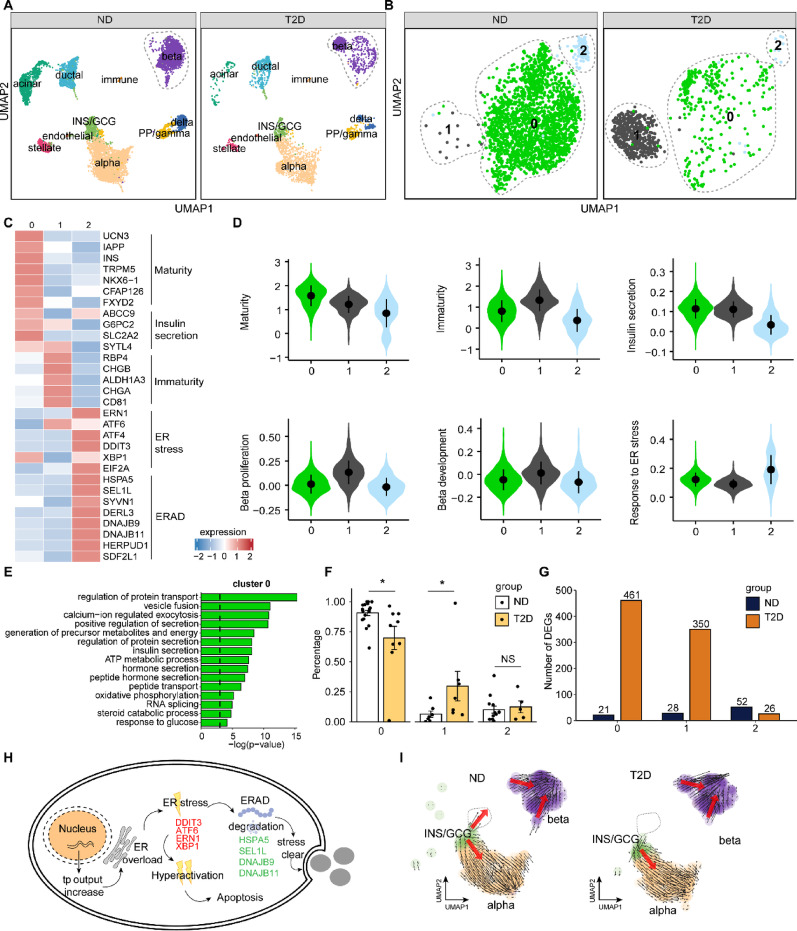
Results: By establishing PanSubPred, we systematically decoded pancreatic cellular diversity, identifying 64 cell-type-specific markers (38 novel) that maintained cross-dataset accuracy (AUC > 0.970) even after excluding known canonical markers. Building on this annotation precision, we developed PSC-Stat to quantify stellate cell activation dynamics, revealing their progressive activation from diabetes to pancreatic cancer (activated/quiescent ratio: control: 1.44 ± 1.02, diabetes: 4.72 ± 4.01, pancreatic cancer: 18.67 ± 18.70). Diabetes reorganized intercellular communication into ductal-centric hubs via FGF7-FGFR2/3, EFNB3-EPHB2/4/6 and EFNA5-EPHA2 axes, from which we derived a 15-gene signature for diabetic ductal cells (AUC = 0.846). Beta cell heterogeneity analysis uncovered diabetes-associated depletion of mature insulin-secretory clusters (INS + NKX6-1+), expansion of immature (CD81 + RBP4+) and endoplasmic reticulum stress-adapted subtypes (DDIT3 + HSPA5+). Moreover, non-beta lineages exhibited parallel dysfunction: acinar cells shifted toward inflammatory states (CCL2 + CXCL17+), while ductal cells adopted secretory phenotypes (MUC1 + CFTR+).

Conclusions: This study presents a machine learning-based single-cell framework that systematically maps pancreatic cellular alterations in diabetes. The identified novel signatures, stellate activation dynamics, and beta cell maturation trajectories may serve as potential targets for diabetic management and pancreatic cancer risk stratification.

Keywords: Beta cell dysfunction; Machine learning; Pancreatic cellular heterogeneity; Single-cell transcriptomics; Stellate cell activation; Type 2 diabetes.


Conflict of interest statement

Declarations. Ethics approval and consent to participate: Not applicable. Consent for publication: Not applicable. Competing interests: The authors declare no competing interests.

Figures

Fig. 1
Fig. 1
Construction and characterization of PanSubPred. A Summary of the PanSubPred method. B Clustering of gene expression profiles of pancreatic islet cells, using cell labels predicted by PanSubPred. C The heatmap of 64 genes in seven pancreatic cell types reveals the cell-type-specific genes (left). The normalized expression level for CELA3A, GC and COL6A2 genes for each cell projected onto UMAP coordinates (right). D The dot plot of 64 genes in different pancreatic cell subpopulations reveals the cell-type-specific genes. E Pathway enrichment analysis of 64 pancreas marker genes. Pathways were ordered by statistical significance (p-value). The Black dashed line represents the statistical significance threshold (p-value < 0.05)
Fig. 2
Fig. 2
Construction and evaluation of PSC-Stat. A The violin plot of 17 stellate-cell-specific genes showed that 14 genes of them were differentially expressed between qPSCs and aPSCs. The statistical significance was as such: ns: p-value > 0.05; *: p-value < 0.05; **: p-value < 0.01; ***: p-value < 0.001; ****: p-value < 0.0001, two-sided Wilcoxon rank-sum test. B Summary of the PSC-Stat framework. C The performance comparison of three classifier algorithms-based models with all 17 genes on 5-fold CV of training set. D The IFS curve of the 17 genes from analysis of Gini, ANOVA, and MIC based on the XGBoost algorithm with 5-fold CV. E The importance scores of the top 15 genes based on gini impurity. F The ROC curve of PSC-Stat for different datasets. G Fang scRNA‑seq data projected on the Azimuth reference (top) and the corresponding cell type annotation prediction score displayed on dimensional reduction plot (bottom). H aPSC/qPSC ratio difference between ND (n = 9) and T2D (n = 4) individuals. two-sided Student’s t-test. I aPSC/qPSC ratio difference among ND (n = 9), T2D (n = 4) and PDAC (n = 14) individuals. two-sided Student’s t-test
Fig. 3
Fig. 3
Analysis of cell-cell communication among pancreatic cells in ND and T2D. A Circle plot of intercellular communication patterns among seven pancreatic cell subsets in ND (left) and T2D (right), respectively. The outermost ring colors represent the seven distinct cell types. The inner ring colors indicate whether the cell is acting as a sender (ligand-expressing, in red) or a receiver (receptor-expressing, in blue). Each arc represents an inferred communication from a ligand-expressing cell to a receptor-expressing cell, representing the inferred signal directionality. The color of the arc corresponds to the sender cell type, and the color gradient from light to dark reflects the strength of the communication score between the interacting cell pairs. B Sankey plot showing the ligand–receptor–transcription factor (L–R–TF) signaling cascade from beta cells (sender) to ductal cells (receiver) under T2D conditions, in which ligands are expressed in beta cells and both receptors and TFs are in ductal cells. The three columns from left to right represent ligands (sender), receptors (receiver), and TFs, respectively. And the coloring of the genes is only intended to improve readability. Each complete stream indicates a distinct signaling pathway involving a L–R–TF signaling. The color of the stream on the left and right sides are consistent with ligand and receptor respectively, allowing the flow of information through the pathway to be visually tracked. C The communication network from other cells to ductal cells in T2D patients. Select ligand-receptor axes with a communication score greater than 0.5 for visualization. D Venn diagram showing the overlap of target genes associated with 6 key TFs in ductal cells (TGs) and two disease-specific pathways (PGs). E Venn diagram showing the shared genes in ductal cells between the Fang et al. (discovery) and Segerstolpe et al. (validation) datasets. F The performance comparison of four classifier algorithms-based models with the shared 77 genes on training set. G The IFS curve of gene selection using LR and four feature selection methods on training set. The black dotted line represents the top 15 genes selected by GBDT. H The importance scores of the top 15 genes selected by GBDT. I The ROC curve of the model with the top 15 genes on training, internal testing and external validating Segerstolpe dataset
Fig. 4
Fig. 4
scRNA-seq analysis reveals changes in beta cell heterogeneity promoted by T2D. A Unsupervised clustering of single-cell transcriptome visualized with UMAP analysis. Data represent pancreatic islet cells from ND (n = 6,284 cells pooled from 19 donors) or T2D (n = 3,083 cells pooled from 9 donors). B Projection of beta cells (n = 2,793) from both ND and T2D using UMAP analysis. C Normalized expression values for key beta cell maturation, immaturity, insulin secretion, endoplasmic reticulum (ER) stress and ER-associated degradation (ERAD) compared among different beta cell clusters. D Cell scores for selected gene sets, including beta cell maturity, immaturity, insulin secretion, beta cell development, beta cell proliferation and response to ER stress. The central error bars in the violin plot indicate the mean and standard deviation (mean ± sd) of the data distribution. E Enrichment of GO terms ordered by statistical significance in cluster 0 beta enriched genes. Dashed line represents p-value < 0.05. F Frequency of beta cluster cells in ND and T2D donors, with cluster 0 (ND n = 19, T2D n = 9), cluster 1 (ND n = 7, T2D n = 7), and cluster 2 (ND n = 13, T2D n = 5). Data shown are the mean ± s.e.m. *p value < 0.05, two-sided Wilcoxon rank-sum test. G Significant differential enriched genes in each beta cluster of ND and T2D individuals. H Summarized map of beta cell heterogeneity and loss. Tp: transcriptional. I RNA-velocity analysis of ND and T2D INS/GCG, alpha-/beta-cells. Black streamline arrows represent predicted direction of cell state change and trajectories. Larger red arrows represent overall velocity for each area of the UMAP
Fig. 5
Fig. 5
Functional and molecular heterogeneity in non-beta pancreatic cells. A Projection of two acinar subpopulations from ND and T2D using UMAP analysis. B The differentially expressed genes between acinar clusters 0 and 1 indicate enrichment patterns, with upregulated genes representing those enriched in cluster 0 and downregulated genes corresponding to those enriched in cluster 1. Significance threshold: adjusted p-value < 0.05 and|logFC| >1. C Bar plot showing the proportion of each acinar 0/1 subpopulation in ND and T2D. Each condition is color-coded as indicated. D Enrichment of GO terms and associated genes significantly enriched in acinar clusters 0 and 1. E Projection of two ductal subpopulations from ND and T2D using UMAP analysis. F Bar plot showing the proportion of each ductal 0/1 subpopulation in ND and T2D. Each condition is color-coded as indicated. G Genes with significantly differential expression between subclusters of ductal subsets, with upregulated genes representing those enriched in cluster 0 and downregulated genes corresponding to those enriched in cluster 1. Significance threshold: adjusted p-value < 0.05 and|logFC| >1. H Pathway enrichment analysis of genes significantly enriched in ductal cell clusters 0 and 1. Dashed line represents p-value < 0.05. I Projection of three alpha subpopulations from ND and T2D using UMAP analysis. J Normalized expression values for key alpha cell identity/function, mitochondrial-associated, and cell proliferation-associated genes compared among different alpha cell clusters. K Comparison of GO enrichment analysis for genes enriched in alpha cell clusters 0 and 2. Dashed line represents p-value < 0.05

References

    1. Zhou Q, Melton DA. Pancreas regeneration. Nature. 2018;557(7705):351–8. - PMC - PubMed
    1. Logsdon CD, Ji B. The role of protein synthesis and digestive enzymes in acinar cell injury. Nat Reviews Gastroenterol Hepatol. 2013;10(6):362–70. - PMC - PubMed
    1. Nakajima K, Nemoto T, Muneyuki T, Kakei M, Fuchigami H, Munakata H. Low serum amylase in association with metabolic syndrome and diabetes: A community-based study. Cardiovasc Diabetol. 2011;10:34. - PMC - PubMed
    1. Saltiel AR, Kahn CR. Insulin signalling and the regulation of glucose and lipid metabolism. Nature. 2001;414(6865):799–806. - PubMed
    1. Adeva-Andany MM, Funcasta-Calderon R, Fernandez-Fernandez C, Castro-Quintela E, Carneiro-Freire N. Metabolic effects of glucagon in humans. J Clin Transl Endocrinol. 2019;15:45–53. - PMC - PubMed