. 2025 Jul 24;23(1):821.
doi: 10.1186/s12967-025-06852-1.

EphrinB2 alleviates tubulointerstitial fibrosis in diabetic kidney disease

Affiliations

EphrinB2 alleviates tubulointerstitial fibrosis in diabetic kidney disease

Lihua Ni et al. J Transl Med. .

Abstract

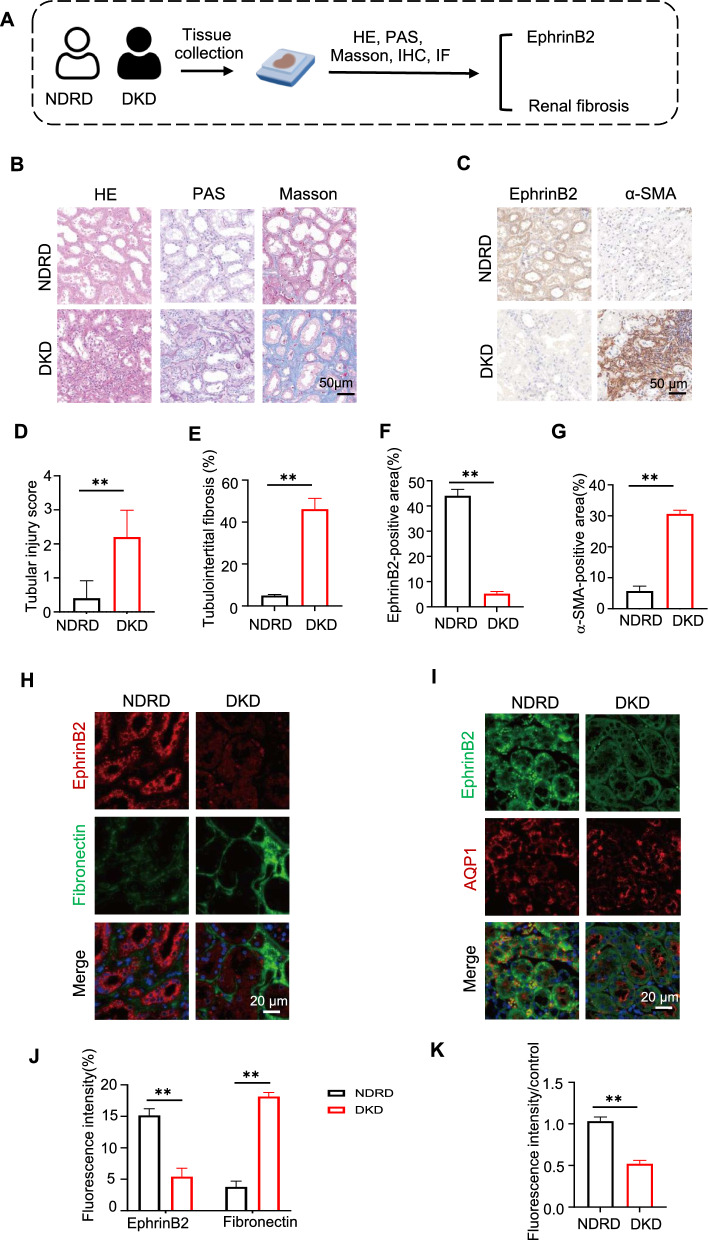
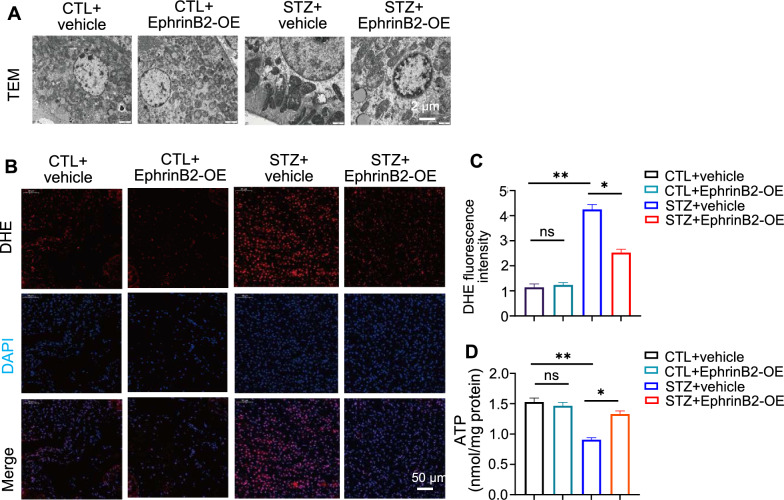
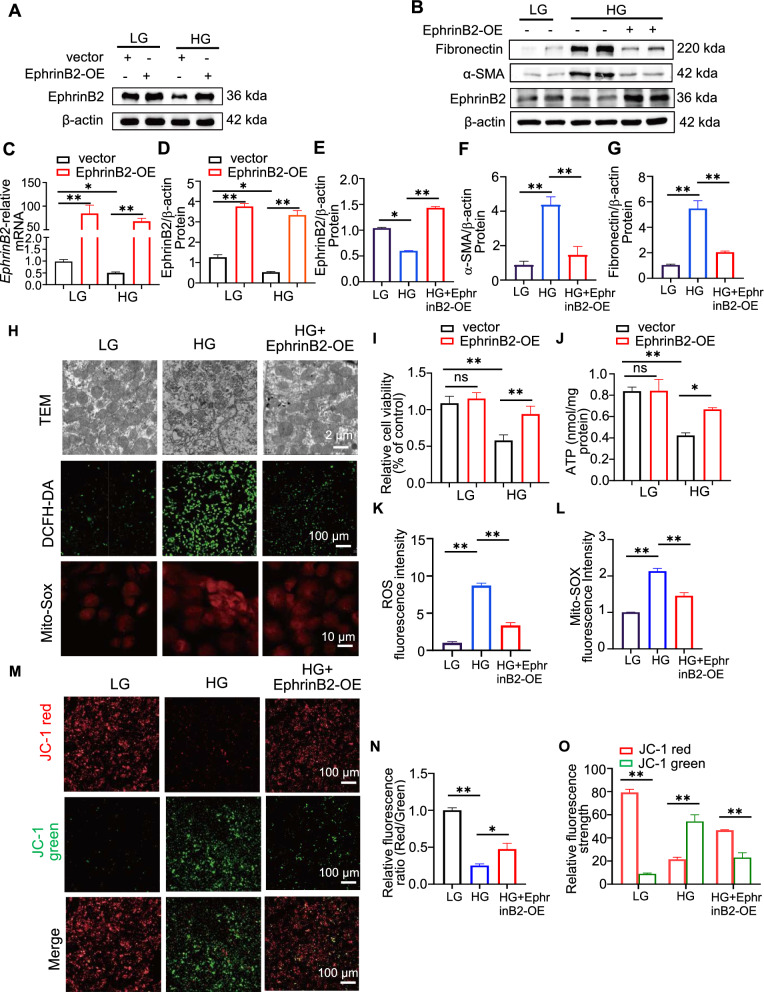
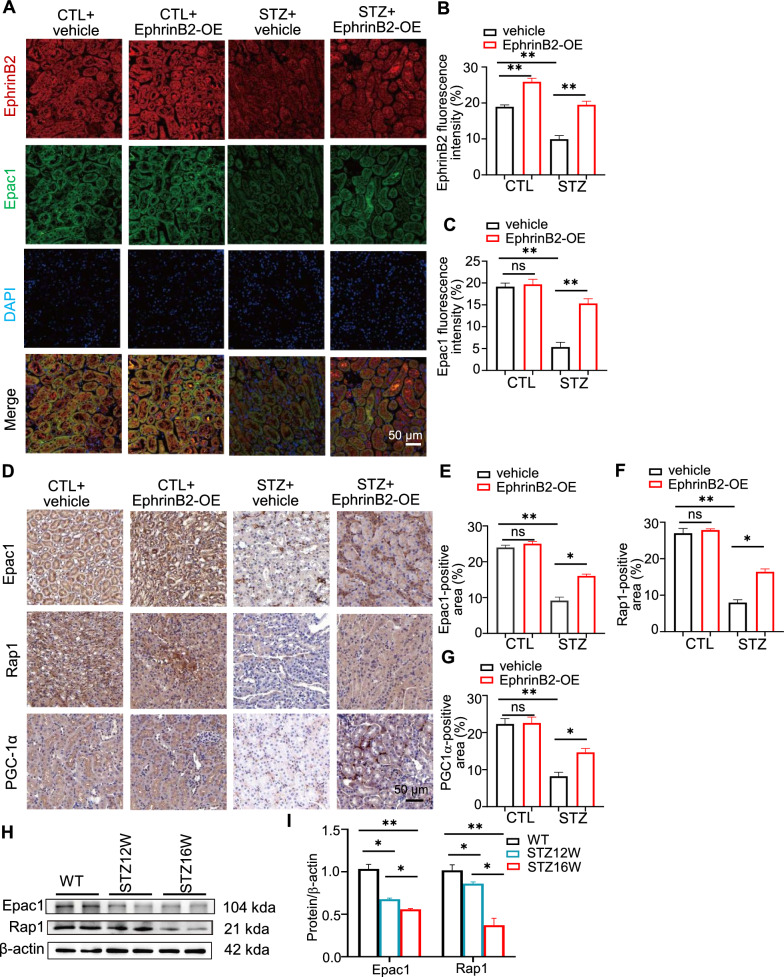
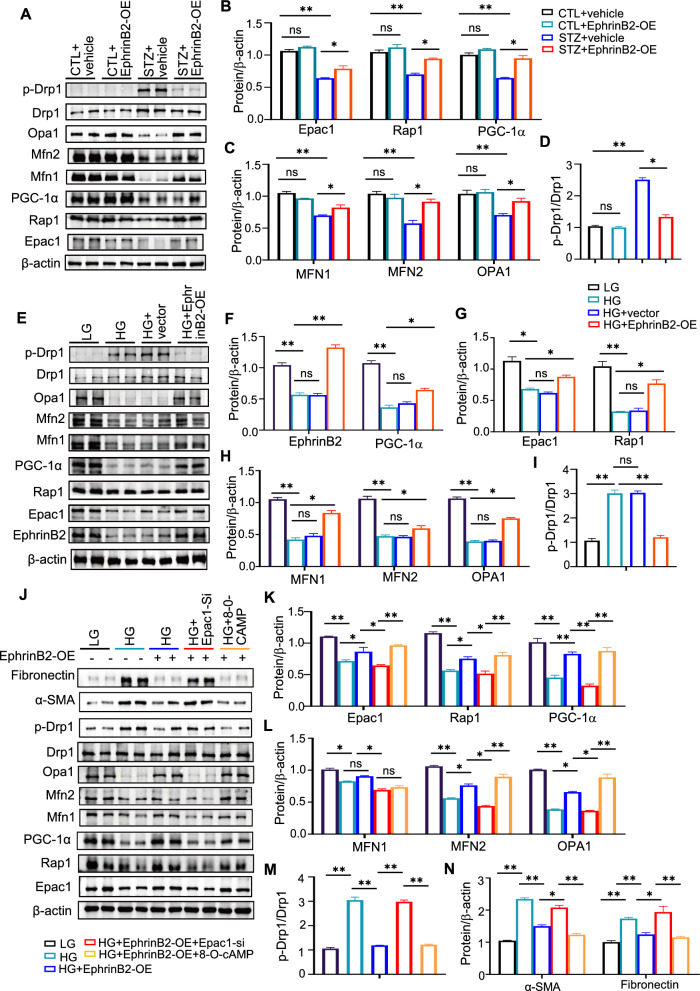
Background: Diabetic kidney disease (DKD) is characterized by progressive fibrosis, oxidative stress, and mitochondrial dysfunction, contributing to renal dysfunction. EphrinB2, a cell surface protein, has been implicated in tissue repair and fibrosis, but its role in DKD remains poorly understood. This study investigates the impact of EphrinB2 expression on renal fibrosis, mitochondrial dynamics, and cellular signaling pathways in DKD.

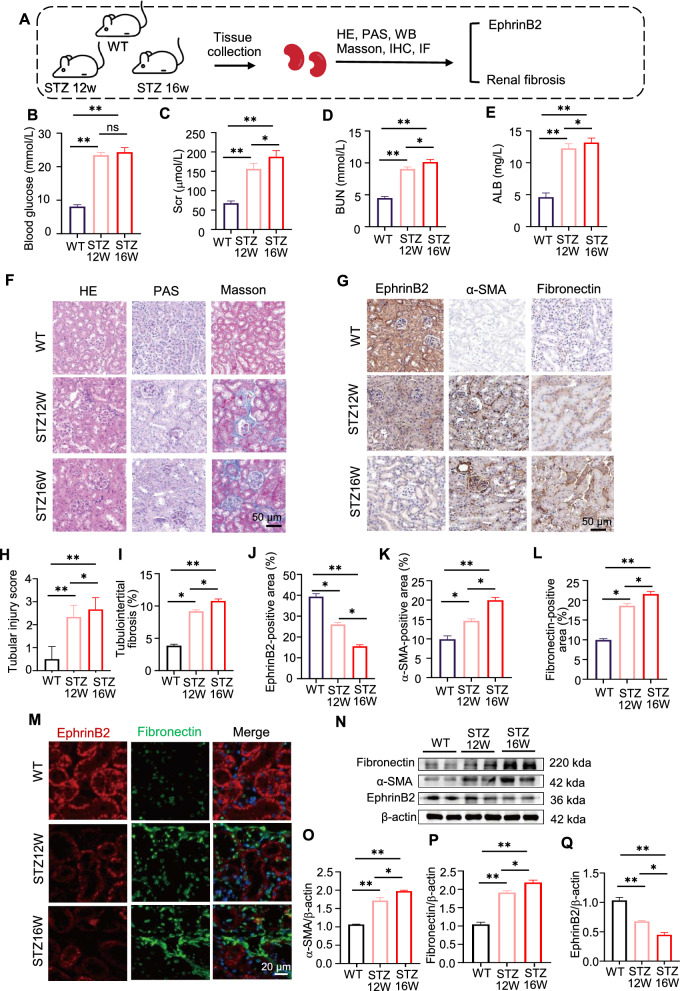
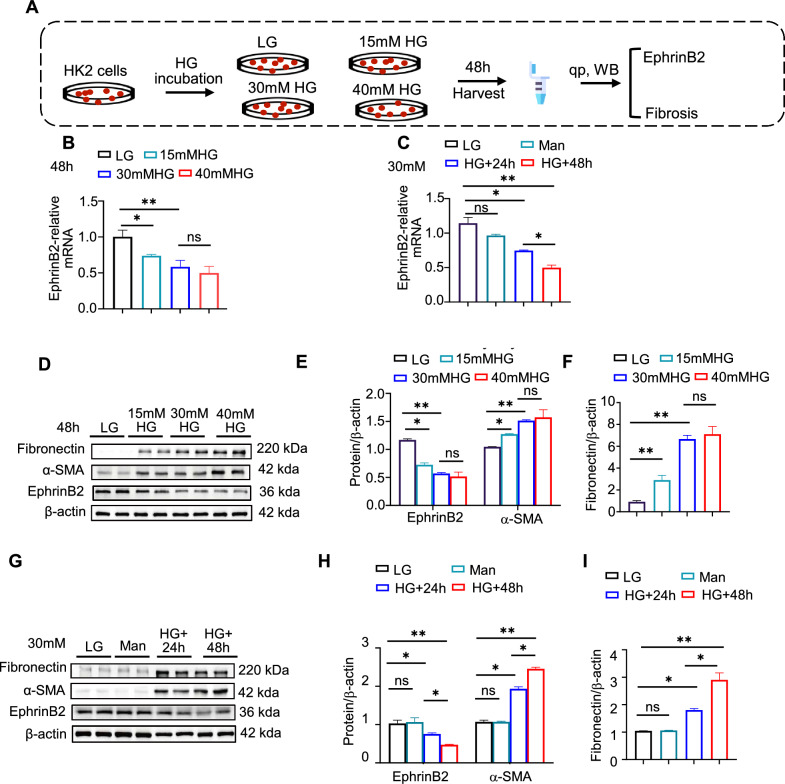
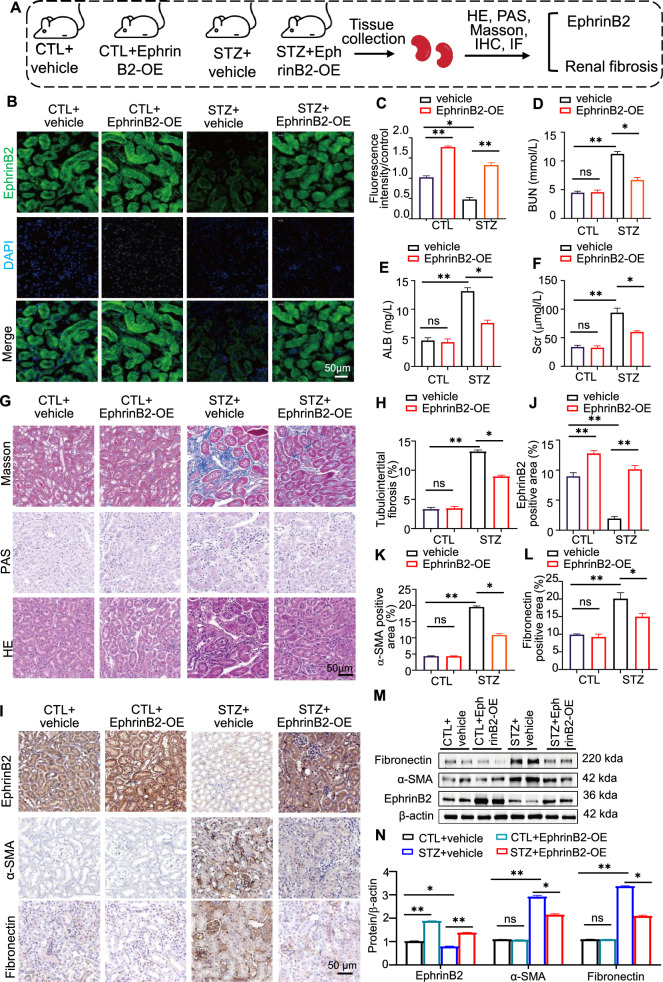
Methods: EphrinB2 expression and function were investigated in renal tissues from DKD patients, STZ-induced diabetic mice, and HG-treated HK-2 cells. EphrinB2 overexpression was achieved using AAV in vivo and lentiviral vectors in vitro. Functional assessments included histological and biochemical evaluations, while mechanistic studies utilized siRNA knockdown, pathway-specific inhibitors and activators, and co-immunoprecipitation to explore the role of the Epac1-Rap1 signaling pathway in EphrinB2-mediated antifibrotic and mitochondrial protective effects.

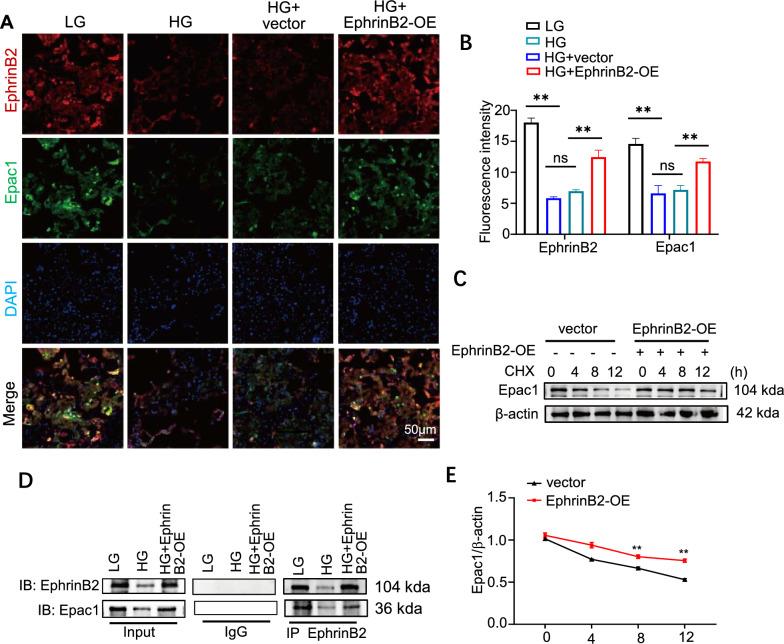
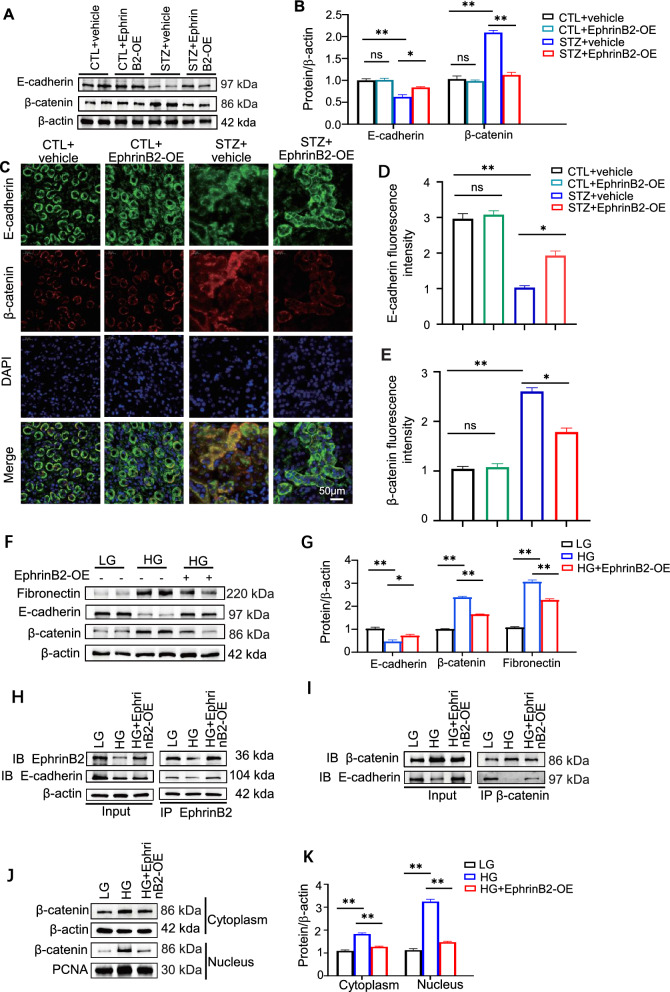
Results: EphrinB2 expression was significantly downregulated in the kidneys of DKD patients and STZ-induced diabetic mice, correlating with increased fibrosis and tubular injury. Overexpression of EphrinB2 (EphrinB2-OE) in diabetic mice restored renal function, reduced fibrosis, alleviated oxidative stress, and preserved mitochondrial structure. In HK-2 cells, EphrinB2-OE mitigated HG-induced fibrosis, reduced ROS levels, and restored MMP and ATP production. Mechanistically, EphrinB2-OE enhanced the Epac1-Rap1 pathway, stabilizing Epac1 protein and promoting mitochondrial biogenesis via PGC-1α. Additionally, EphrinB2-OE modulated the E-cadherin/β-catenin complex and preventing β-catenin nuclear translocation, and preserving epithelial integrity and epithelial-to-mesenchymal transition (EMT).

Conclusions: EphrinB2 exerts protective effects against renal fibrosis and dysfunction in diabetic conditions by regulating fibrosis pathways, mitochondrial dynamics, and epithelial stability. Targeting EphrinB2 signaling presents a promising therapeutic strategy for diabetic kidney disease.

Keywords: Diabetic kidney disease (DKD); Epac1-Rap1 signaling; EphrinB2; Mitochondrial dynamics; Oxidative stress; Renal fibrosis; β-catenin.


Conflict of interest statement

Declarations. Ethics approval and consent to participate: All experimental protocols were approved by the Clinical Trial Ethical Committee [2023255 K] and Animal Care and Ethics Committee of Wuhan University [ZN2023225]. Consent for publication: All authors have approved the final manuscript for publication. Competing interests: The authors declare that they have no competing interests.

Figures

Fig. 1
Fig. 1
EphrinB2 expression and renal fibrosis in diabetic kidney disease. (A) Schematic representation of the experimental workflow. Renal tissue samples were collected from patients with non-diabetic renal disease (NDRD) and diabetic kidney disease (DKD) and analyzed using HE, PAS, Masson’s trichrome staining, immunohistochemistry, and immunofluorescence to evaluate EphrinB2 expression and renal fibrosis. (B) Representative HE, PAS, and Masson’s trichrome staining images showing histopathological differences between NDRD and DKD renal tissues. Scale bar = 50 μm. (C) immunohistochemistry staining for EphrinB2 and α-SMA in NDRD and DKD renal tissues. Scale bar = 50 μm. Quantitative analysis of tubular injury score (D), tubulointerstitial fibrosis percentage (E), EphrinB2-positive area percentage (F), and α-SMA-positive area percentage (G) in NDRD and DKD tissues. (H) Representative Immunofluorescence images showing EphrinB2 (red) and Fibronectin (green) expression in NDRD and DKD renal tissues. Merged images include nuclear staining (blue). Scale bar = 20 μm. (I) Representative immunofluorescence images showing EphrinB2 (green) and AQP1 (red) expression in NDRD and DKD renal tissues. Merged images include nuclear staining (blue). Scale bar = 20 μm. Quantification of fluorescence intensity for EphrinB2 and Fibronectin (J) and EphrinB2/AQP1 ratio (K) in NDRD and DKD tissues. All results were presented as the mean ± SD, n = 3/group. *p < 0.05, **p < 0.01
Fig. 2
Fig. 2
EphrinB2 expression and renal fibrosis progression in diabetic nephropathy mouse. A Schematic overview of the experimental workflow. Wild-type (WT) and STZ-induced diabetic mice at 12 weeks (STZ 12 W) and 16 weeks (STZ 16 W) were used. Kidney tissues were collected for the analysis of EphrinB2 and renal fibrosis markers. BE Biochemical analysis of blood glucose (B), serum creatinine (Scr) (C), blood urea nitrogen (BUN) (D), and albumin (ALB) (E) levels in WT, STZ 12 W, and STZ 16 W mice(n = 8/group). F Representative histological images of HE, PAS, and Masson’s trichrome staining showing renal structural changes and fibrosis progression in WT, STZ 12 W, and STZ 16 W mice. Scale bar = 50 μm. G immunohistochemistry staining of EphrinB2, α-SMA, and Fibronectin in kidney tissues from WT, STZ 12 W, and STZ 16 W groups. Scale bar = 50 μm. H–L Quantitative analysis of tubular injury score (H), tubulointerstitial fibrosis percentage (I), EphrinB2-positive area (J), α-SMA-positive area (K), and Fibronectin-positive area (L) in different groups. M Representative immunofluorescence images showing EphrinB2 (red) and Fibronectin (green) expression in WT, STZ 12 W, and STZ 16 W kidney tissues. Merged images include nuclear staining (blue). Scale bar = 20 μm. N Western blot analysis of Fibronectin, α-SMA, and EphrinB2 protein levels in kidney tissues from WT, STZ 12 W, and STZ 16 W groups, with β-actin as a loading control. OQ Densitometric quantification of Fibronectin/β-actin (O), α-SMA/β-actin (P), and EphrinB2/β-actin (Q) protein expression levels (n = 3/group). All results were presented as the mean ± SD, *p < 0.05, **p < 0.01
Fig. 3
Fig. 3
Effects of high glucose (HG) treatment on EphrinB2 expression and fibrosis markers in HK2 cells. A Schematic representation of the experimental design. HK2 cells were incubated in low glucose (LG) or high glucose (HG) conditions (15 mM, 30 mM, and 40 mM) for 24 or 48 h to assess EphrinB2 expression and fibrosis-related markers. B, C qPCR analysis of EphrinB2 mRNA levels in HK2 cells under different glucose concentrations after 48 h. B 24 h and 48 h in HG conditions (30 mM) C (n = 6/group). D Western blot analysis of Fibronectin, α-SMA, and EphrinB2 protein expression in HK2 cells treated with LG or HG (15 mM, 30 mM, and 40 mM) for 24 h. β-actin was used as a loading control. E, F Densitometric quantification of EphrinB2, α-SMA (E), and Fibronectin (F) protein expression normalized to β-actin under different glucose concentrations at 24 h. (G) Western blot analysis of Fibronectin, α-SMA, and EphrinB2 protein levels in HK2 cells treated with LG, Mannitol (Man), or HG (30 mM and 40 mM) for 48 h. β-actin was used as a loading control. H, I Quantification of EphrinB2 and α-SMA (H) and relative protein expression (I) in different glucose treatment groups at 24 and 48 h. (n = 3/group). All results were presented as the mean ± SD, *p < 0.05, **p < 0.01
Fig. 4
Fig. 4
Effects of EphrinB2 overexpression on renal fibrosis in diabetic nephropathy mouse. A Schematic overview of the experimental design. Control (CTL) and STZ-induced diabetic mice were treated with either vehicle or EphrinB2 overexpression (EphrinB2-OE) (n = 3/group). B Immunofluorescence staining of EphrinB2 (green) and nuclear counterstaining with DAPI (blue) in kidney tissues from different experimental groups. Scale bar = 50 μm. C Quantification of EphrinB2 fluorescence intensity in the experimental groups (n = 6/group). DF Biochemical analysis of blood urea nitrogen (BUN) (D), albumin (ALB) (E), and serum creatinine (Scr) (F) levels in the different groups(n = 8/group). G Representative histological images of Masson’s trichrome, PAS, and HE staining showing renal structural changes and fibrosis progression in different groups. Scale bar = 50 μm(n = 3/group). H–L Quantification of tubulointerstitial fibrosis percentage (H), EphrinB2-positive area (J), α-SMA-positive area (K), and Fibronectin-positive area (L) in different groups. (I) Immunohistochemical staining of EphrinB2, α-SMA, and Fibronectin in kidney tissues from different groups. Scale bar = 50 μm(n = 6/group). M Western blot analysis of Fibronectin, α-SMA, and EphrinB2 protein levels in kidney tissues. β-actin was used as a loading control. N Densitometric quantification of EphrinB2, α-SMA, and Fibronectin protein expression normalized to β-actin in different groups. (n = 3/group). All results were presented as the mean ± SD, *p < 0.05, **p < 0.01
Fig. 5
Fig. 5
Effects of EphrinB2 overexpression on mitochondrial morphology, oxidative stress, and ATP production in diabetic nephropathy mouse. A Transmission electron microscopy (TEM) images of kidney tissues from different experimental groups, showing mitochondrial ultrastructural changes. Scale bar needs to be added. B Dihydroethidium (DHE) staining for reactive oxygen species (ROS) detection (red) and DAPI nuclear counterstaining (blue) in kidney sections from different groups. Merged images are shown. Scale bar = 50 μm(n = 3/group). C Quantification of DHE fluorescence intensity, indicating ROS levels in kidney tissues from each group (n = 6/group). D Measurement of ATP content (nmol/mg protein) in kidney tissues across different conditions (n = 8/group). All results were presented as the mean ± SD. *p < 0.05, **p < 0.01
Fig. 6
Fig. 6
Effects of EphrinB2 overexpression on fibrosis, mitochondrial function, and oxidative stress in HK2 cells. A Western blot analysis of EphrinB2 expression in HK2 cells treated with low glucose (LG) or high glucose (HG), with or without EphrinB2 overexpression (EphrinB2-OE). β-actin was used as a loading control. B Western blot analysis of Fibronectin, α-SMA, and EphrinB2 protein levels in HK2 cells under different conditions. CE Quantitative analysis of EphrinB2 mRNA (C) and protein expression (D, E) normalized to β-actin. FG Quantification of α-SMA (F) and Fibronectin (G) protein levels relative to β-actin in different groups. H Transmission electron microscopy (TEM) images showing mitochondrial morphology, and fluorescence staining of DCFH-DA for reactive oxygen species (ROS) and Mito-Sox for mitochondrial superoxide in HK2 cells under different conditions. Scale bars: TEM, 100 nm; DCFH-DA, 100 μm; Mito-Sox, 10 μm. I, L Quantification of cell viability (I), ATP content (J), ROS fluorescence intensity (K), and Mito-Sox fluorescence intensity (L) under different conditions. M JC-1 staining of mitochondrial membrane potential in HK2 cells under different conditions. Red fluorescence (JC-1 aggregates) indicates intact mitochondrial membrane potential, whereas green fluorescence (JC-1 monomers) indicates mitochondrial depolarization. Scale bar = 100 μm. N, O Quantification of relative JC-1 red/green fluorescence ratio (N) and individual JC-1 red and green fluorescence intensities (O) in different groups. All results were presented as the mean ± SD, n = 3/group. *p < 0.05, **p < 0.01
Fig. 7
Fig. 7
Effects of EphrinB2 overexpression on Epac1-Rap1 Pathway in diabetic nephropathy mouse. A Immunofluorescence staining of EphrinB2 (red) and Epac1 (green) in kidney tissues from different experimental groups. DAPI (blue) was used for nuclear staining. Merged images show colocalization. Scale bar = 50 μm. B, C Quantification of EphrinB2 fluorescence intensity (B) and Epac1 fluorescence intensity (C) in different groups. (D) Immunohistochemical staining of Epac1, Rap1, and PGC-1α in kidney tissues from control (CTL) and STZ-induced diabetic mice, with or without EphrinB2 overexpression. Scale bar = 50 μm. E–G Quantification of Epac1-positive area (E), Rap1-positive area (F), and PGC-1α-positive area (G) in different groups. (H) Western blot analysis of Epac1 and Rap1 protein expression in kidney tissues from wild-type (WT), STZ 12-week (STZ12W), and STZ 16-week (STZ16W) mice. β-actin was used as a loading control. I Densitometric quantification of Epac1 and Rap1 protein levels, normalized to β-actin, in WT, STZ12W, and STZ16W groups. All results were presented as the mean ± SD, n = 3/group. *p < 0.05, **p < 0.01
Fig. 8
Fig. 8
EphrinB2 Overexpression Restores Mitochondrial Dynamics and Reduces Fibrosis via the Epac1-Rap1 Pathway. A Western blot analysis of proteins involved in mitochondrial dynamics and function, including p-Drp1, Drp1, Opa1, Mfn1, Mfn2, PGC-1α, Rap1, and Epac1 in control and STZ-treated mice with or without EphrinB2 overexpression (EphrinB2-OE). β-actin serves as a loading control. B Quantification of protein expression for EPAC, Rap1, and PGC-1α showing relative changes across different experimental groups. C Quantification of mitochondrial fusion proteins Mfn1, Mfn2, and Opa1 expression levels. D Ratio of phosphorylated Drp1 (p-Drp1) to total Drp1 indicating changes in mitochondrial fission upon different treatments. E Western blot analysis for the same set of proteins in cultured cells under low glucose (LG) and high glucose (HG) conditions, with or without EphrinB2-OE. F Quantification of EphrinB2 and PGC-1α protein levels under different glucose conditions. G Bar graphs showing relative protein levels of EPAC and Rap1 in cultured cells under high glucose conditions. H Expression levels of mitochondrial fusion proteins Mfn1, Mfn2, and Opa1 under different experimental setups. I Analysis of p-Drp1 levels in cells exposed to high glucose with or without EphrinB2-OE. J Western blots for fibrosis markers including Fibronectin and α-SMA, along with mitochondrial dynamics proteins under various conditions. KL Quantification of EPAC1, Rap1, and PGC-1α levels under the influence of high glucose and different treatment modifiers. (M). Expression levels of mitochondrial fusion proteins under low and high glucose conditions with additional treatment conditions. N Quantitative analysis of α-SMA levels, showing the effect of EphrinB2-OE and its modifiers on fibrotic response in high glucose conditions. O, P Statistical analysis of the ratio of p-Drp1 to Drp1 and the expression levels of fibrosis markers α-SMA and Fibronectin, indicating the regulatory impact of EphrinB2 on mitochondrial dynamics and cellular fibrosis under diabetic conditions. All results were presented as the mean ± SD, n = 3/group. *p < 0.05, **p < 0.01
Fig. 9
Fig. 9
EphrinB2 Overexpression Stabilizes Epac1 Protein Under High-Glucose Conditions. A Immunofluorescence staining for EphrinB2 (red) and Epac1 (green) with nuclei stained using DAPI (blue) in cells under low glucose (LG) and high glucose (HG) conditions, with or without EphrinB2 overexpression (EphrinB2-OE). Scale bar, 50 µm. B Quantification of fluorescence intensity for EphrinB2 and Epac1 under the described conditions. C Western blot analysis of Epac1 protein stability with cycloheximide (CHX) treatment over time (0, 4, 8, 12 h) in cells transfected with either vector control or EphrinB2-OE. D Co-immunoprecipitation (co-IP) showing the interaction between EphrinB2 and Epac1 in LG and HG conditions, with or without EphrinB2-OE. E Graph showing the relative expression levels of Epac1 protein over time with CHX treatment in vector control and EphrinB2-OE conditions, demonstrating changes in protein stability. All results were presented as the mean ± SD, n = 3/group. *p < 0.05, **p < 0.01
Fig. 10
Fig. 10
EphrinB2 Overexpression Modulates β-Catenin Nuclear Translocation and Epithelial Integrity. A Western blot analysis of E-cadherin and β-catenin protein levels in kidney tissues from control and STZ-induced diabetic mice, treated with vehicle or EphrinB2 overexpression vector. β-actin served as a loading control. B Quantification of Western blot results showing relative protein expression levels of E-cadherin and β-catenin normalized to β-actin. C Representative immunofluorescence staining for E-cadherin (green) and β-catenin (red) in kidney sections. Nuclei were stained with DAPI (blue). Scale bar: 20 µm. D Quantitative analysis of E-cadherin fluorescence intensity in kidney tissues. E Quantitative analysis of β-catenin fluorescence intensity in kidney tissues. F Western blot results showing the expression of E-cadherin, β-catenin, and fibronectin under low glucose (LG) and high glucose (HG) conditions, with or without EphrinB2 overexpression. (G). Quantification of Western blot data displaying the relative expression levels of E-cadherin, β-catenin, and fibronectin normalized to β-actin in LG and HG conditions. H Co-immunoprecipitation (Co-IP) analysis of EphrinB2 interactions with β-catenin and E-cadherin under different glucose conditions. I Co-IP analysis showing the binding of β-catenin to E-cadherin in the presence or absence of EphrinB2 overexpression under high glucose conditions. J Western blot analysis of β-catenin distribution in cytoplasmic and nuclear fractions under HG conditions with or without EphrinB2-OE. β-actin and PCNA served as cytoplasmic and nuclear markers, respectively. K Quantification of cytoplasmic and nuclear β-catenin levels, indicating changes in localization related to EphrinB2 overexpression under HG conditions. All results were presented as the mean ± SD, n = 3/group. *p < 0.05, **p < 0.01

References

    1. Lu Q, Yang L, Xiao JJ, Liu Q, Ni L, Hu JW, et al. Empagliflozin attenuates the renal tubular ferroptosis in diabetic kidney disease through AMPK/NRF2 pathway. Free Radic Biol Med. 2023;195:89–102. - PubMed
    1. Alicic RZ, Rooney MT, Tuttle KR. Diabetic kidney disease: challenges, progress, and possibilities. Clin J Am Soc Nephrol. 2017;12(12):2032–45. - PMC - PubMed
    1. Ni L, Yuan C. The mitochondrial-associated endoplasmic reticulum membrane and its role in diabetic nephropathy. Oxid Med Cell Longev. 2021;2021:8054817. - PMC - PubMed
    1. Yang WX, Liu Y, Zhang SM, Wang HF, Liu YF, Liu JL, et al. Epac activation ameliorates tubulointerstitial inflammation in diabetic nephropathy. Acta Pharmacol Sin. 2022;43(3):659–71. - PMC - PubMed
    1. Musheshe N, Oun A, Sabogal-Guáqueta AM, Trombetta-Lima M, Mitchel SC, Adzemovic A, et al. Pharmacological inhibition of Epac1 averts ferroptosis cell death by preserving mitochondrial integrity. Antioxidants (Basel). 2022;11(2):314. - PMC - PubMed

MeSH terms

Substances

LinkOut - more resources