. 2025 Dec;63(1):503-523.
doi: 10.1080/13880209.2025.2537123. Epub 2025 Jul 24.

Sophoridine inhibits proliferation and migration by targeting PIM1 in breast cancer

Affiliations

Sophoridine inhibits proliferation and migration by targeting PIM1 in breast cancer

Lu Chen et al. Pharm Biol. 2025 Dec.

Abstract

Context: Sophoridine, an alkaloid quinolizidine derived from Sophora flavescens Aiton (Fabaceae), has strong anti-tumor activity in a variety of malignancies. Nevertheless, the effects and underlying mechanism of sophoridine on breast cancer are not fully understood.

Objective: To identify the key targets and potential pharmacological mechanisms of sophoridine against breast cancer.

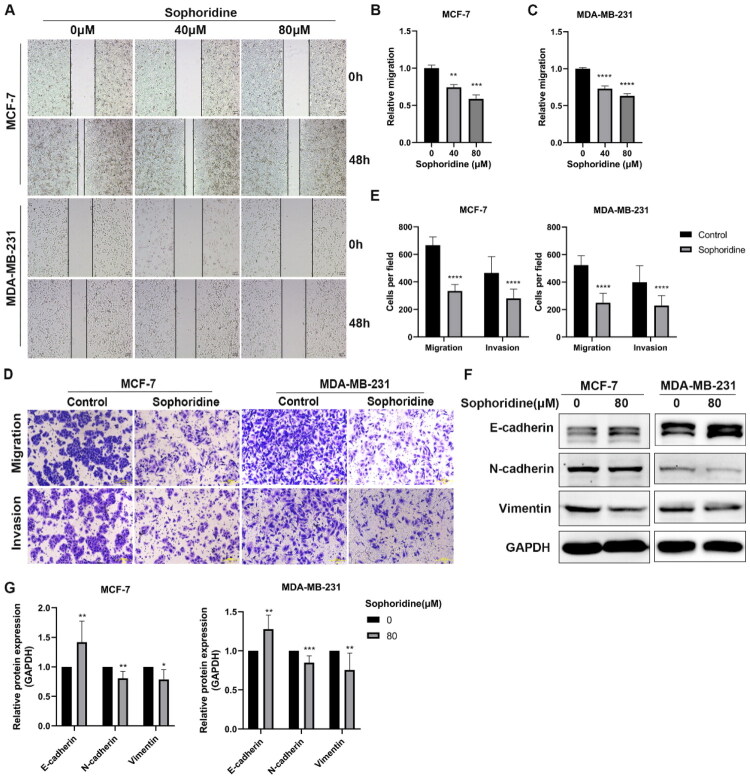
Materials and methods: MCF-10A, MCF-7 and MDA-MB-231 cells were treated with sophoridine for 24 or 48 h. MTT, colony formation assay, flow cytometry, wound healing, and Transwell assay were employed to illustrate the anti-tumor effects of sophoridine on breast cancer. Network pharmacology and molecular docking were used to determine the targets for sophoridine in breast cancer, and confirmed by molecular dynamics simulation and CETSA-western blot assay. Additionally, the functional rescue and signaling pathway regulated by sophoridine was analyzed.

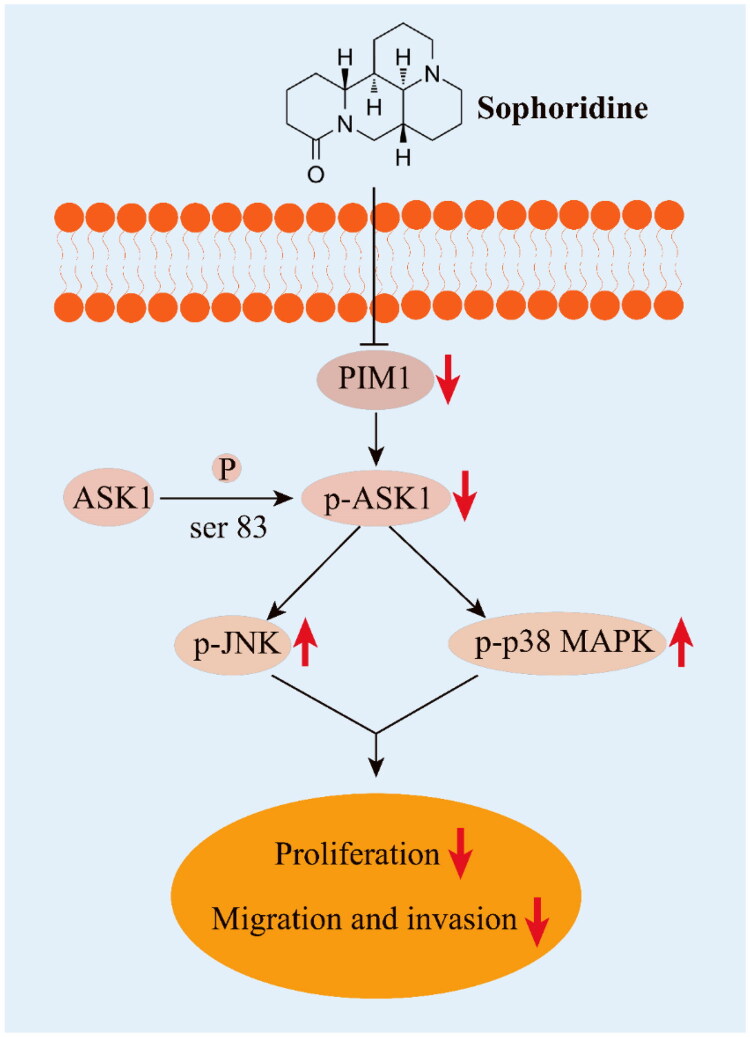
Results: Sophoridine suppressed the proliferation, migration, and invasion of breast cancer cells. The IC50 value of sophoridine for 48 h in MCF-10A, MCF-7 and MDA-MB-231 was 363 μM, 87.96 μM and 81.07 μM, respectively. PIM1 was the key target for sophoridine in breast cancer. Furthermore, PIM1 overexpression significantly reversed the suppressive impacts of sophoridine on growth and migration in breast cancer cells. Mechanistically, sophoridine inhibited the phosphorylation of ASK1 and activated JNK/p38 MAPK signaling pathway by downregulating PIM1 expression, and thus exhibited anti-tumor effects.

Discussion and conclusion: Taken together, sophoridine relies on targeting PIM1 to inhibit cell proliferation and migration in breast cancer, which might be related to the activation of ASK1/MAPK axis, suggesting the therapeutic potential of sophoridine for breast cancer.

Keywords: ASK1/MAPK pathway; Breast cancer; PIM1; Sophoridine.


Conflict of interest statement

No potential conflict of interest was reported by the author(s).

Figures

Figure 1.
Figure 1.
Sophoridine inhibits proliferation and promotes apoptosis in breast cancer cells. (A) The chemical structure of sophoridine. (B) MCF-10A, MCF-7 and MDA-MB-231 cells were treated with sophoridine in different concentrations (0, 20, 40, 60, 80, 100, 120 μM) for 24, 48 h. MTT was applied to evaluate the cell viability, and dose-response curves and IC50 values were analyzed by GraphPad software. (C) MCF-7 and MDA-MB-231 cells were treated with sophoridine (80 μM) and cell colonies were stained by crystal violet. (D) Statistical analysis of cell colonies per field. (E) MCF-7 and MDA-MB-231 cells were treated with sophoridine (80 μM) for 24 h, and stained with FITC-annexin V/PI. Flow cytometry analysis was conducted to evaluate cell apoptosis. (F) Statistical analysis of both cell apoptosis rates. (G) RT-qPCR was applied to analyze the gene expressions of factors related to apoptosis in MCF-7 and MDA-MB-231 cells treated with sophoridine (80 μM) for 24 h. (H) Western blot was used to ascertain the protein expressions of factors related to apoptosis in MCF-7 and MDA-MB-231 cells treated with sophoridine (80 μM) for 48 h. (I) Statistical analysis of the relative protein expressions. Data were displayed as mean ± SD (n = 3). *p < 0.05, **p < 0.01, ***p < 0.001, ****p < 0.0001.
Figure 2.
Figure 2.
Sophoridine inhibits migration and invasion in breast cancer cells. (A) MCF-7 and MDA-MB-231 cells were treated with sophoridine in indicated concentrations for 48 h. Cell migration were evaluated by cell scratch assay. (B) (C) The relative migration rates were counted by GraphPad software. (D) The migration and invasion of cells treated with sophoridine (80 μM) for 48 h were analyzed by Transwell. (E) The statistical analysis of the number of migration and invasion cells per field. (F) The protein expression of the EMT markers in MCF-7 and MDA-MB-231 cells treated with sophoridine (80 μM) for 48 h was detected by Western blot. (G) Statistical analysis of the relative protein expressions. Data were displayed as mean ± SD (n = 3). *p < 0.05, **p < 0.01, ***p < 0.001, ****p < 0.0001.
Figure 3.
Figure 3.
PIM1 is predicted to be the critical target of sophoridine in breast cancer. (A) The venn diagram of targets between sophoridine and luminal A breast cancer. (B) The D-T diagram of common targets between sophoridine and luminal A breast cancer, and the color depth and size of nodes were proportional to the norm Fit of targets. (C) MCF-7 cells were treated with sophoridine (80 μM) for 24 h, and the gene expressions of 8 targets were determined by RT-qPCR (n = 3). (D) The venn diagram of targets between sophoridine and TNBC. (E) The D-T diagram of common targets between sophoridine and TNBC, and the color depth and size of nodes were proportional to the norm Fit of targets. (F) MDA-MB-231 cells were treated with sophoridine (80 μM) for 24 h, and the gene expressions of 6 targets were determined by RT-qPCR (n = 3). (G) Molecular docking of sophoridine with the crystal structure of 8 different targets. A stick model was used to represent the molecules, blue and yellow lines represented the hydrophobic interaction and hydrogen bond, respectively, and angstroms were used to indicate the distance. *p < 0.05, **p < 0.01, ***p < 0.001, ****p < 0.0001; NS, no significant difference.
Figure 4.
Figure 4.
Sophoridine binds to PIM1 and downregulates the expression of PIM1 in breast cancer cells. (A) RMSD curve of the PIM1-sophoridine (SRI) complex over 100 ns simulation. (B) RMSF curve of the PIM1-sophoridine (SRI) complex binding interface residues. (C)Rg curve of the PIM1-sophoridine (SRI) complex. (D) SASA curve of the PIM1-sophoridine (SRI) complex. (E) Structural comparison of the PIM1-sophoridine (SRI) complex at five time points (0, 25, 50, 75, and 100 ns) in molecular dynamics simulations. The red, green, blue, yellow, and orange small molecules corresponded to the sophoridine molecular structures at the five time points (0, 25, 50, 75, and 100 ns), respectively. (F) Free energy landscape of the PIM1-sophoridine (SRI) complex. (G) The average binding free energy of the PIM1 protein with sophoridine. VDWAALS, EEL, EGB, ESURF, GGAS, GSOLV, and TOTAL represent van der Waals forces, electrostatic energy, polar solvation energy, nonpolar solvation energy, molecular mechanics energy, solvation energy, and average binding free energy, respectively. (H) Energy contributions of amino acid residues involved in sophoridine binding in PIM1 protein. (I) CETSA assay to analysis the intracellular binding between sophoridine and PIM1. PIM1 protein levels were detected at different temperature under the treatment of sophoridine (160 μm) or DMSO for 2 h in MCF-7 and MDA-MB-231 cells. (J) The protein expression of PIM1 in MCF-7 and MDA-MB-231 cells treated with sophoridine in indicated concentrations for 48 h. (K) Statistical analysis of PIM1 expressions. The data are representatives of at least 3 independent experiments. *p < 0.05, **p < 0.01, ***p < 0.001.
Figure 5.
Figure 5.
Sophoridine suppresses cell proliferation and migration in breast cancer cells via PIM1. Cells transfected with either a PIM1 overexpression plasmid (PIM1-Over) or an empty vector (Vector) were treated with or without sophoridine (80 μM). (A) (B) The transfection efficiency of untagged PIM1 was evaluated by Western blot using a PIM1 antibody that detects both endogenous and exogenous PIM1. (C) MTT assay was applied to evaluate the cell viability rate. (D) (E) The colony formation capability was tested by clonogenic assay, and statistical analysis of cell colonies per field. (F) (H) The migration and invasion of cells were analyzed by Transwell. (G) (I) The statistical analysis of the number of migration and invasion cells per field. Data were displayed as mean ± SD (n = 3). *p < 0.05, **p < 0.01, ***p < 0.001, ****p < 0.0001.
Figure 6.
Figure 6.
Sophoridine activates the ASK1/MAPK signaling pathway by down-regulation of PIM1 expression. Cells were treated with sophoridine (80 μM) for 48 h. (A) The protein expression of PIM1/ASK1/MAPK pathway-related proteins in MCF-7 cells by Western blot. (B) Statistical analysis of PIM1, ASK1, p38 MAPK and JNK relative expressions in MCF-7 cells compared to GAPDH. (C-E) Statistical analysis of p-ASK1, p-p38 MAPK and p-JNK relative expressions in MCF-7 cells compared to ASK1, p38 MAPK and JNK. (F) The protein expression of PIM1/ASK1/MAPK pathway-related proteins in MDA-MB-231 cells by Western blot. (G) Statistical analysis of PIM1, ASK1, p38 MAPK and JNK relative expressions in MDA-MB-231 cells compared to GAPDH. (H-J) Statistical analysis of p-ASK1, p-p38 MAPK and p-JNK relative expressions in MDA-MB-231 cells compared to ASK1, p38 MAPK and JNK. Data were displayed as mean ± SD (n = 3). *p < 0.05, **p < 0.01, ***p < 0.001, ****p < 0.0001.
Figure 7.
Figure 7.
Schematic diagram of the mechanism of anti-tumor effects of sophoridine on breast cancer. Sophoridine targets PIM1 and decreases the expression of PIM1, which leads to the decline of p-ASK and the activation of JNK and p38 MAPK signaling pathway, then induces apoptosis and suppresses EMT, thus hindering the proliferation, migration and invasion of breast cancer cells.

Similar articles

References

    1. Abu Samaan TM, Samec M, Liskova A, Kubatka P, Büsselberg D.. 2019. Paclitaxel’s mechanistic and clinical effects on breast cancer. Biomolecules. 9(12):789. doi: 10.3390/biom9120789. - DOI - PMC - PubMed
    1. Bakir B, Chiarella AM, Pitarresi JR, Rustgi AK.. 2020. EMT, MET, plasticity, and tumor metastasis. Trends Cell Biol. 30(10):764–776. doi: 10.1016/j.tcb.2020.07.003. - DOI - PMC - PubMed
    1. Bogusz J, Zrubek K, Rembacz KP, Grudnik P, Golik P, Romanowska M, Wladyka B, Dubin G.. 2017. Structural analysis of PIM1 kinase complexes with ATP-competitive inhibitors. Sci Rep. 7(1):13399. doi: 10.1038/s41598-017-13557-z. - DOI - PMC - PubMed
    1. Brasó-Maristany F, Filosto S, Catchpole S, Marlow R, Quist J, Francesch-Domenech E, Plumb DA, Zakka L, Gazinska P, Liccardi G, et al. 2016. PIM1 kinase regulates cell death, tumor growth and chemotherapy response in triple-negative breast cancer. Nat Med. 22(11):1303–1313. doi: 10.1038/nm.4198. - DOI - PMC - PubMed
    1. Burley SK, Bhikadiya C, Bi C, Bittrich S, Chao H, Chen L, Craig PA, Crichlow GV, Dalenberg K, Duarte JM, et al. 2023. RCSB Protein Data Bank (RCSB.org): delivery of experimentally-determined PDB structures alongside one million computed structure models of proteins from artificial intelligence/machine learning. Nucleic Acids Res. 51(D1):D488–d508. doi: 10.1093/nar/gkac1077. - DOI - PMC - PubMed

MeSH terms