. 2025 Jul;15(7):101169.
doi: 10.1016/j.jpha.2024.101169. Epub 2024 Dec 16.

Aldolase A accelerates hepatocarcinogenesis by refactoring c-Jun transcription

Affiliations

Aldolase A accelerates hepatocarcinogenesis by refactoring c-Jun transcription

Xin Yang et al. J Pharm Anal. 2025 Jul.

Abstract

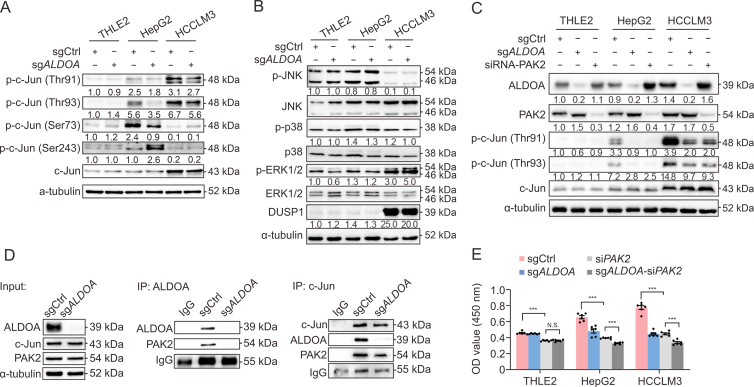
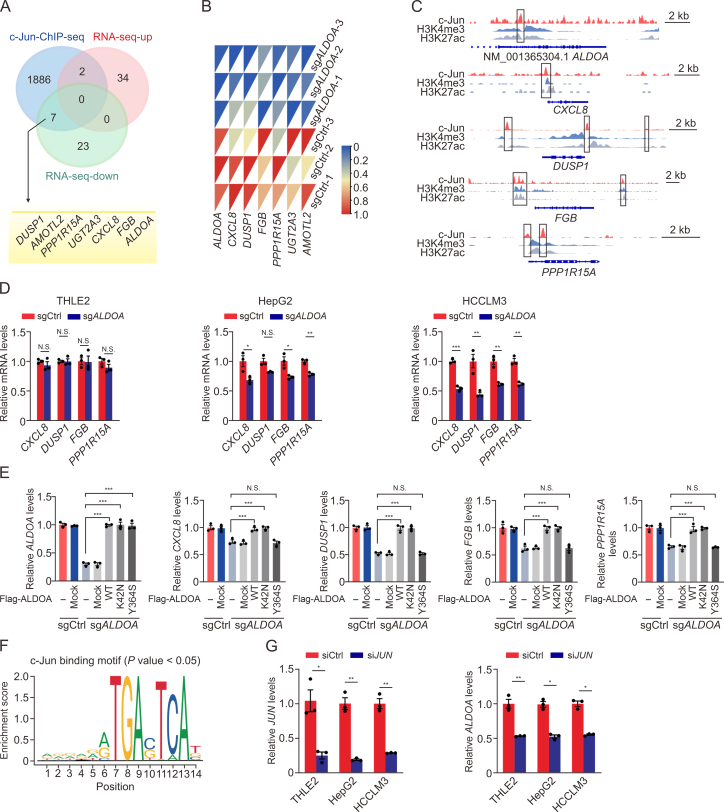
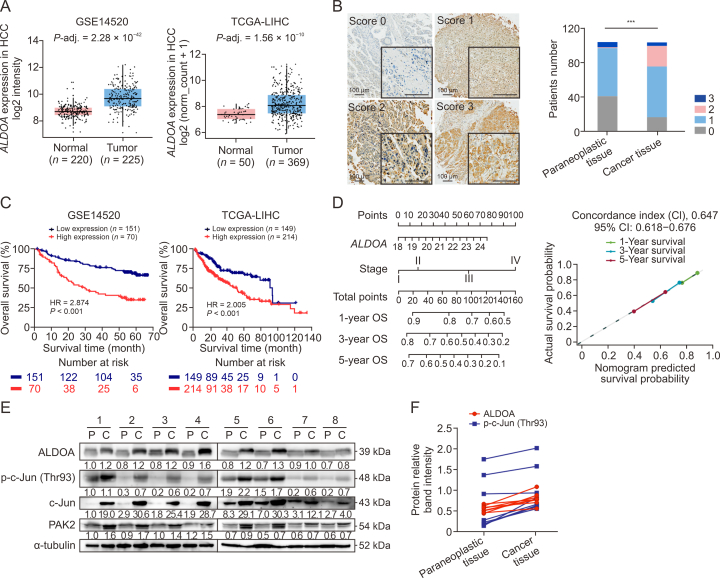
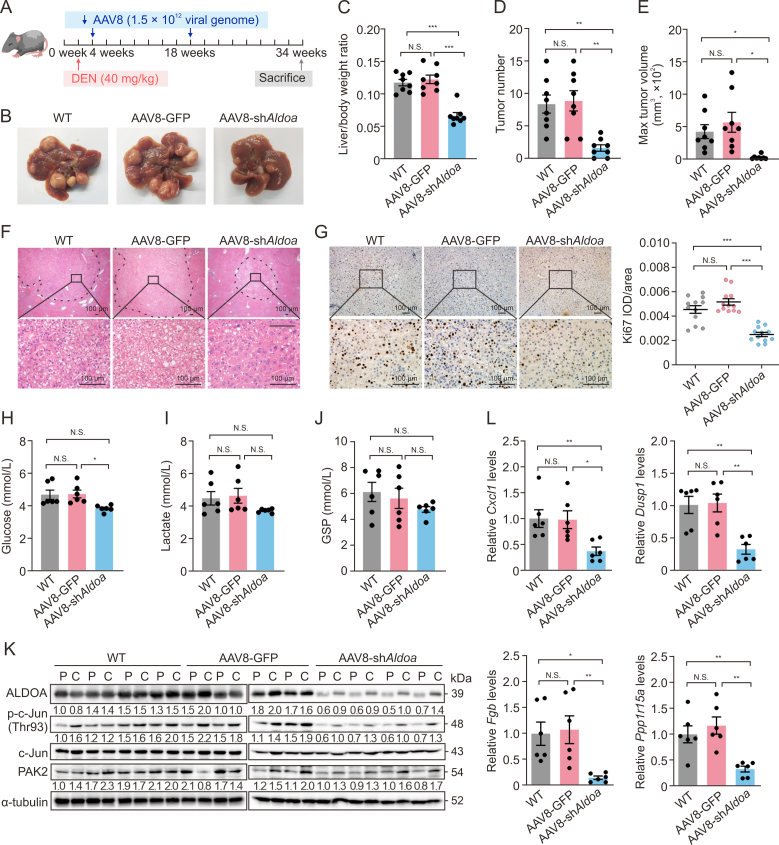
Hepatocellular carcinoma (HCC) expresses abundant glycolytic enzymes and displays comprehensive glucose metabolism reprogramming. Aldolase A (ALDOA) plays a prominent role in glycolysis; however, little is known about its role in HCC development. In the present study, we aim to explore how ALDOA is involved in HCC proliferation. HCC proliferation was markedly suppressed both in vitro and in vivo following ALDOA knockout, which is consistent with ALDOA overexpression encouraging HCC proliferation. Mechanistically, ALDOA knockout partially limits the glycolytic flux in HCC cells. Meanwhile, ALDOA translocated to nuclei and directly interacted with c-Jun to facilitate its Thr93 phosphorylation by P21-activated protein kinase; ALDOA knockout markedly diminished c-Jun Thr93 phosphorylation and then dampened c-Jun transcription function. A crucial site Y364 mutation in ALDOA disrupted its interaction with c-Jun, and Y364S ALDOA expression failed to rescue cell proliferation in ALDOA deletion cells. In HCC patients, the expression level of ALDOA was correlated with the phosphorylation level of c-Jun (Thr93) and poor prognosis. Remarkably, hepatic ALDOA was significantly upregulated in the promotion and progression stages of diethylnitrosamine-induced HCC models, and the knockdown of A ldoa strikingly decreased HCC development in vivo. Our study demonstrated that ALDOA is a vital driver for HCC development by activating c-Jun-mediated oncogene transcription, opening additional avenues for anti-cancer therapies.

Keywords: Glycolysis; Hepatocellular carcinoma; Nuclear localization; Transcriptional regulation; c-Jun.


Conflict of interest statement

The authors declare that there are no conflicts of interest.

Figures

Image 1
Graphical abstract
Fig. 1
Fig. 1
Effect of aldolase A (ALDOA) knockout on tumorigenicity of human hepatocellular carcinoma (HCC) cells both in vitro and in vivo. (A) The protein expression of ALDOA in six HCC cell lines and the normal human liver cell line, THLE2 (n = 3). (B) Cell proliferation curves of THLE2, HepG2, and HCCLM3 cells stably expressing gene knockout of ALDOA (sgALDOA) or nontargeting control (sgCtrl) (n = 6). (C) Representative images and quantitative analysis of colony formation assay of the above cells (n = 3). (D) Representative images and the quantification of transwell matrigel invasion assay (n = 4). (E) The images of tumor samples from xenograft mice at 4 weeks after transplantation. (F) The volume of tumors was monitored every 4 days (n = 5). (G) Tumor weights of the xenograft mice at 4 weeks after transplantation (n = 5). (H) Representative images of Ki67 immunohistochemical staining and quantification (n = 12). N.S.: no significant difference, P < 0.05, ∗∗P < 0.01, ∗∗∗P < 0.001. OD: optical density, IOD: integrated optical density.
Fig. 2
Fig. 2
The effect of aldolase A (ALDOA) deficiency on intracellular flux from glucose into lactate. (A–D) The aldolase activity (A), glucose consumption levels (B), lactate secretion levels (C), and adenosine triphosphate (ATP) production levels (D) in three cell lines transfected with gene knockout of ALDOA (sgALDOA) or nontargeting control (sgCtrl) (n = 4). (E) Seahorse metabolic analysis and calculations of the indicated glycolytic parameters of extracellular acidification rate (ECAR) in three cell lines (n = 5). (F) Carbon fate map showing the isotope distribution of indicated metabolites derived from [U–13C] glucose. 13C atoms are colored in red. (G) Metabolic flux distributions in HCCLM3-sgALDOA and HCCLM3-sgCtrl cells. Fluxes were determined by integrating mass isotopic labeling data from [U–13C] glucose tracer experiments at 6 h (n = 3). (H) The main metabolic products of glycolysis in HCCLM3-sgALDOA and HCCLM3-sgCtrl cells determined by liquid chromatography-mass spectrometry (LC-MS) (n = 4). N.S.: no significant difference, P < 0.05, ∗∗P < 0.01, ∗∗∗P < 0.001. FBP: fructose 1,6-bisphosphate; 2-DG: 2-deoxy-d-glucose; G6P: glucose 6-phosphate; R5P: ribulose 5-phosphate; F6P: fructose 6-phosphate; DHAP: dihydroxyacetone phosphate; GAP: glyceraldehyde 3-phosphate; 3-PG: 3-phosphoglycerate; Pyr: pyruvic acid; LAC: lactate; M: mass isotope distributions.
Fig. 3
Fig. 3
Aldolase A (ALDOA) interacts with c-Jun in the nuclei of hepatocellular carcinoma (HCC) cells. (A) Cluster analysis heat map of differential gene expression in HCCLM3-gene knockout of ALDOA (sgALDOA) and HCCLM3-nontargeting control (sgCtrl) cells using RNA sequencing (RNA-Seq). (B) Volcano plot of the changed genes in RNA-Seq between HCCLM3-sgALDOA and sgCtrl cells. (C) Gene Ontology enrichment analysis of the top-ranked genes altered by ALDOA in HCCLM3 cells based on the biological process classification of RNA-Seq analysis. (D) The most prominently changed pathway in RNA-Seq evaluated by Gene Set Enrichment analysis. (E) Heat map showing the genes involved in the activator protein-1 (AP-1) pathway in the RNA-Seq analysis. (F) The effects of ALDOA knockout on protein expressions of the two subunits of AP-1, c-Jun, and c-Fos, in the whole-cell lysate of three kinds of cells (n = 3). (G, H) The co-immunoprecipitation analysis of ALDOA interaction with c-Jun in HCCLM3 (G) and HepG2 (H) cells (n = 3). (I) ALDOA-c-Jun interactions in THLE2 and HCCLM3 cells. Representative proximity ligation assay (PLA) photomicrographs (left panel) and the statistical analysis (right panel) are shown (n = 4). (J) Immunofluorescence microscopy analysis of ALDOA and c-Jun in three kinds of cells. The 2D correlation scatter diagrams of fluorescence intensity (right panel) show the co-localization of ALDOA and c-Jun in the nuclei (labeled with 4′,6-diamidino-2-phenylindole). ∗∗P < 0.01. NES: normalized enrichment score; FDR: false discovery rate; IP: immunoprecipitation.
Fig. 4
Fig. 4
Aldolase A (ALDOA) facilitates c-Jun phosphorylation at the Thr93 site by P21-activated kinase 2 (PAK2) in hepatocellular carcinoma (HCC) cells. (A) The effects of ALDOA knockout on phosphorylated c-Jun (p-c-Jun) in three kinds of cells (n = 3). (B) The effects of ALDOA knockout on mitogen-activated protein kinase (MAPK) activation and DUSP1 expressions in three kinds of cells (n = 3). (C) The effects of PAK2 silencing (siPAK2) on the expressions of p-c-Jun and ALDOA (n = 3). (D) Co-immunoprecipitation analysis of the interaction among ALDOA, c-Jun, and PAK2 in HCCLM3 cells (n = 3). (E) The effects of siPAK2 on cell proliferation of THLE2, HepG2, and HCCLM3 cells regulated by ALDOA (n = 6). N.S.: no significant difference, ∗∗∗P < 0.001. sgALDOA: gene knockout of ALDOA, sgCtrl: nontargeting control, p-c-Jun: phosphorylated c-Jun; JNK: c-Jun N-terminal kinases; p-JNK: phosphorylated Jun N-terminal kinases; ERK: extracellular regulated protein kinases; p-ERK: phosphorylated extracellular regulated protein kinases; p-p38: phosphorylated p38; IP: immunoprecipitation; OD: optical density.
Fig. 5
Fig. 5
The interaction of Y364 aldolase A (ALDOA) with Y10 c-Jun is crucial for the phosphorylation of c-Jun and hepatocellular carcinoma (HCC) proliferation. (A) Sequence alignment of the conserved tyrosine residues in c-Jun of different species. (B) Schematic diagrams of the N-terminal sequence (aa1–30) of the c-Jun binding pocket in human ALDOA (PDB code: 1ALD) and the interacting residues identified by docking analysis. (C) Co-immunoprecipitation analysis to identify the interaction residues between ALDOA and c-Jun in Flag-ALDOA and/or Myc-c-Jun transiently transfected HEK293T cells (n = 3). (D) The effects of different JUN or ALDOA mutations on the phosphorylation of c-Jun in HEK293T cells after 24 h transfection (n = 3). (E) The effects of different ALDOA mutations on aldolase activities in HEK293T cells after 48 h transfection (n = 4). (F) The effects of different JUN or ALDOA mutations on the proliferation of HEK293T cells after 48 h transfection (n = 6). (G–I) The rescued effects of ALDOA mutations on protein expressions of phosphorylated c-Jun (p-c-Jun) Thr93 and ALDOA (G), aldolase activities (H), and cell proliferation (I) in HCCLM3-gene knockout of ALDOA (sgALDOA) cells after wild-type (WT) or mutated ALDOA transfected for 24 h (protein expression, n = 3), 48 h (aldolase activities, n = 4), or 72 h (cell proliferation, n = 6). N.S.: no significant difference, ∗∗P < 0.01, ∗∗∗P < 0.001. PAK2: P21-activated kinase 2; FBP: fructose 1,6-bisphosphate; sgCtrl: nontargeting control; OD: optical density.
Fig. 6
Fig. 6
Transcriptional targets of c-Jun regulated by aldolase A (ALDOA) in hepatocellular carcinoma (HCC) cells. (A) Venn diagram depicting the transcriptional regulation of c-Jun in chromatin immunoprecipitation sequencing (ChIP-Seq) data (GSM935364) of HepG2 cells and the predicted target genes of c-Jun regulated by ALDOA in HCCLM3 cells. The bottom panel shows the predicted target genes. (B) Heat map showing the predicted target genes of c-Jun activation regulated by ALDOA in HCCLM3 cells using RNA sequencing (RNA-seq). (C) c-Jun occupancy at ALDOA, CXCL8, DUSP1, FGB, and PPP1R15A gene loci in ChIP-Seq data (GSM935364) of HepG2 cells. (D) The messenger RNA (mRNA) levels of CXCL8, DUSP1, FGB, and PPP1R15A in THLE2-gene knockout of ALDOA (sgALDOA), HepG2-sgALDOA, HCCLM3-sgALDOA cells, and their control cells (n = 3). (E) The rescued effects of ALDOA mutations on the levels of c-Jun target genes in HCCLM3-sgALDOA cells after transfection for 48 h (n = 3). (F) The predicted c-Jun-binding sites at the promoters of ALDOA. (G) The effects of JUN silencing (siJUN) on the mRNA expressions of ALDOA in three kinds of cells. The mRNA levels of JUN and ALDOA were measured by quantitative real-time PCR (qPCR) assay in the cells treated with JUN small interfering RNA (siRNA) for 48 h (n = 3). N.S.: no significant difference, P < 0.05, ∗∗P < 0.01, ∗∗∗P < 0.001. sgCtrl: nontargeting control.
Fig. 7
Fig. 7
The upregulation of aldolase A (ALDOA) correlated with human hepatocellular carcinoma (HCC) development. (A) Box plots of ALDOA messenger RNA (mRNA) expressions in HCC and normal liver tissues from the GSE14520 in Gene Expression Omnibus (GEO) (n = 445) and the Cancer Genome Atlas Liver Hepatocellular Carcinoma (TCGA-LIHC) (n = 419) datasets, respectively. (B) The scores of ALDOA protein levels in representative tumor tissues from a tissue microarray of 104 paired human HCC specimens. (C) Kaplan-Meier curves of survival differences in ALDOA-high and -low expressed HCC patients from the GSE14520 in GEO (221 patients) and TCGA-LIHC (363 patients) datasets (n = 584), respectively. Survival difference was evaluated using the Log-rank test. (D) Postoperative prognostic nomogram for patients with HCC, and the calibration curve of the nomogram for predicting the overall survival at 1 year (green), 3 years (blue), and 5 years (red). Actual overall survival (OS) is plotted on the y-axis; nomogram predicted probability of OS is plotted on the x-axis. (E) The protein levels of ALDOA, phosphorylated c-Jun (p-c-Jun) Thr93, c-Jun, and P21-activated kinase 2 (PAK2) in the paraneoplastic (P) and cancer (C) tissues of HCC patients (n = 8). (F) Protein expressions of ALDOA and p-c-Jun (Thr93) in 8 paired HCC tissues and adjacent normal tissues. ∗∗∗P < 0.001. HR: hazard ratio.
Fig. 8
Fig. 8
Adeno-associated virus based on serotype 8 (AAV8)-medicated Aldoa deficiency decreased the susceptibility of mice to diethylnitrosamine (DEN)-induced hepatocellular carcinoma (HCC). (A) Schematic treatment of DEN challenge (intraperitoneally) and AAV8 intervention (intravenously) on male C57BL/6 mice. (B) Representative images of livers at 8 months after DEN treatment. (C) Quantification of the liver-to-body weight ratios (n = 8). (D) The number of macroscopic tumors (≥0.1 cm) identified in animals at the time of sacrifice (n = 8). (E) The mean max tumor volumes in three groups (n = 8). (F) Representative images of hematoxylin and eosin (H&E) staining in tumor foci and adjacent normal liver. Some tumors in the livers are shown by dotted circles. (G) Representative images of Ki67 immunohistochemistry staining and quantification in tumor foci and adjacent normal liver (n = 12). (H–J) The levels of glucose (H), lactate (I), and glycosylated serum protein (GSP) (J) in the serum of DEN-induced mice (n = 6). (K) The protein levels of aldolase A (ALDOA), phosphorylated c-Jun (p-c-Jun) Thr93, c-Jun, and P21-activated kinase 2 (PAK2) in the livers of DEN-treated mice (n = 4). (L) The messenger RNA (mRNA) levels of Cxcl1, Dusp1, Fgb, and Ppp1r15a in the livers of DEN-treated mice (n = 6). N.S.: no significant difference, P < 0.05, ∗∗P < 0.01, ∗∗∗P < 0.001. WT: wild-type, AAV8-shAldoa: AAV8 liver-specific Aldoa knockdown; AAV8-GFP: AAV8 liver-specific GFP control; IOD: integrated optical density.

Similar articles

References

    1. Faubert B., Solmonson A., DeBerardinis R.J. Metabolic reprogramming and cancer progression. Science. 2020;368:eaaw5473. - PMC - PubMed
    1. Warburg O. On the origin of cancer cells. Science. 1956;123:309–314. - PubMed
    1. Garber K. Energy deregulation: Licensing tumors to grow. Science. 2006;312:1158–1159. - PubMed
    1. Shimizu T., Inoue K., Hachiya H., et al. Frequent alteration of the protein synthesis of enzymes for glucose metabolism in hepatocellular carcinomas. J. Gastroenterol. 2014;49:1324–1332. - PMC - PubMed
    1. Sun J., Ding J., Shen Q., et al. Decreased propionyl-CoA metabolism facilitates metabolic reprogramming and promotes hepatocellular carcinoma. J. Hepatol. 2023;78:627–642. - PubMed

LinkOut - more resources