

Hemodynamic analysis of non-stenotic middle cerebral artery in patients with cerebral ischemia based on 4D flow MRI
- PMID: 40708689
- PMCID: PMC12287126
- DOI: 10.3389/fnins.2025.1502987
Hemodynamic analysis of non-stenotic middle cerebral artery in patients with cerebral ischemia based on 4D flow MRI
Abstract
Objectives: Changes in cerebral hemodynamics in symptomatic states among patients with cerebral ischemia remain unclear. This study endeavors to investigate the characteristics of hemodynamics distribution within the non-stenotic middle cerebral artery (MCA) in patients with anterior circulation cerebral ischemia.
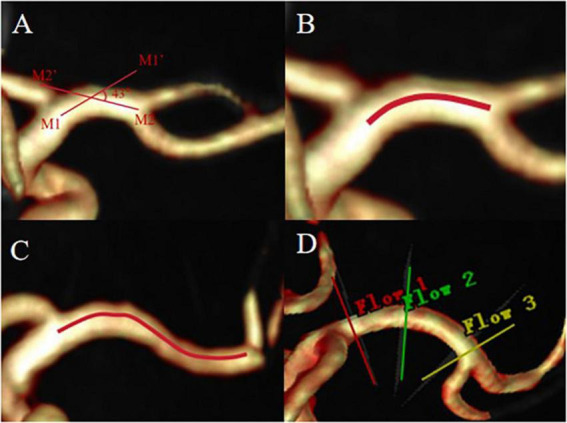
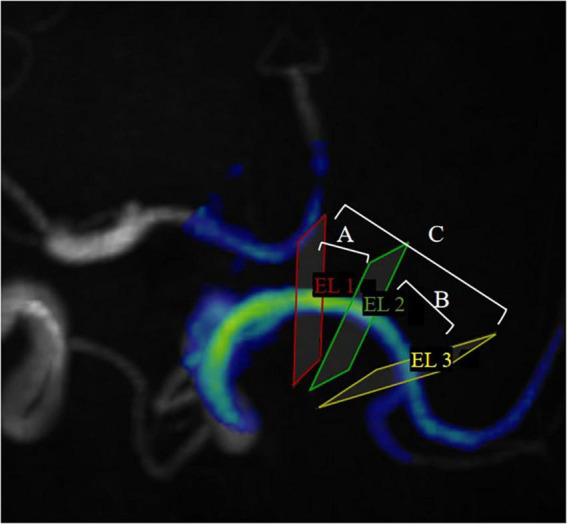
Materials and methods: All subjects were prospectively recruited in this study. According to the clinical features of cerebral ischemia symptoms, they were divided into ischemia group and healthy group. MCA was further divided into proximal, curved, and distal segments based on the vascular morphology. Hemodynamic parameters, including flow, peak flow velocity, wall shear stress (WSS), pressure and energy loss (EL) were measured for each segment of the MCA in both groups using 4D flow MRI. The hemodynamic parameters of the proximal, curved, and distal MCA segments were compared within the group, and the influence of MCA morphology on hemodynamics was analyzed. Additionally, the hemodynamic parameters of the proximal, curved, and distal MCA segments were compared between the healthy and the ischemic groups to analyze the hemodynamic changes in the MCA among patients with cerebral ischemia.
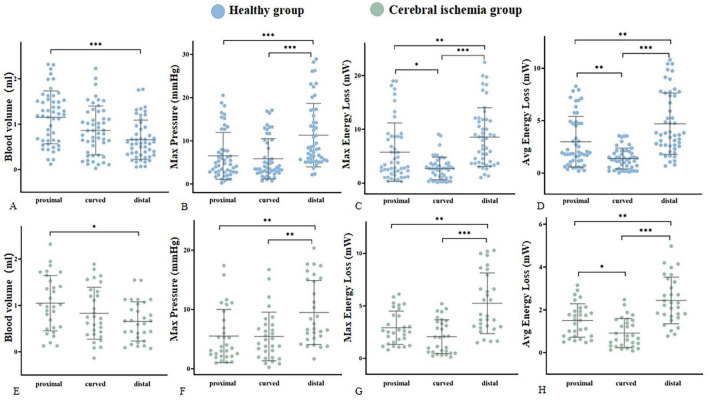
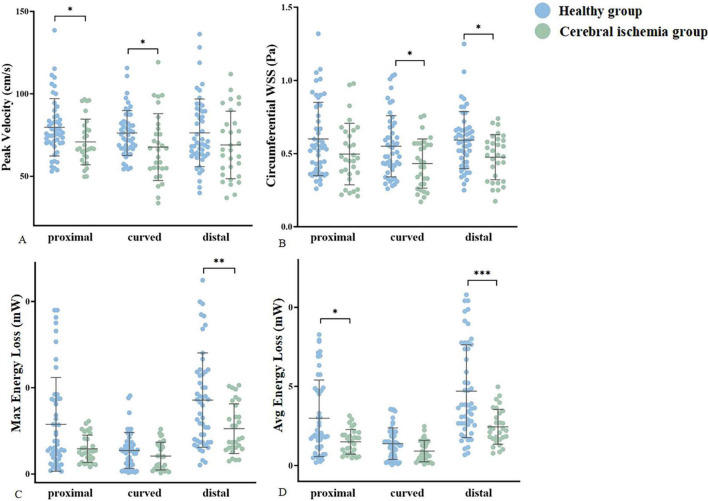
Results: A total of 50 MCAs were included in healthy group and 30 MCAs in ischemia group. There were no statistically significant differences in gender, age, heart rate, presence of hypertension and Body mass index (BMI) between the two groups. Results showed that the proximal segment had the highest blood volume (all P < 0.05), the M1 segment of MCA had the highest pressure (Max) and EL (Max and Avg) (all P < 0.01) in both groups. The peak blood flow velocity of the proximal and curved segments, the circumferential WSS of the distal segment, and the EL (Max and Avg) of the M1 segment in the ischemia group were lower than those in the healthy group (all P < 0.05).
Conclusion: The distribution of hemodynamics in MCA is similar between anterior circulation cerebral ischemia patients and healthy group. In the ischemic group, the peak blood flow velocity, circumferential WSS, and EL of MCA were lower compared to the healthy group. The reduced flow velocity and the decrease of circumferential WSS in the curved section may be contributing factors to cerebrovascular events.
Keywords: 4D flow MRI; WSS = wall shear stress; cerebral ischemia; hemodynamics; middle cerebral artery; peak velocity.
Copyright © 2025 Chen, Sun, Sui, Shi, Lian, Yang, Lin, Lyu, Li, Zhang and Wang.
Conflict of interest statement
The authors declare that the research was conducted in the absence of any commercial or financial relationships that could be construed as a potential conflict of interest.
Figures
Similar articles
-
Hemodynamic changes and their relationship with white matter hyperintensities in CSVD patients with cognitive impairment: a 4D flow study.Front Aging Neurosci. 2025 Jun 18;17:1578288. doi: 10.3389/fnagi.2025.1578288. eCollection 2025. Front Aging Neurosci. 2025. PMID: 40607188 Free PMC article.
-
Morphological Study on Lenticulostriate Arteries in Patients With Middle Cerebral Artery Stenosis at 7 T MRI.J Magn Reson Imaging. 2025 Jul;62(1):201-212. doi: 10.1002/jmri.29693. Epub 2025 Jan 9. J Magn Reson Imaging. 2025. PMID: 39781600
-
Sertindole for schizophrenia.Cochrane Database Syst Rev. 2005 Jul 20;2005(3):CD001715. doi: 10.1002/14651858.CD001715.pub2. Cochrane Database Syst Rev. 2005. PMID: 16034864 Free PMC article.
-
Nutritional interventions for survivors of childhood cancer.Cochrane Database Syst Rev. 2016 Aug 22;2016(8):CD009678. doi: 10.1002/14651858.CD009678.pub2. Cochrane Database Syst Rev. 2016. PMID: 27545902 Free PMC article.
-
Home treatment for mental health problems: a systematic review.Health Technol Assess. 2001;5(15):1-139. doi: 10.3310/hta5150. Health Technol Assess. 2001. PMID: 11532236
References
LinkOut - more resources
Full Text Sources
Research Materials