

CRISPR/Cas9-based discovery of ccRCC therapeutic opportunities through molecular mechanism and immune microenvironment analysis
- PMID: 40709174
- PMCID: PMC12287010
- DOI: 10.3389/fimmu.2025.1619361
CRISPR/Cas9-based discovery of ccRCC therapeutic opportunities through molecular mechanism and immune microenvironment analysis
Abstract
Introduction: Clear cell renal cell carcinoma is a common and aggressive form of renal cell carcinoma. Its incidence continues to rise, and metastatic recurrence leads to poor clinical outcomes. Current prognostic biomarkers lack reliability. We integrated multi-omics data to discover key ccRCC genes and build a prognostic model to improve risk prediction and guide treatment decisions.
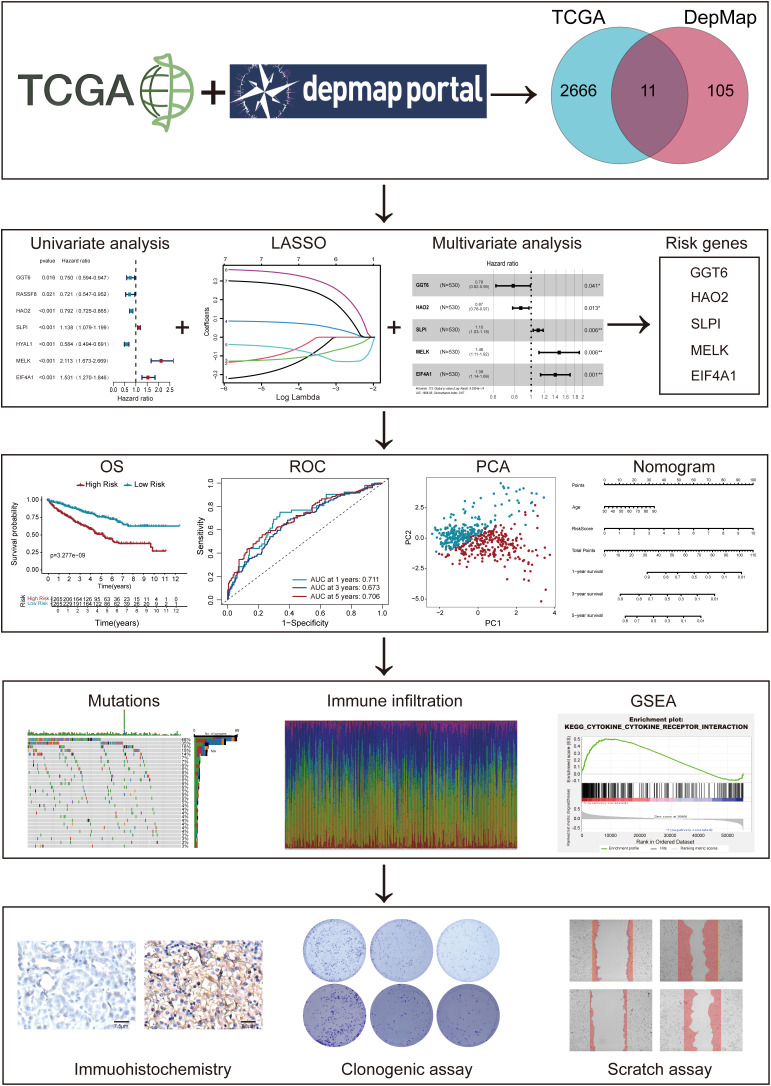
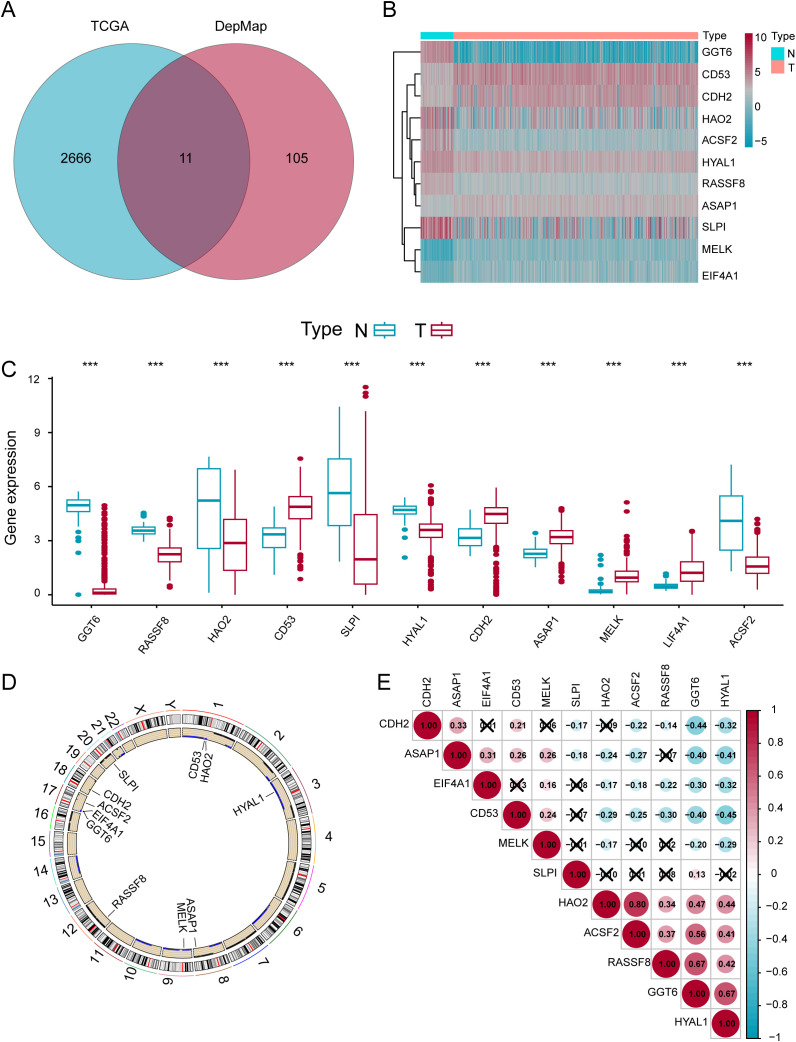
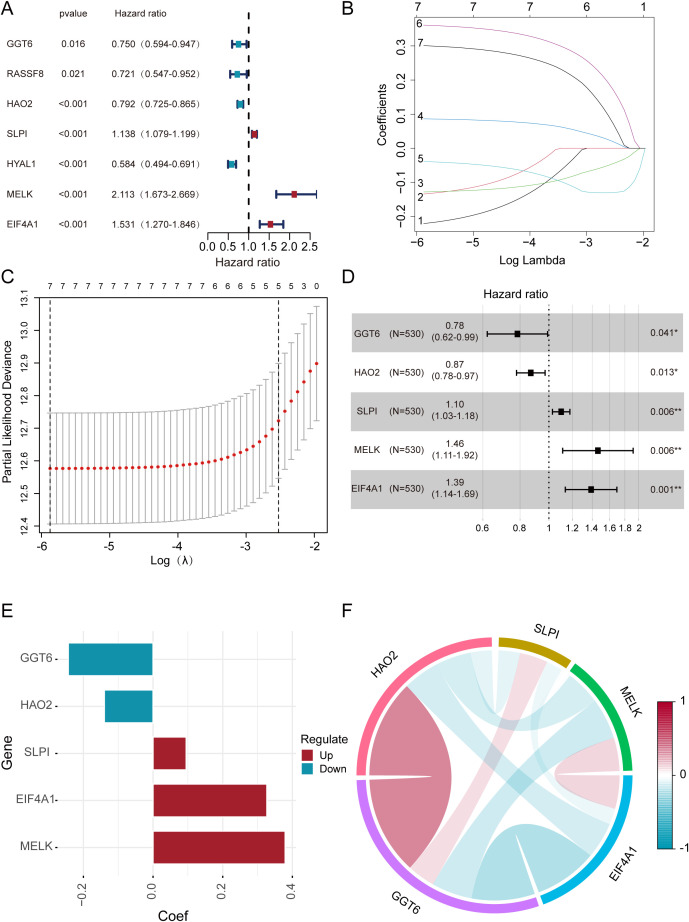
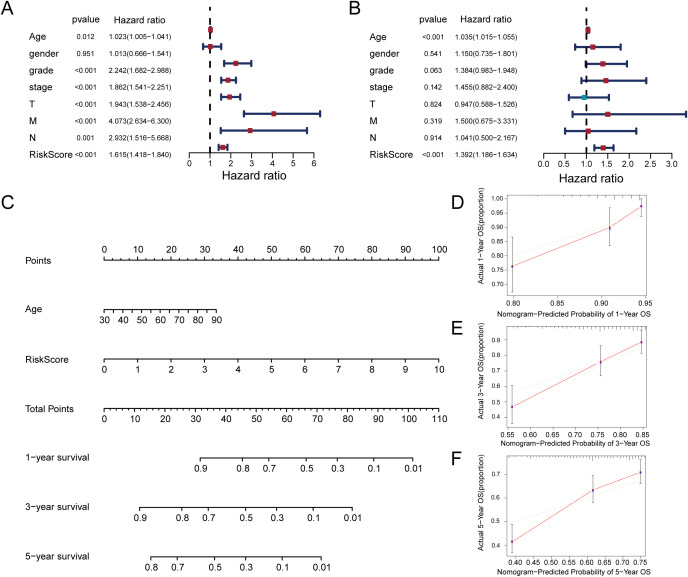
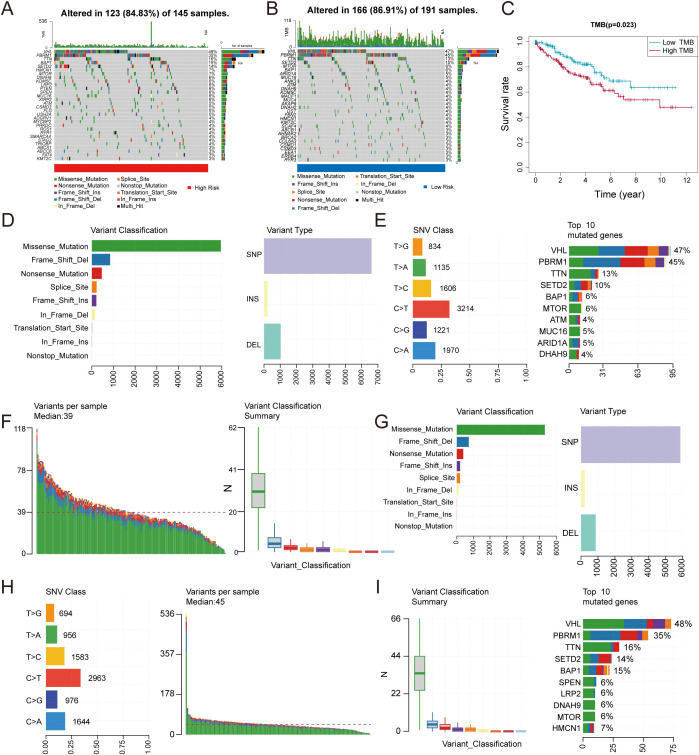
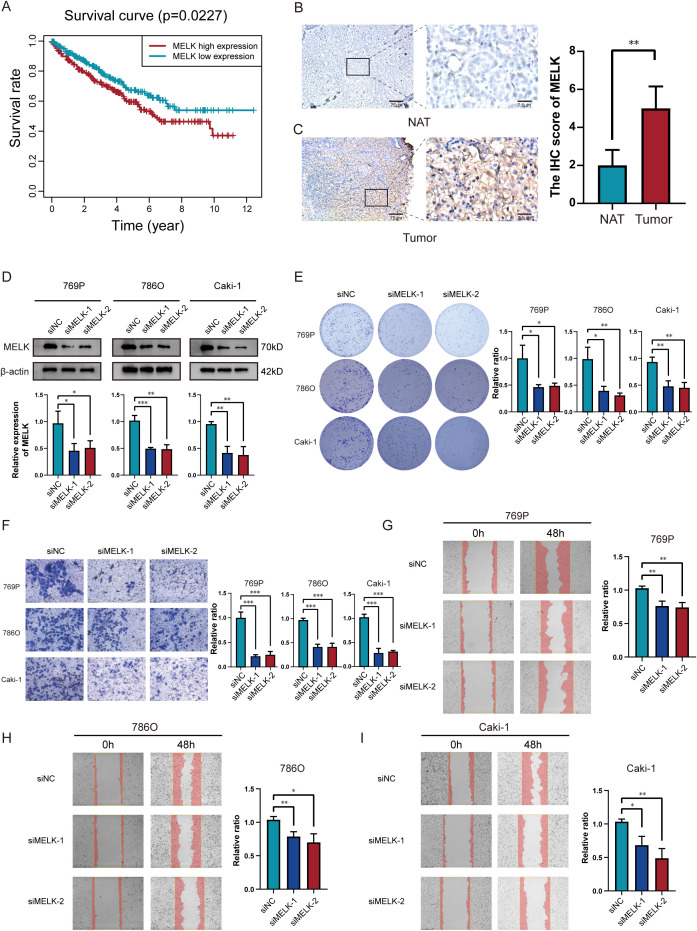
Methods: Our study integrated genome-wide CRISPR screening data from DepMap and transcriptomic profiles from TCGA to identify key genes associated with ccRCC pathogenesis. Initial screening identified 11 candidate genes through differential expression analysis and CRISPR functional validation. Using LASSO and Cox regression, we selected five key genes (GGT6, HAO2, SLPI, MELK, and EIF4A1) for model construction. The functional role of MELK was tested by knockdown experiments. Additional analyses included tumor mutation burden, immune microenvironment assessment, and drug response prediction.
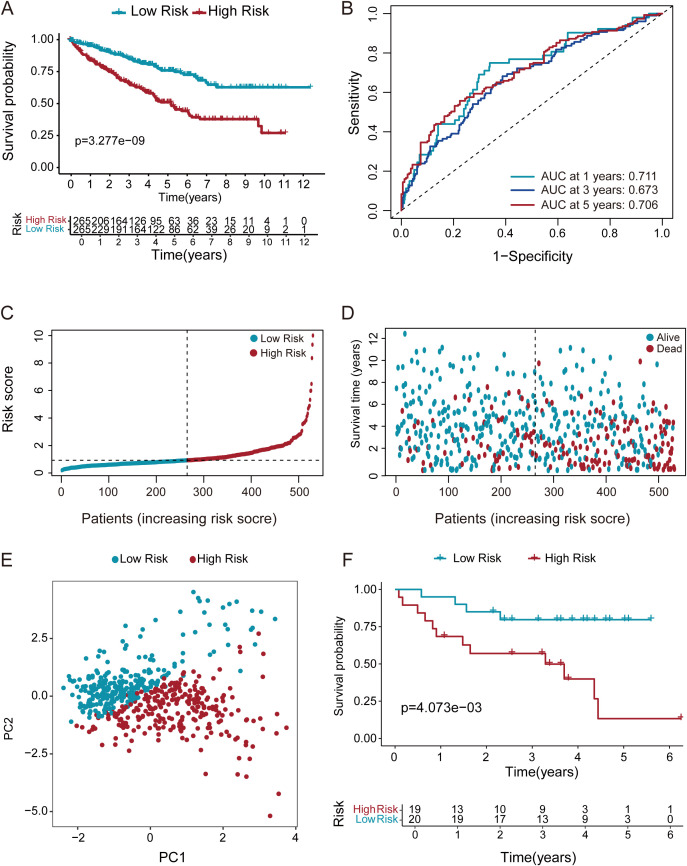
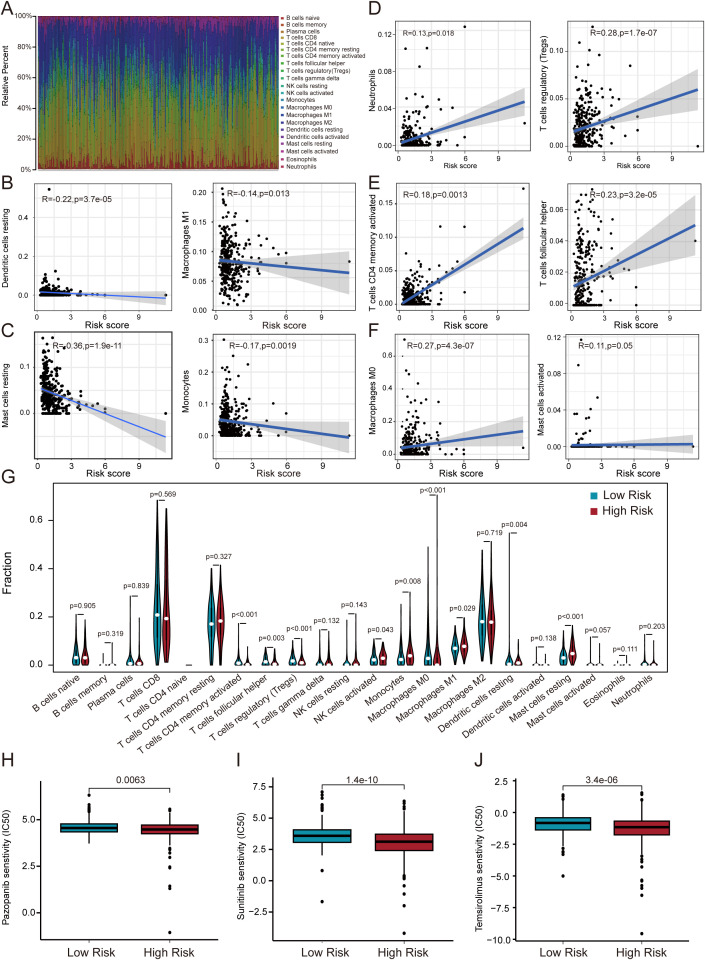
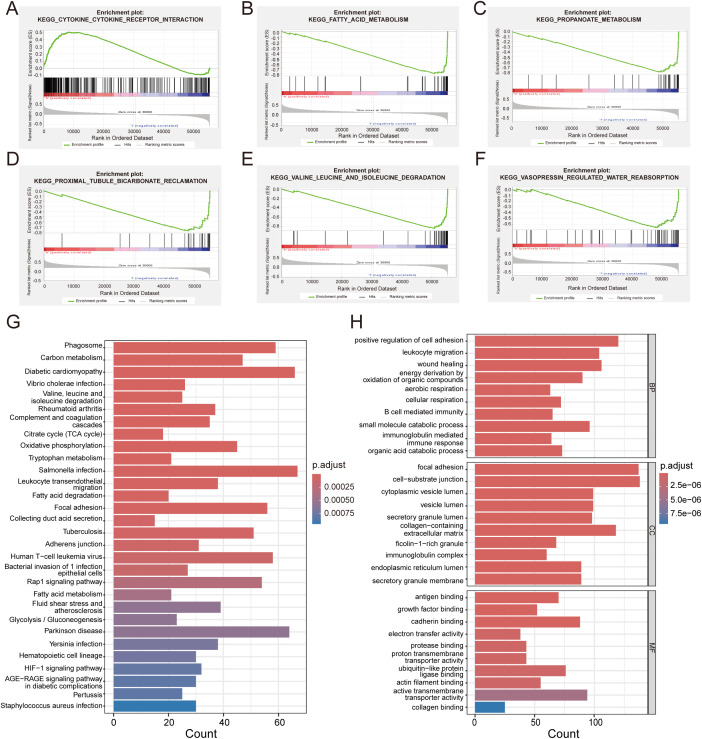
Results: The model stratified patients into high-risk and low-risk groups with distinct survival outcomes. High-risk cases showed higher mutation loads, immunosuppressive features, and activated cytokine pathways, whereas low-risk cases displayed metabolic pathway activity. MELK knockdown reduced cancer cell proliferation and migration. High-risk patients exhibited better responses to targeted drugs such as pazopanib and sunitinib.
Discussion: Our study demonstrates the pivotal role of MELK in ccRCC progression. This multi-omics-driven model elucidates MELK-mediated mechanisms and their interactions with the tumor microenvironment, providing novel strategies for risk stratification and targeted therapy. Future studies will validate these findings in independent cohorts and investigate the regulatory networks of MELK to identify potential therapeutic targets.
Keywords: CRISPR-Cas9 screening; MELK; ccRCC; immunotherapy; prognostic model.
Copyright © 2025 Han, Liu, Wang, Li, You, Liu, Nan, Ding, Dai, Zhang, Zhang, Liu and Li.
Conflict of interest statement
The authors declare that the research was conducted in the absence of any commercial or financial relationships that could be construed as a potential conflict of interest.
Figures
Similar articles
-
COL6A2 in clear cell renal cell carcinoma: a multifaceted driver of tumor progression, immune evasion, and drug sensitivity.J Transl Med. 2025 Aug 6;23(1):875. doi: 10.1186/s12967-025-06793-9. J Transl Med. 2025. PMID: 40770761 Free PMC article.
-
NME4: A novel metabolic-associated biomarker for prognosis prediction and immunotherapy response evaluation in clear cell renal cell carcinoma.Mol Immunol. 2025 Aug;184:149-163. doi: 10.1016/j.molimm.2025.06.011. Epub 2025 Jul 1. Mol Immunol. 2025. PMID: 40602220
-
Multi-omics analysis reveals the role of ribosome biogenesis in malignant clear cell renal cell carcinoma and the development of a machine learning-based prognostic model.Front Immunol. 2025 Jun 26;16:1602898. doi: 10.3389/fimmu.2025.1602898. eCollection 2025. Front Immunol. 2025. PMID: 40642093 Free PMC article.
-
A Systematic Review and Meta-analysis Comparing the Effectiveness and Adverse Effects of Different Systemic Treatments for Non-clear Cell Renal Cell Carcinoma.Eur Urol. 2017 Mar;71(3):426-436. doi: 10.1016/j.eururo.2016.11.020. Epub 2016 Dec 8. Eur Urol. 2017. PMID: 27939075
-
Immunotherapy for metastatic renal cell carcinoma.Cochrane Database Syst Rev. 2017 May 15;5(5):CD011673. doi: 10.1002/14651858.CD011673.pub2. Cochrane Database Syst Rev. 2017. PMID: 28504837 Free PMC article.
References
MeSH terms
Substances
LinkOut - more resources
Full Text Sources
Medical
Miscellaneous