. 2025 Jul 10:16:1582949.
doi: 10.3389/fimmu.2025.1582949. eCollection 2025.

Temporal TCR dynamics and epitope diversity mark recovery in severe COVID-19 patients

Affiliations

Temporal TCR dynamics and epitope diversity mark recovery in severe COVID-19 patients

Kriti Khare et al. Front Immunol. .

Abstract

Introduction: Severe COVID-19 is characterized by immune dysregulation, with T cells playing a central role in disease progression and recovery. However, the longitudinal dynamics of the T cell receptor (TCR) repertoire during the course of severe illness remain unclear.

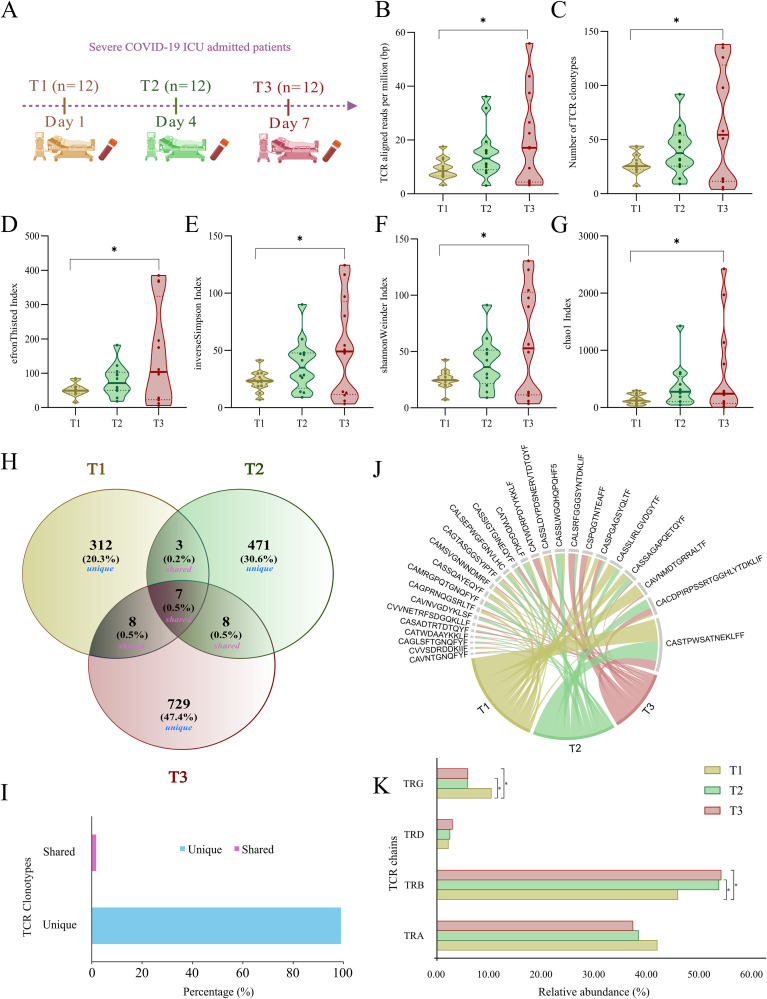
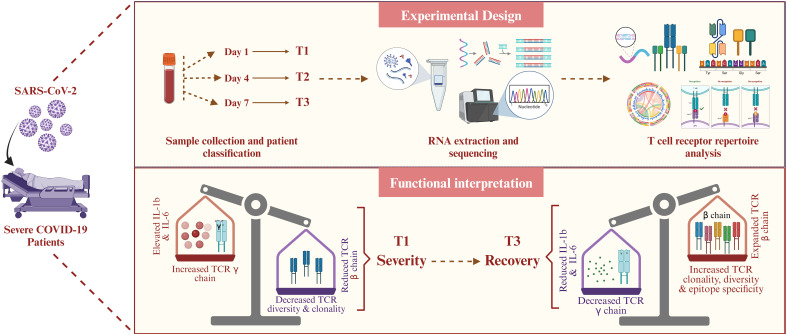
Methods: To investigate temporal changes in adaptive immunity, we analyzed peripheral blood samples from the ICU-admitted severe COVID-19 patients (n = 36) collected at three time points: Day 1 (T1), Day 4 (T2), and Day 7 (T3). Bulk RNA-sequencing was performed to extract TCR repertoires, and cytokine profiles were assessed in parallel. TCR clonotypes were annotated using VDJdb and TCRex to infer potential epitope specificities.

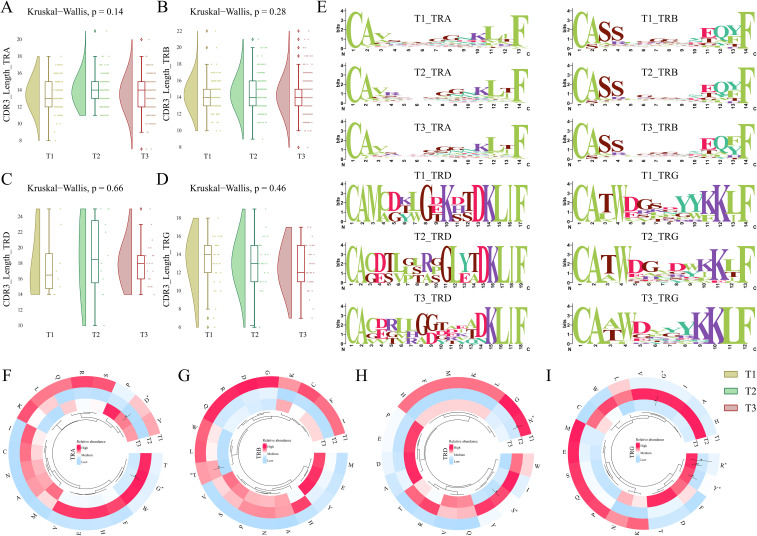
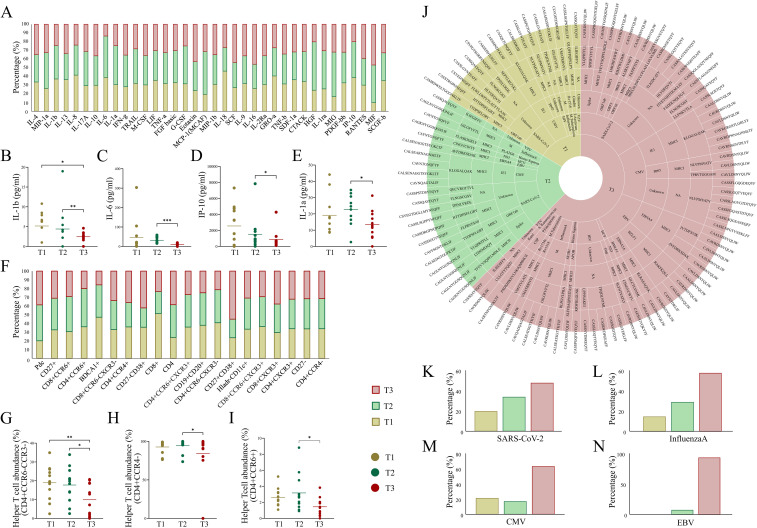
Results: By T3, we observed a 2.3-fold expansion in TCR clonotypes along with increased TCR-β (TRB) chain usage, indicating the emergence of a broad polyclonal T cell response. In contrast, TCR-γ (TRG) chain prevalence declined. Pro-inflammatory cytokines, including IL-1β and IL-6, were reduced over time, marking a shift toward immune resolution. Changes in CDR3 motifs and preferential TRBV gene segment usage were detected, suggesting repertoire adaptation. Additionally, annotated TCR clonotypes at T3 mapped to SARS-CoV-2 and other pathogen-associated epitopes (e.g., CMV, Plasmodium), reflecting possible cross-reactivity or memory T cell recruitment.

Discussion: These findings suggest a coordinated transition from immune dysfunction to recovery in severe COVID-19, marked by expanding TCR diversity, reduced inflammation, and predicted broadening of antigen recognition. The integrated analysis of TCR repertoire dynamics and cytokine profiles provides insights into the adaptive immune mechanisms underlying viral clearance and immune stabilization.

Keywords: COVID-19; ICU-admitted patients; TCR clonotypes; TCR dynamics; adaptive regulation.


Conflict of interest statement

The authors declare that the research was conducted in the absence of any commercial or financial relationships that could be construed as a potential conflict of interest.

Figures

Figure 1
Figure 1
Study design and experimental workflow. (A) Blood sample collection and demographics of the longitudinally severe COVID-19 patients recruited in this study. (B) RNA isolation, followed by library preparation and sequencing of the samples. A cytokine screening and cell type quantification were performed using plasma and blood samples, respectively, of each patient. (C) Pre-processing of the sequencing data, including data quality assessment, adapter trimming, alignment, and assembly of human-mapped reads, followed by TCR clonotype identification (MiXCR). (D) TCR repertoire downstream analysis (VDJtool), including clonality and diversity metrics, clonotype overlap metrics, VJ usage, and CDR3 motif analysis, followed by disease-specific clonotype annotation and epitope prediction (VDJdb and TCRex). (E) Result interpretation.
Figure 2
Figure 2
Sample distribution and TCR clonotype dynamics in ICU-admitted severe COVID-19 patients across T1, T2, and T3. (A) Blood collection of ICU-admitted severe COVID-19 patients at three time-points (T1, T2, and T3). (B, C) Violin plots depict the distribution of (B) TCR-aligned reads per million (bp) and (C) number of TCR clonotypes across T1, T2, and T3. (D-G) Violin plots representing significant differences within TCR clonal diversity indices, including (D) EfronThisted index, (E) inverse Simpson index, (F) Shannon Weiner index, and (G) chao1 index across three time points of severe COVID-19 patients. (H) Venn diagram represents the number and percentage of unique and public (shared) TCR clonotypes between T1, T2, and T3. (I) The bar plot depicts the overall percentage of unique (~99%) and shared (~1%) TCR clonotypes across all the samples. (J) Chord diagram depicting shared (public) TCR clonotypes between either two or three time points among severe COVID-19 patients. (K) Bar plot shows relative abundance differences between four chains of TCR, including TRA (α), TRB (β), TRD (δ), and TRG (γ) across T1, T2, and T3. Statistical significance for TCR-aligned reads, clonotypes, and diversity indices was calculated using a repeated measure ANOVA test (p < 0.05). Fisher’s exact test was performed for calculating the statistical significance (p < 0.05) between TCR chains across T1, T2, and T3. Data are represented as median +/- SEM. The significance value is denoted as ∗, where ∗ indicates p ≤ 0.05, ∗∗ indicates p ≤ 0.01, ∗∗∗ indicates p ≤ 0.001, and ∗∗∗∗ indicates p ≤ 0.0001.
Figure 3
Figure 3
Principal component analysis (PCA) plots with dynamic V and J segment usage across T1, T2, and T3. (A-F) Principal component analysis (PCA) plots depict variance among shared V and J segments for each TCR chain, including (A) TRAV, (B) TRBV, (C) TRBJ, and (D) TRAJ; (E, F) Combined PCA plots for (E) TRDV and TRGV, and (F) TRDJ and TRGJ, across T1, T2, and T3. (G, H) The matrix plot shows the frequency distribution in shared (G) V and (H) J segment usage across time points, illustrating either an increase or decrease in their usage from T1 to T3. (I) Violin plot represents significant common V and J segments across the three time points. (J, K) The matrix plot shows the frequency distribution in unique (J) V and (K) J segments across the three time points. Wilcoxon’s signed rank test was performed to calculate significance for shared V and J segments across T1, T2, and T3. Data are represented as median +/- SEM. The significance value is denoted as ∗, where ∗ indicates p ≤ 0.05, ∗∗ indicates p ≤ 0.01, ∗∗∗ indicates p ≤ 0.001, and ∗∗∗∗ indicates p ≤ 0.0001.
Figure 4
Figure 4
CDR3 length, motif, and amino acid composition across T1, T2, and T3 time points for severe COVID-19. (A-D) The raincloud plots represent median CDR3 lengths for each chain, including (A) TRA (α), (B) TRB (β), (C) TRD (δ), and (D) TRG (γ) across the three time points. (E) Weblogos depicting the CDR3 motifs within median lengths for each chain across T1, T2, and T3. (F-I) The circular heatmaps show the relative abundance of individual amino acids for (F) TRA (α), (G) TRB (β), (H) TRD (δ), and (I) TRG (γ) chains across three time points in severe COVID-19 patients. A Kruskal-Wallis (p < 0.05) test was performed for calculating significance for CDR3 lengths across T1, T2, and T3. The significance of amino acids between the temporal severe COVID-19 patients was performed using the Man-Whitney U test (p < 0.05). Data are represented as median +/- SEM. The significance value is denoted as ∗, where ∗ indicates p ≤ 0.05, ∗∗ indicates p ≤ 0.01, ∗∗∗ indicates p ≤ 0.001, and ∗∗∗∗ indicates p ≤ 0.0001.
Figure 5
Figure 5
Dynamics of cytokine, cell abundance, and TCR-specific epitopes across ICU-admitted longitudinal COVID-19 cases. (A) Bar plot depicts cytokine levels (pg/ml) in severe COVID-19 patients across the three time points. (B-E) Aligned dot plots show significant differences for (B) IL-1β, (C) IL-6, (D) IP-10, and (E) IL-1α across T1, T2, and T3. (F) Bar plot depicts differential abundance of cell types (cell surface markers) in severe COVID-19 patients across three time points. (G-I) Aligned dot plots show significant differences for (G) CD4+CCD6-CCR3-helper T-cell, (H) CD4+CCR4-helper T-cell, and (I) CD4+CCR6+ helper T-cell populations across T1, T2, and T3. (J) Sunburst plot represents species-specific epitope and MHC interaction with TCR clonotypes across T1, T2, and T3. (K) Bar plots show relative abundance of species-specific epitopes, including (K) SARS-CoV-2, (L) InfluenzaA, (M) CMV (Cytomegalovirus), and (N) EBV (Epstein-Barr virus) across the three time points in severe COVID-19 patients. Significance was performed using Wilcoxon’s signed rank test (p < 0.05). Data are represented as median +/- SEM. The significance value is denoted as ∗, where ∗ indicates p ≤ 0.05, ∗∗ indicates p ≤ 0.01, ∗∗∗ indicates p ≤ 0.001, and ∗∗∗∗ indicates p ≤ 0.0001.
Figure 6
Figure 6
Summary of temporal TCR dynamics and immune recovery in severe COVID-19. The figure highlights key immunological shifts across time, including increased TCR clonotype diversity, TRB chain dominance, reduced inflammation, and predicted epitope diversification, capturing the transition from immune dysregulation to recovery in severe COVID-19.

Similar articles

References

    1. Carter C, Notter J. COVID-19 Disease: a critical care perspective. Clinics Integrated Care. (2020) 1:100003. doi: 10.1016/j.intcar.2020.100003 - DOI
    1. Boechat JL, Chora I, Morais A, Delgado L. The immune response to SARS-CoV-2 and COVID-19 immunopathology - Current perspectives. Pulmonology. (2021) 27:423–37. doi: 10.1016/j.pulmoe.2021.03.008, PMID: - DOI - PMC - PubMed
    1. Hu B, Guo H, Zhou P, Shi Z-L. Characteristics of SARS-CoV-2 and COVID-19. Nat Rev Microbiol. (2020) 19:141–54. doi: 10.1038/s41579-020-00459-7, PMID: - DOI - PMC - PubMed
    1. Lamers MM, Haagmans BL. SARS-CoV-2 pathogenesis. Nat Rev Microbiol. (2022) 20:270–84. doi: 10.1038/s41579-022-00713-0, PMID: - DOI - PubMed
    1. Attaf M, Legut M, Cole DK, Sewell AK. The T cell antigen receptor: the Swiss army knife of the immune system. Clin Exp Immunol. (2015) 181:1–18. doi: 10.1111/cei.12622, PMID: - DOI - PMC - PubMed

LinkOut - more resources