. 2025 Jul 10:16:1623428.
doi: 10.3389/fimmu.2025.1623428. eCollection 2025.

Gut-tropic α4β7+CD8+ T cells contribute to pancreatic β cell destruction in type 1 diabetes

Affiliations

Gut-tropic α4β7+CD8+ T cells contribute to pancreatic β cell destruction in type 1 diabetes

Zhangyao Su et al. Front Immunol. .

Abstract

Background: T cells are crucial in destroying pancreatic β cells, resulting in insulitis in type 1 diabetes (T1D). However, only 1% to 2% of infiltrating CD8+ T cells are specific for islet autoantigens. The mechanisms driving non-cognate T cells to the islets and their potential pathogenic roles remain unclear.

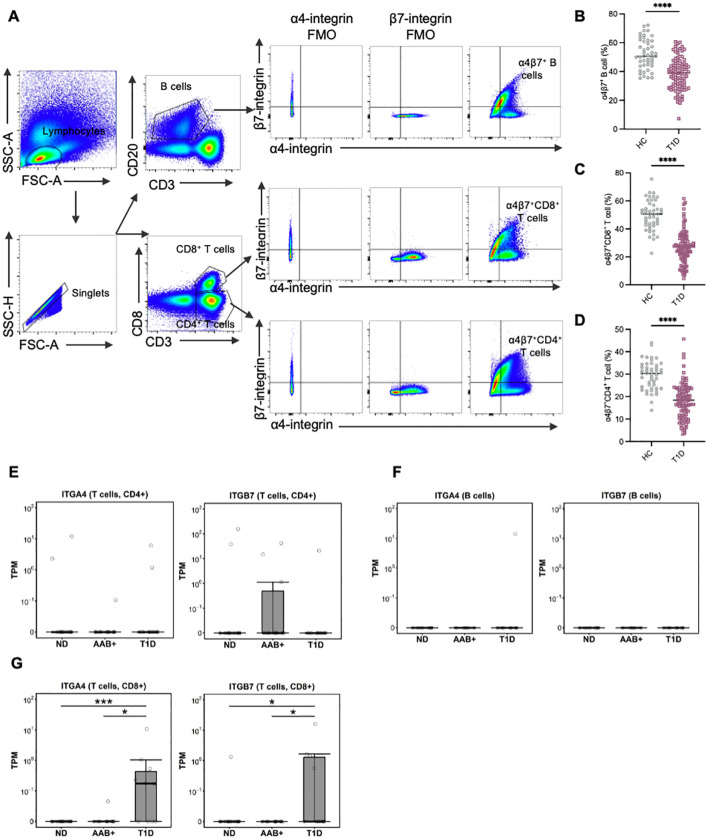
Methods: We analyzed the frequency and function of circulating gut-tropic immune cells in 99 patients with T1D and 57 healthy controls. We also analyzed single-cell RNA sequencing on pancreata from 10 T1D donors, 11 autoantibody-positive donors, and 15 non-diabetic controls. Correlation analysis was performed to elucidate the relationship between gut-tropic cells and clinical variables. In NOD mice, we examined gut-tropic T cell frequencies, cytokine profiles, and cytotoxicity at different disease stages. Additionally, we investigated the role of integrin α4β7 on gut-tropic T cells function and migration.

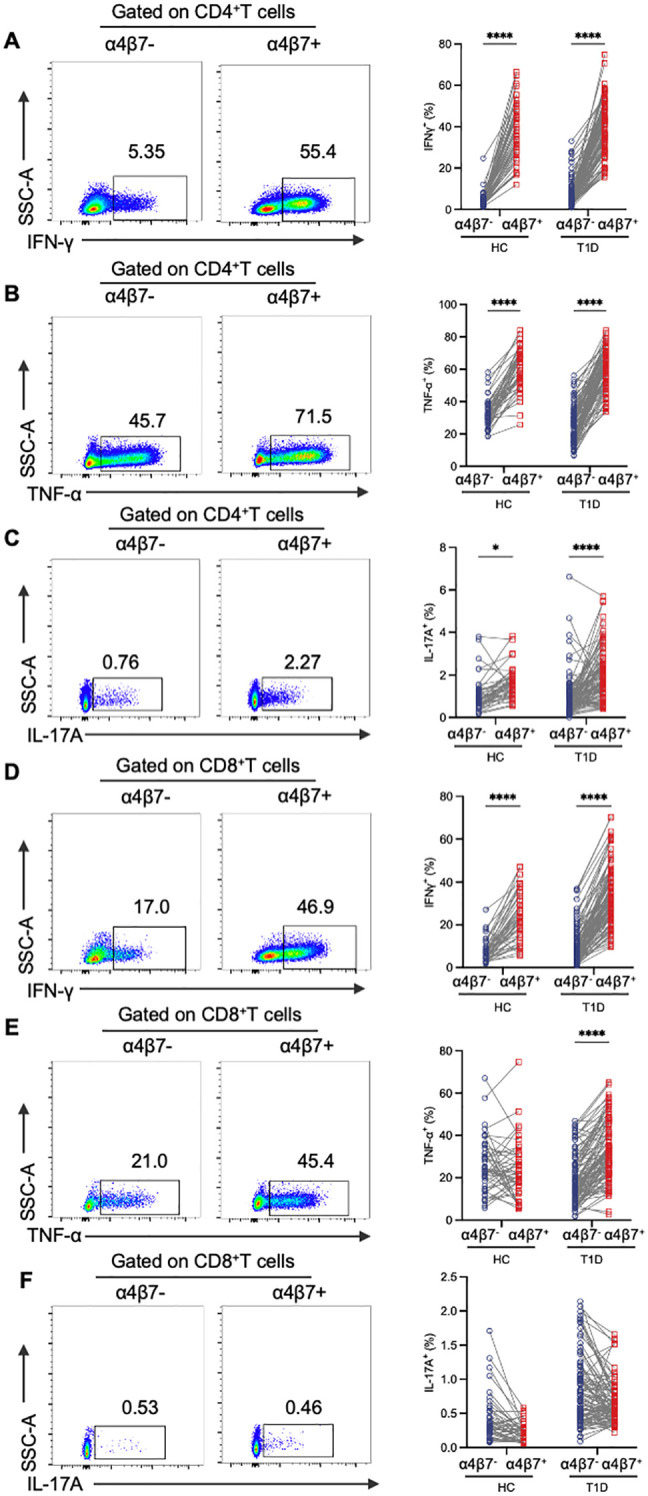
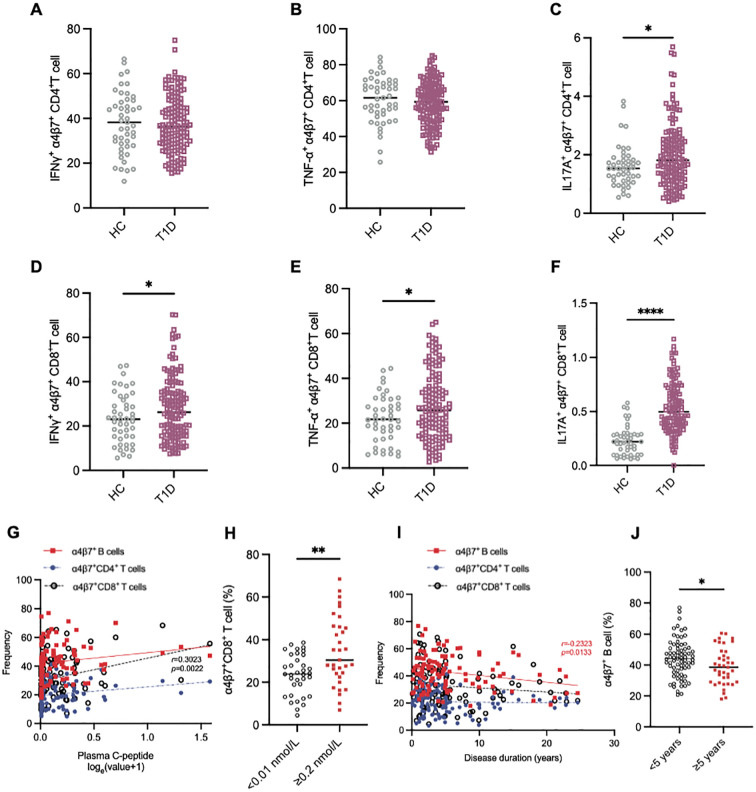
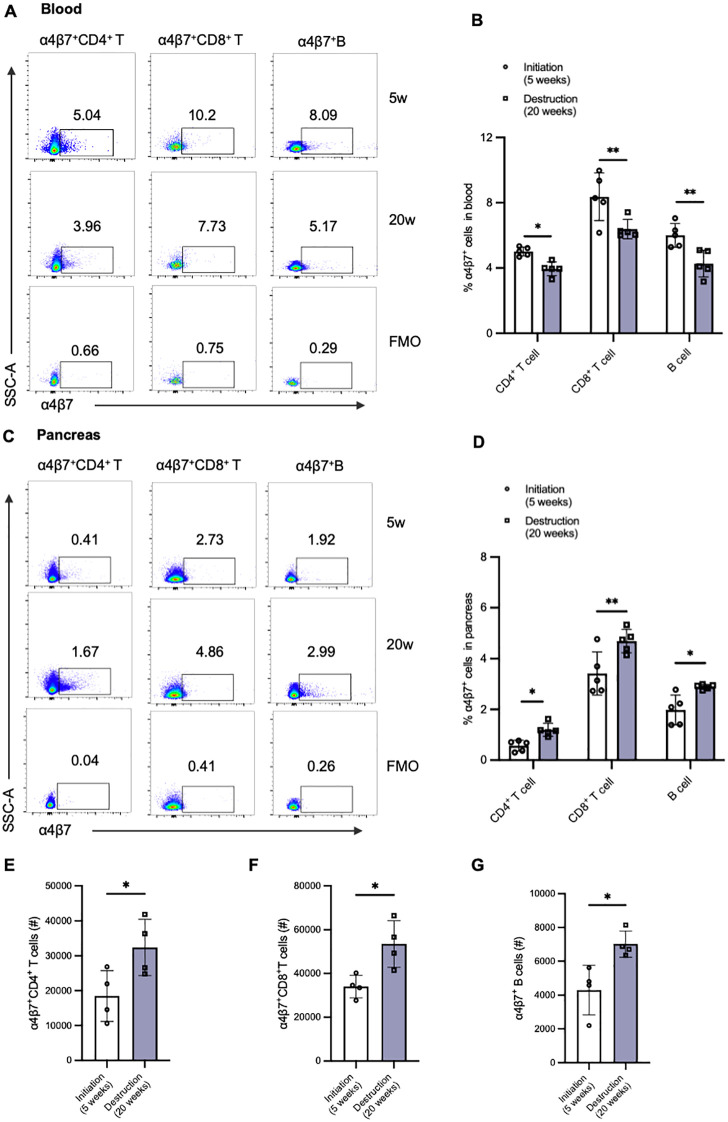
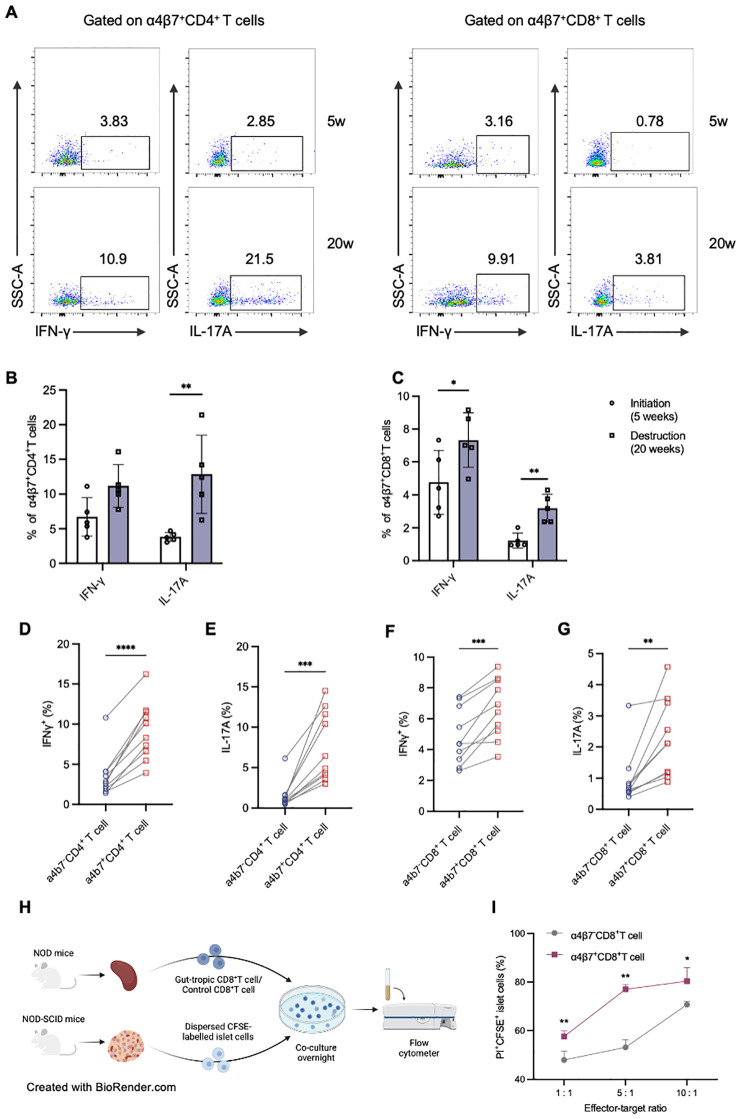
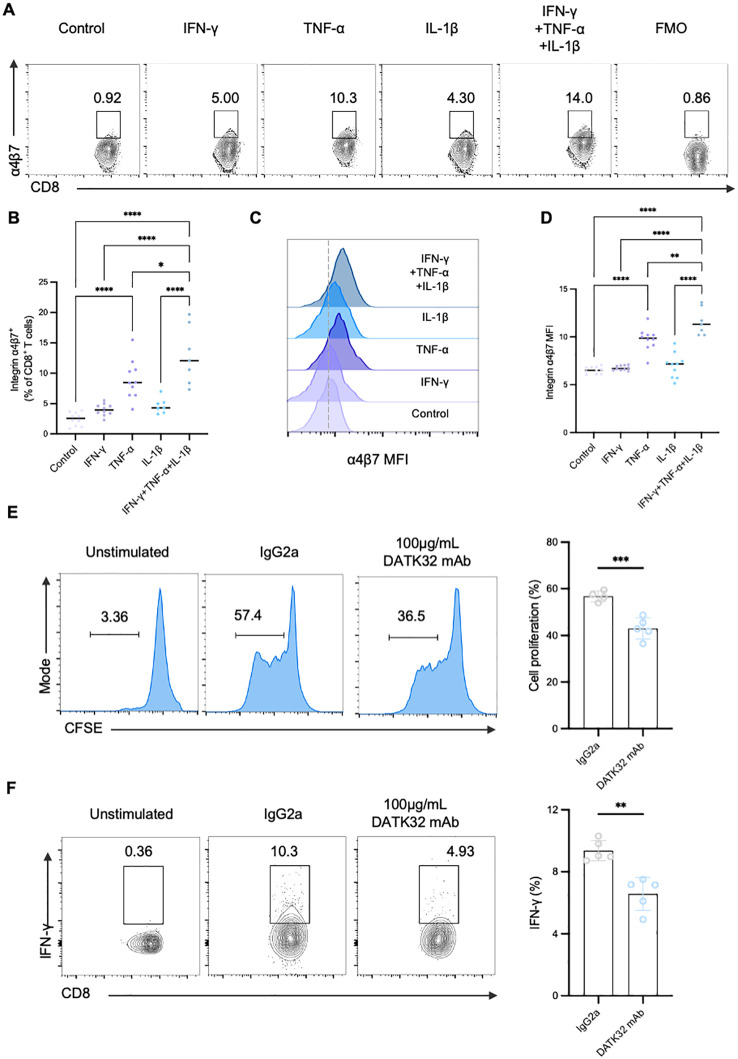
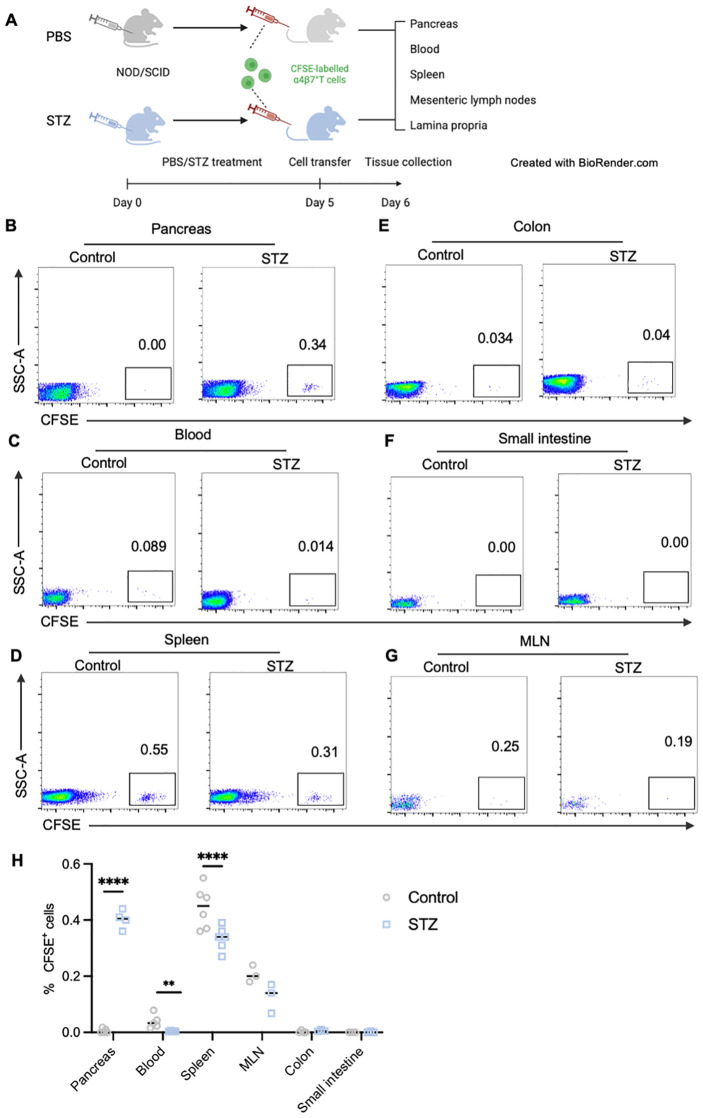
Results: Gut-tropic CD8+ T cells are reduced in peripheral blood but elevated in pancreatic islets of patients with T1D, correlating with impaired β-cell function. Gut-tropic CD8+ T cells exhibited stronger cytokine production than non-gut-tropic counterparts. In NOD mice, gut-tropic cells increased in the islets and decreased in the blood during insulitis progression. Gut-tropic CD8+ T cells showed augmented cytokine production and cytotoxicity against islet cells. Integrin α4β7 was a key mediator of the pathogenicity of CD8+ T cells and upregulated by the inflammatory signals. Insulitis directly drove gut-tropic CD8+ T cells migrating to inflamed islets.

Conclusions: Gut-tropic CD8+ T cells bridge the intestinal immune system and the pathogenesis of T1D, offering potential biomarkers and therapeutic targets.

Keywords: autoimmunity; gut tropic T cells; integrin α4β7; islet function; type 1 diabetes.


Conflict of interest statement

The authors declare that the research was conducted in the absence of any commercial or financial relationships that could be construed as a potential conflict of interest.

Figures

Figure 1
Figure 1
Circulating gut-tropic lymphocytes are altered in patients with T1D. (A) Representative example of flow cytometry gating of circulating gut-tropic α4β7+ lymphocytes. (B) Frequencies of circulating α4β7+ B cells among B cells in HCs (n = 57) and T1D patients (n = 99). (C) Frequencies of circulating α4β7+CD8+ T cells among CD8+ T cells in HCs (n = 57) and T1D patients (n = 99). (D) Frequencies of circulating α4β7+CD4+ T cells among CD4+ T cells in HCs (n = 57) and T1D patients (n = 99). (E) The difference in ITGA4 and ITGB7 mRNA expression in human islets was analyzed in CD4+ T cells from donors in AAB+ (n=11), T1D (n=10) and ND (n=15). (F) The difference in ITGA4 and ITGB7 mRNA expression in human islets was analyzed in B cells from donors in AAB+ (n=11), T1D (n=10) and ND (n=15). (G) The difference in ITGA4 and ITGB7 mRNA expression in human islets was analyzed in CD8+ T cells from donors in AAB+ (n=11), T1D (n=10) and ND (n=15). P values were calculated by non-parametric statistical tests. *p < 0.05, ***p < 0.001 and ****p < 0.0001. HC, healthy controls; T1D, type 1 diabetes; ND, non-diabetic controls; AAB+, autoantibodies positive.
Figure 2
Figure 2
Phenotypic analysis of α4β7+ T cells compared with α4β7- T cells in HCs and T1D patients. (A-C) Representative flow cytometry gating plots and qualification of IFN-γ (A), TNF-α (B) and IL-17A (C) expression in α4β7-CD4+ T and α4β7+CD4+ T cells in HCs (n = 57) and T1D patients (n = 99). (D-F) Representative flow cytometry gating plots and qualification of IFN-γ (D), TNF-α (E) and IL-17A (F) expression in α4β7-CD8+ T and α4β7+CD8+ T cells in HCs (n = 57) and T1D patients (n = 99). P values were calculated by a paired t-test. *p < 0.05 and ****p < 0.0001.
Figure 3
Figure 3
Aberrant immunophenotype of α4β7+CD8+ T cells in patients with T1D. (A-C) The frequency of IFN-γ+α4β7+CD4+ T cells (A), TNF-α+α4β7+CD4+ T cells (B) and IL-17A+α4β7+CD4+ T cells (C) in HCs (n = 57) and T1D patients (n = 99). (D-E) The frequency of IFN-γ+α4β7+CD8+ T cells (D), TNF-α+α4β7+CD8+ T cells (E) and IL-17A+α4β7+CD8+ T cells (F) in HCs (n = 57) and T1D patients (n = 99). (G-J) Correlation analysis between frequencies of α4β7+ lymphocytes and clinical variables. (G) Linear regression analysis of circulating α4β7+ lymphocytes frequencies and loge-transformed plasma C-peptide levels in T1D patients (n = 99). (H) Frequency of circulating α4β7+CD8+ T cells in patients with islet failure (n = 35) and those with preserved islet function (n = 33). (I) Linear regression analysis of circulating α4β7+ lymphocytes frequencies and disease duration in T1D patients (n = 99). (J) Frequency of circulating α4β7+ B cells in patients with less that 5 years (n = 59) or more than 5 years (n = 40) since diagnosis. Only significant Spearman’s correlation coefficients are represented. *p < 0.05, **p < 0.01 and ****p < 0.0001.
Figure 4
Figure 4
Alternations of gut-tropic immune cells in paired blood samples and pancreatic tissues of NOD mice during insulitis progression. (A, B) Representative flow cytometry plots and qualification of circulating α4β7+CD4+ T cells and α4β7+CD8+ T cells in 5-week-old and 20-week-old NOD mice. (C, D) Representative flow cytometry plots and qualification of pancreatic α4β7+CD4+ T cells and α4β7+CD8+ T cells in 5-week-old and 20-week-old NOD mice. (E-G) Cell number of α4β7+CD4+ T cells (E), α4β7+CD8+ T cells (F), and α4β7+ B cells (G) in the pancreas of 5-week-old and 20-week-old NOD mice. *p < 0.05 and **p < 0.01.
Figure 5
Figure 5
Murine gut-tropic CD8+ T cells show augmented cytokine production and islet β-cell cytotoxicity. (A-C) Representative flow cytometry plots and frequencies of IFN-γ and TNF-α in α4β7+CD4+ T (B) and α4β7+CD8+ T cells (C) in 5-week-old and 20-week-old NOD mice. (D, E) Frequencies of IFN-γ (D) and IL-17A (E) in α4β7-CD4+ T and α4β7+CD4+ T cells in the pancreas. (F, G) Frequencies of IFN-γ (F) and IL-17A (G) in α4β7-CD8+ T and α4β7+CD8+ T cells in the pancreas. (H) Schematic of in vitro β-cell killing assays. (I) The ratio of live CFSE-labelled islet cells in the indicated conditions. *p < 0.05, **p < 0.01, ***p < 0.001 and ****p < 0.0001. Created in BioRender. Su, Z. (2025) https://BioRender.com/4l79lpr.
Figure 6
Figure 6
Inflammatory cytokines can upregulate integrin α4β7 and integrin α4β7 is a mediator of gut-tropic CD8+ T cell cytotoxicity in T1D. (A-D) Regulation of α4β7 expression by proinflammatory cytokines. CD8+ T cells were incubated with various recombinant cytokines for 72 hours as indicated. FACS analysis (A) and the quantification of α4β7 expression on CD8+ T cells (B) were done. Histogram of α4β7 expression (C) and the quantification (D) by gMFI of the indicated groups (E–F) The α4β7 neutralizing antibody DATK32 suppresses the proliferation and cytokine secretion of CD8+ T cells in vitro. (E) Analysis of the proliferation capacity of gut-tropic CD8+ T cells after treatment with either 100 µg/mL isotype IgG2a control or with 100 µg/mL DATK32 after 72 hours. (F) Analysis of IFN-γ secretion in gut-tropic CD8+ T cells after treatment with either 100 µg/mL isotype IgG2a control or with 100 µg/mL DATK32 after 72 hours. *p < 0.05,**p < 0.01, ***p < 0.001 and ****p < 0.0001.
Figure 7
Figure 7
In vivo analysis of gut-tropic CD8+ T cells homing to inflamed islets in murine models. (A) Schematic diagram of in vivo homing experiments. (B-G) Representative dot plots displaying donor CD8+ T cells (CFSE+ cells) in pancreas (B), blood (C), spleen (D), colon (E), small intestine (F) and MLN (G) of host mice. (H) Frequencies of CFSE-labelled T cells in various tissues of control and STZ-treated group. **p < 0.01 and ****p < 0.0001. Created in BioRender. Su, Z. (2025) https://BioRender.com/4l79lpr.

Similar articles

References

    1. Herold KC, Delong T, Perdigoto AL, Biru N, Brusko TM, Walker LSK. The immunology of type 1 diabetes. Nat Rev Immunol. (2024) 24:435–51. doi: 10.1038/s41577-023-00985-4, PMID: - DOI - PMC - PubMed
    1. Campbell-Thompson M, Fu A, Kaddis JS, Wasserfall C, Schatz DA, Pugliese A, et al. Insulitis and β-cell mass in the natural history of type 1 diabetes. Diabetes. (2016) 65:719–31. doi: 10.2337/db15-0779, PMID: - DOI - PMC - PubMed
    1. Campbell-Thompson ML, Atkinson MA, Butler AE, Chapman NM, Frisk G, Gianani R, et al. The diagnosis of insulitis in human type 1 diabetes. Diabetologia. (2013) 56:2541–3. doi: 10.1007/s00125-013-3043-5, PMID: - DOI - PubMed
    1. Lundberg M, Seiron P, Ingvast S, Korsgren O, Skog O. Insulitis in human diabetes: A histological evaluation of donor pancreases. Diabetologia. (2017) 60:346–53. doi: 10.1007/s00125-016-4140-z, PMID: - DOI - PMC - PubMed
    1. Krogvold L, Wiberg A, Edwin B, Buanes T, Jahnsen FL, Hanssen KF, et al. Insulitis and characterisation of infiltrating T cells in surgical pancreatic tail resections from patients at onset of type 1 diabetes. Diabetologia. (2016) 59:492–501. doi: 10.1007/s00125-015-3820-4, PMID: - DOI - PubMed

MeSH terms