. 2025 Jul 10:16:1604179.
doi: 10.3389/fimmu.2025.1604179. eCollection 2025.

Comprehensive analysis of phosducin-like 3 as a diagnostic, prognostic and immunological marker in pan-cancer

Affiliations

Comprehensive analysis of phosducin-like 3 as a diagnostic, prognostic and immunological marker in pan-cancer

Zihao Li et al. Front Immunol. .

Abstract

Background: Phosducin-like 3 (PDCL3), a member of the photoreceptor family, is involved in angiogenesis and apoptosis. However, there is no pan-cancer analysis, and few studies have explored the effect of PDCL3 on tumor immune infiltration.

Method: Public datasets were used to explore the diagnostic and prognostic value of PDCL3. The relationship between PDCL3 expression and immune infiltration, tumor mutation burden (TMB), and microsatellite instability (MSI) was investigated. Additionally, the therapeutic value of PDCL3 was explored. Finally, differences in PDCL3 expression across cell clusters were analyzed using single-cell datasets. In vitro cellular assays were performed to assess the impact of PDCL3 expression on the proliferative capacity, migratory potential, and invasive properties of non-small cell lung cancer (NSCLC) cells.

Results: PDCL3 expression was upregulated in most tumors and correlated with poor outcomes, showing diagnostic and prognostic value. In addition, PDCL3 expression exhibited a positive correlation with infiltration of T helper 2 (Th2) cells and a negative correlation with infiltration of plasmacytoid dendritic cells (pDCs) across a variety of tumors. A relationship was also found between PDCL3 expression and TMB and MSI. Single-cell dataset analysis confirmed that PDCL3 expression was primarily in cancer cells and macrophages. In vitro functional analyses demonstrated that genetic silencing of PDCL3 significantly reduced proliferative rates, migratory activity, and invasive potential in pulmonary carcinoma cell models.

Conclusions: PDCL3 may contribute to cancer progression and is a potential candidate biomarker for pan-cancer diagnosis and prognosis. These findings suggest that targeting PDCL3 may provide a valuable strategy for cancer immunotherapy.

Keywords: PDCL3; bioinformatics analysis; biomarker; immune infiltration; pan-cancer.


Conflict of interest statement

The authors declare that the research was conducted in the absence of any commercial or financial relationships that could be construed as a potential conflict of interest.

Figures

Figure 1
Figure 1
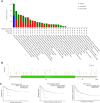
The expression of PDCL3 is upregulated in a variety of tumors. (A) Comparison of PDCL3 expression differences between tumor samples and corresponding paracancerous samples in various types of cancer. (B–G) Differential expression of PDCL3 from the UALCAN database between tumor and normal groups in BRCA, LIHC, LUAD, LUSC, OC, and PAAD). (H–M) Immunohistochemical images of PDCL3 in tumor and normal tissues, including BRCA, LIHC, LUAD, LUSC, OV, and PAAD, obtained from the HPA database. *p < 0.05; ***p < 0.001.
Figure 2
Figure 2
Diagnostic value of PDCL3. (A) Diagnostic ROC curves constructed based on PDCL3 expression levels in BRCA. (B) Diagnostic ROC curves constructed based on PDCL3 expression levels in COAD. (C) Diagnostic ROC curves constructed based on PDCL3 expression levels in GBM. (D) Diagnostic ROC curves constructed based on PDCL3 expression levels in HNSC. (E) Diagnostic ROC curves constructed based on PDCL3 expression levels in LIHC. (F) Diagnostic ROC curves constructed based on PDCL3 expression levels in LUAD. (G) Diagnostic ROC curves constructed based on PDCL3 expression levels in LUSC. (H) Diagnostic ROC curves constructed based on PDCL3 expression levels in STAD. (I) Diagnostic ROC curves constructed based on PDCL3 expression levels in THYM.
Figure 3
Figure 3
PDCL3 expression was upregulated in cases with advanced tumor stages. (A, B) Analysis of PDCL3 expression in ACC cases with different T stages or N stages. (C) Comparison of PDCL3 expression in BRCA cases with different T stages. (D) Comparison of PDCL3 expression in HNSC cases with different N stages. (E) Comparison of PDCL3 expression in KIRP cases with different M stages. (F, G) Differential analysis of PDCL3 expression in LIHC cases with different T stages or pathological stages. (H–J) Study of the relationship between PDCL3 expression and tumor stage in LUAD. *p < 0.05; **p < 0.01.
Figure 4
Figure 4
Prognostic value of PDCL3 in pan-cancer. (A–L) KM survival curve constructed by grouping according to the expression of PDCL3 in ACC, BRCA, GBM, HNSC, KIRP, LGG, LIHC, LUAD, MESO, STAD, UCEC, and UVM.
Figure 5
Figure 5
Genetic alteration properties of PDCL3 in pan-cancer. (A) Frequency and types of PDCL3 alterations in pan-cancer from TCGA. (B) Summary visualization of PDCL3 alterations from the cBioPortal database. (C) Potential relevance of alterations in PDCL3 to the prognosis of STAD.
Figure 6
Figure 6
Relationship between PDCL3 and immune infiltration. (A-I) Study on the correlation between PDCL3 expression and immune infiltration in ACC, BRCA, GBM, LGG, LIHC, LUAD, STAD, UCEC, and UVM. In these dot plots, the size of the dot represents the correlation, and the color of the dot indicates the p-value. We set the absolute value of the correlation greater than 0.2 and a p-value less than 0.05 as the threshold.
Figure 7
Figure 7
Correlation analysis between PDCL3 with TMB and MSI. (A) Investigation of the correlation between PDCL3 and TMB. (B) Investigation of the relationship between PDCL3 and MSI. *p < 0.05; **p < 0.01; ***p < 0.001.
Figure 8
Figure 8
Functional analysis and annotation of PDCL3 in tumors. (A) Volcano map constructed from DEGs obtained by analysis of LUAD samples based on PDCL3 expression levels. (B) Dot plot demonstrating GO analysis of DEGs related to PDCL3 in LUAD. (C) Dot plot demonstrating KEGG analysis of DEGs related to PDCL3 in LUAD. (D) Volcano map constructed from DEGs obtained by analysis of LIHC samples based on PDCL3 expression levels. (E) Dot plot demonstrating GO analysis in LIHC. (F) Dot plot demonstrating KEGG analysis in LIHC. (G) Volcano map constructed from DEGs obtained by analysis of STAD cases based on PDCL3 expression levels. (H) Dot plot of the results obtained by performing GO analysis on DEGs in STAD. (I) Dot plot of the results obtained by performing KEGG analysis on DEGs in STAD. (J) Volcano map constructed from DEGs obtained by analysis of BRCA cases based on PDCL3 expression levels. (K) Demonstration of the results obtained from GO analysis of DEGs in BRCA by dot plot. (L) Demonstration of the results obtained from KEGG analysis of DEGs in BRCA by dot plot.
Figure 9
Figure 9
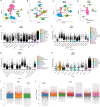
Comparison of PDCL3 expression at the cellular level. (A) UMAP plot for dimension reduction and cell annotation of LUAD single-cell sequencing data (GSE189357). (B) UMAP plot of dimension reduction and cell annotation in LIHC single-cell sequencing data (GSE242889). (C) UMAP plot presenting dimension reduction and cell annotation in BRCA single-cell sequencing data (GSE263995). (D) Demonstration of dimension reduction and cell clustering of STAD single-cell sequencing dataset (GSE184198) by UMAP plot. (E) Differential expression of PDCL3 at the cellular level in LUAD. (F) Expression analysis of PDCL3 at the single-cell sequencing level in LIHC. (G) Differences in PDCL3 expression at the BRCA single-cell sequencing level. (H) Comparison of PDCL3 expression between cell clusters in STAD. (I) Volcano plot of the differences between invasive adenocarcinoma (IAC), minimally invasive adenocarcinoma (MIA), and adenocarcinoma in situ (AIS) in the GSE189357 dataset. (J) Volcano plot of differential analysis between 13 sets of cell clusters in the GSE189357 dataset (this figure presents the results of differential analysis of immune cells only).
Figure 10
Figure 10
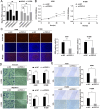
Functional characterization of PDCL3 in NSCLC progression. (A) PDCL3 mRNA expression in A549 and H1299 cells post-transfection with siRNA (si-PDCL3-2: targeting sequences). (B) CCK-8 viability curves showing time-dependent proliferation suppression in PDCL3-depleted cells. (C) EdU incorporation assay quantifying DNA replication rates. Red: EdU-positive nuclei; Blue: Hoechst 33342 counterstain. (D) Transwell migration and Matrigel-based invasion assays. (E) Scratch wound closure kinetics monitored at 0/24 h Migration distance calculated as percentage wound closure. *p < 0.05; **p < 0.01; ***p < 0.001.

References

    1. Siegel RL, Giaquinto AN, Jemal A. Cancer statistics, 2024. CA Cancer J Clin. (2024) 74:12–49. doi: 10.3322/caac.21820, PMID: - DOI - PubMed
    1. Sung H, Ferlay J, Siegel RL, Laversanne M, Soerjomataram I, Jemal A, et al. Global cancer statistics 2020: GLOBOCAN estimates of incidence and mortality worldwide for 36 cancers in 185 countries. CA Cancer J Clin. (2021) 71:209–49. doi: 10.3322/caac.21660, PMID: - DOI - PubMed
    1. Yang Y. Cancer immunotherapy: harnessing the immune system to battle cancer. J Clin Invest. (2015) 125:3335–7. doi: 10.1172/JCI83871, PMID: - DOI - PMC - PubMed
    1. Morad G, Helmink BA, Sharma P, Wargo JA. Hallmarks of response, resistance, and toxicity to immune checkpoint blockade. Cell. (2021) 184:5309–37. doi: 10.1016/j.cell.2021.09.020, PMID: - DOI - PMC - PubMed
    1. Lin JJ, Shaw AT. Resisting resistance: targeted therapies in lung cancer. Trends Cancer. (2016) 2:350–64. doi: 10.1016/j.trecan.2016.05.010, PMID: - DOI - PMC - PubMed

Substances

LinkOut - more resources