[Preprint]. 2025 Jul 14:rs.3.rs-7060088.
doi: 10.21203/rs.3.rs-7060088/v1.

BCL-2 Inhibition via Venetoclax at ART Initiation Induces Long-Term Reduction of the Intact SIV Reservoir

Affiliations

BCL-2 Inhibition via Venetoclax at ART Initiation Induces Long-Term Reduction of the Intact SIV Reservoir

Tomas Raul Wiche Salinas et al. Res Sq. .

Abstract

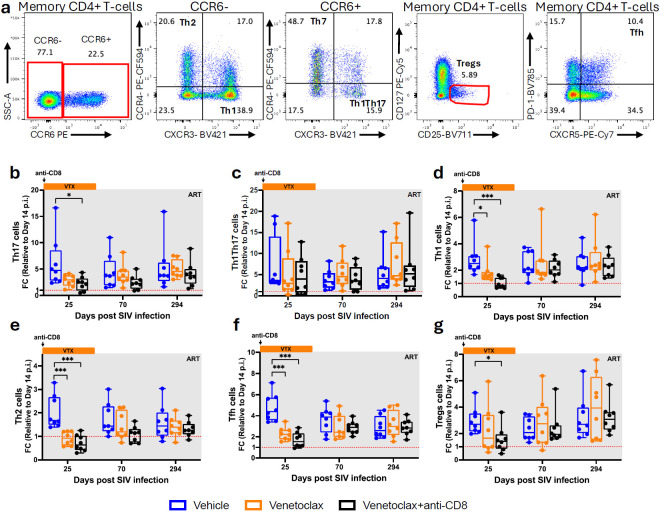
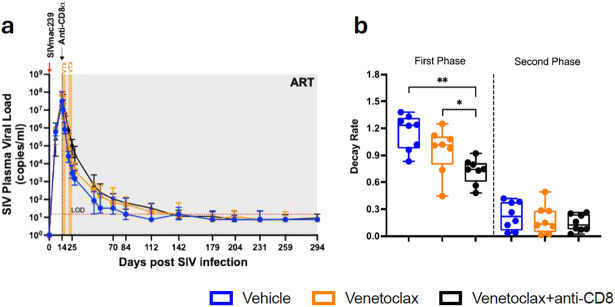
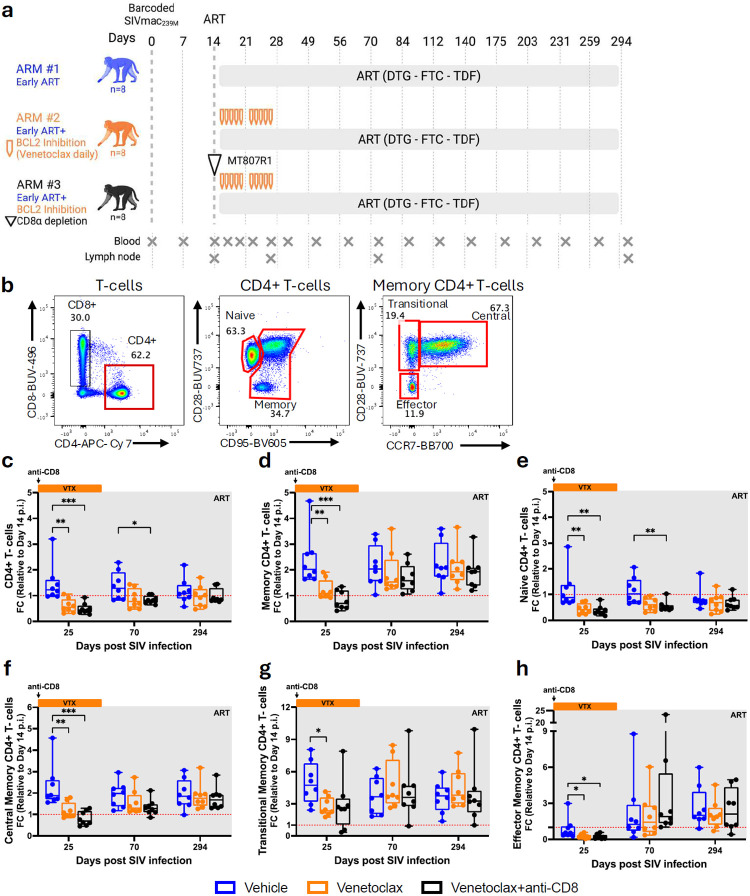
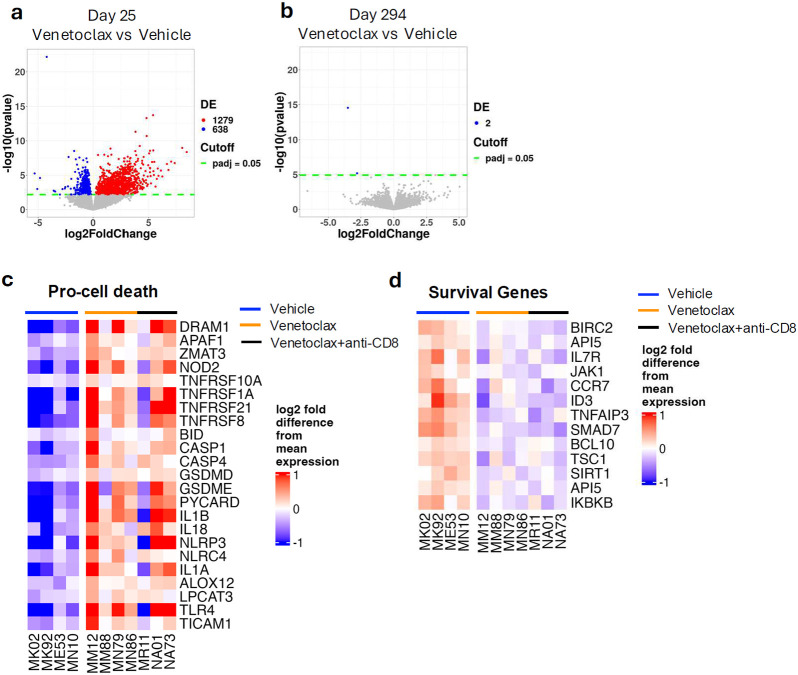
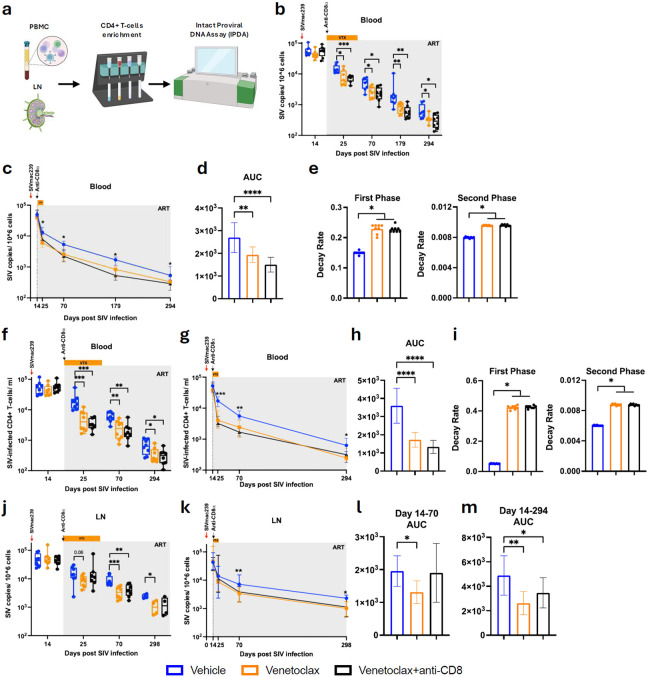
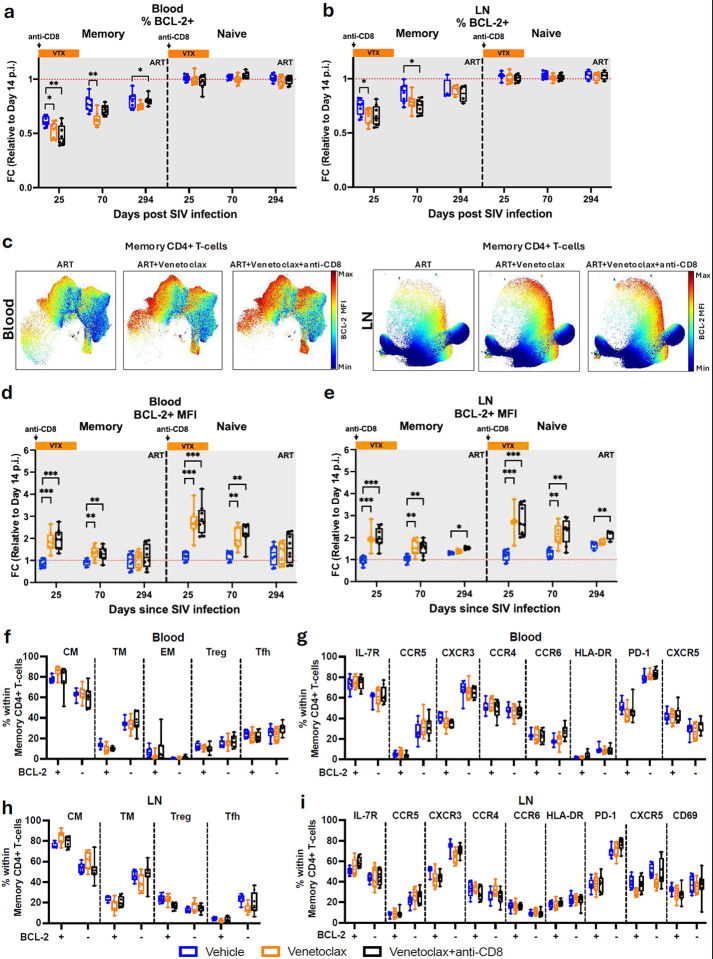
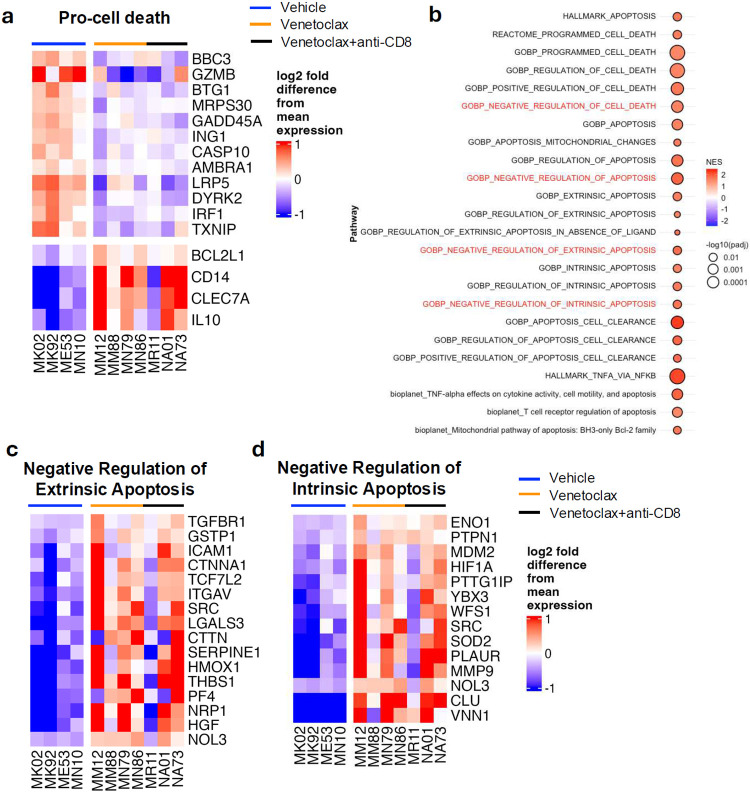
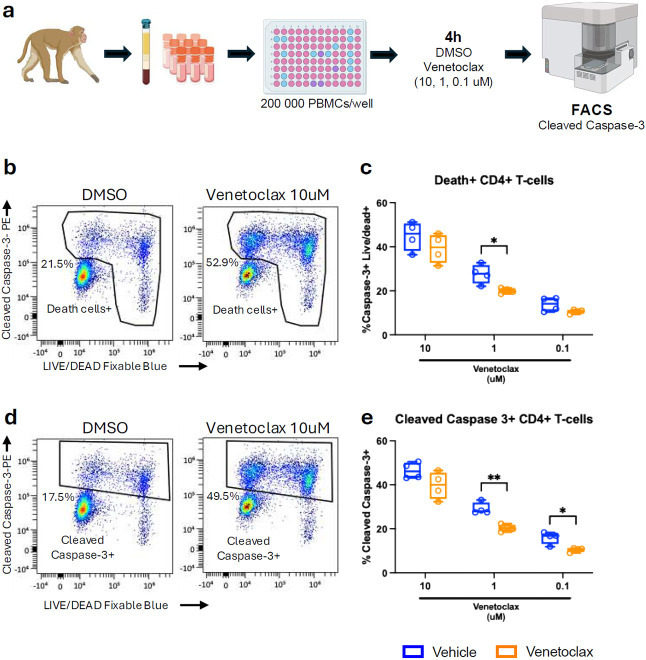
The anti-apoptotic molecule BCL-2 favors the maintenance of the CD4+ T-cell reservoir during Human Immunodeficiency Virus (HIV) infection. We investigated directly in-vivo whether BCL-2 inhibition using venetoclax at the initiation of antiretroviral therapy (ART) would reduce the size of the viral reservoir. Twenty-four SIVmac239-infected rhesus macaques (RMs) initiated ART at day 14 post-infection (p.i.), alone or with a 10-day treatment with venetoclax or venetoclax plus CD8α depletion, and followed up to day 294 p.i. A rapid, statistically significant, and sustained reduction in the intact SIV reservoir was observed in venetoclax-treated RMs in blood and lymph nodes (LNs). This reduction was driven by reduced survival and depletion of CD4+T-cell subsets that critically contribute to the reservoir. CD4+ T-cells that persisted after venetoclax treatment exhibited elevated per-cell levels of BCL-2, reduced expression of pro-apoptotic molecules such as PUMA, increased expression of additional anti-apoptotic molecules, including BCL-xL, and a partial reduction in apoptotic sensitivity in ex vivo assays. These findings provide mechanistic insights for the venetoclax-induced pro-cell death changes in CD4+ T-cells, support the rationale for extended venetoclax dosing, and suggest that combining BCL-2 inhibition with agents targeting additional anti-apoptotic molecules can enhance clearance of the viral reservoir in HIV cure strategies.


Figures

Extended Data Fig. 1.
Extended Data Fig. 1.. Venetoclax effectively targets functional CD4+ T helper cells subsets.
a, Representative gating strategy used to identify CD4+ T helper functional subsets. b–g, Fold change of Th17 (b), Th1Th17 (c), Th1 (d), Th2 (e), Tfh (f), and Tregs (g) cells counts relative to baseline in blood. RMs are color-coded and grouped based on treatment arm, with population sizes indicated for all analyses: vehicle (n = 8), blue; venetoclax (n = 8), orange; venetoclax + anti-CD8 (n = 8), black. All data are presented as median ± 25th and 75th percentile and were analyzed using a two-sided Mann–Whitney U test. *P ≤ 0.05, **P < 0.01, ***P < 0.001, ****P < 0.0001.
Extended Data Fig 2.
Extended Data Fig 2.. SIV plasma viral load kinetics.
a, Plasma viral loads in vehicle-, venetoclax-, and venetoclax + anti-CD8–treated RMs from day 7 p.i. to day 294 p.i. b, Decay rates of plasma viral loads calculated using a biphasic decay model. RMs are color-coded and grouped based on treatment arm, with population sizes indicated for all analyses: vehicle (n = 8), blue; venetoclax (n = 8), orange; venetoclax + anti-CD8 (n = 8), black. The detection limit for plasma viral load assays was 15 copies/ml through day 204 p.i., and 3 copies/ml at days 231, 259, and 294 p.i. All data are presented as median ± interquartile range.
Fig 1.
Fig 1.. BCL-2 inhibition via venetoclax depletes CD4+ T cell subsets associated with viral persistence.
a, Schematic for the study design. RMs were infected i.v. with SIVmac239 and initiated on ART at day 14 p.i. Venetoclax (10 daily doses) and/or anti-CD8α antibody (1 dose) were started at ARTi until day 25 p.i., with follow-up through day 294 p.i. Blood and LNs samples were collected at the indicated time points. b, Flow cytometry representative staining and gating strategy used to identify CD4+ T cells subsets. c-h, Fold change of CD4+ T cells counts relative to baseline in blood, including total (c), memory (d), naïve (e), central memory (f), transitional memory (g), and effector memory (h) CD4+ T cells. RMs are color-coded and grouped based on treatment arm, with population sizes indicated for all analyses: vehicle (n = 8), blue; venetoclax (n = 8), orange; venetoclax + anti-CD8 (n = 8), black. All data are presented as median ± 25th and 75th percentile and were analyzed using a two-sided Mann–Whitney U test. *P ≤ 0.05, **P < 0.01, ***P < 0.001, ****P < 0.0001.
Fig. 2.
Fig. 2.. BCL-2 inhibition upregulates genes promoting cell death and downregulates survival genes in CD4+ T-cells.
a, b Volcano plot showing differentially expressed genes (DEGs) in CD4+ T cells sorted from venetoclax and venetoclax + anti-CD8− treated RMs compared to vehicle-treated RM (a) at the end of venetoclax treatment (day 25 p.i.) or (b) at the end of the follow-up period (day 294 p.i.). c, d, Heatmap showing log2 fold difference from mean expression of representative pro-death genes (c) and survival genes (d) upregulated or downregulated, respectively, by venetoclax treatment. Analyses were performed on samples from vehicle (n = 4), venetoclax (n = 4), and venetoclax + anti-CD8 (n = 3) treated RMs. Gene selection was based on relevance to cell death pathways. Genes with an adjusted P < 0.05 were considered for heatmaps.
Fig. 3
Fig. 3. BCL-2 inhibition via venetoclax induces a rapid and sustained reduction of the intact SIV reservoir.
a, Experimental workflow. CD4+ T cells were isolated from PBMCs and LNs by magnetic enrichment and used to quantify intact SIV proviral DNA with the intact proviral DNA assay (IPDA). b, j, intact SIV DNA copies per 106 CD4+ T cells at indicated time points. Shown are individual values with median and 25th–75th percentiles from blood (b) and LNs (j). c, k, Grouped longitudinal kinetics of intact SIV DNA copies per 106 CD4+ T cells from blood (c) and LNs (k). Data are shown as median and interquartile range (IQR). d, Area under the curve (AUC) of intact SIV DNA copies per 106 CD4+ T cells from day 14 to day 294 p.i. for blood. Shown are mean ± s.d. e, Biphasic decay model of intact SIV DNA copies per 106 CD4+ T cells. Shown are individual fits with mean ± s.d. f, Number of CD4+ T cells with intact SIV DNA per ml of blood. Individual values are shown with median and 25th–75th percentiles. g, grouped longitudinal kinetics of CD4+ T cells with intact SIV DNA per ml of blood, shown as median and IQR. h, AUC of CD4+ T cells with intact SIV per ml of blood from day 14 to day 294 p.i., shown as mean ± s.d. i, Biphasic decay model of CD4+ T cells with intact SIV DNA per ml of blood. Shown are individual fits with mean ± s.d. l, m, AUC of intact SIV DNA copies per 106 LN CD4+ T cells from day 14 to day 70 (l) and day 14 to day 294 (m), shown as mean ± s.d. RMs are color-coded and grouped by treatment arm: vehicle (n = 8), blue; venetoclax (n = 8), orange; venetoclax + anti-CD8 (n = 8), black. Data in panels b, c, f, and g were analyzed using two-sided Mann–Whitney U tests. Data in d and h were analyzed using ordinary one-way ANOVA. Data in e and i were analyzed using the Wald test. P ≤ 0.05, P < 0.01, P < 0.001, P < 0.0001.
Fig. 4.
Fig. 4.. Venetoclax treatment reduces the frequency of CD4+BCL-2+ T cells, with those persisting showing higher BCL-2 expression on a per-cell basis.
a, b, Fold change of the frequency of BCL-2+ cells within memory and naïve CD4+ T cells relative to day 14 p.i. in blood (a) and LNs (b). c, UMAP visualization of flow cytometry data showing BCL-2 expression patterns in memory CD4+ T cells from blood and LNs of vehicle, venetoclax, or venetoclax + anti-CD8 antibody-treated RMs. d, e, Fold change of BCL-2 MFI in BCL2+ memory and naïve CD4+ T cells relative to day 14 p.i. from blood (d) and LNs (e). f-i, Phenotypic analysis comparing BCL-2+ and BCL-2 memory CD4+ T cells. Shown is the frequency of TCM(CCR7+), TTM (CCR7), TEM (CD28−), Tregs (CD127-CD25+), and Tfh (CXCR5+PD-1+) within BCL-2+ and BCL-2 populations in blood (f) and LNs(h). g, i, Frequency of cytokine/chemokine receptor (IL-7R, CCR5, CXCR3, CCR4, CCR6, CXCR5) and activation markers (HLA-DR, PD-1, CD69) expression within BCL-2+ and BCL-2 memory CD4+ T cells in blood (g) and LNs (i). RMs are color-coded by treatment arm: vehicle (n = 8), blue; venetoclax (n = 8), orange; venetoclax + anti-CD8 (n = 8), black. Data represent median ± 25th and 75th percentiles.
Fig. 5.
Fig. 5.. Survival mechanisms of CD4+ T cells are triggered in response to BCL-2 inhibition via venetoclax.
a, Heatmap showing log2 fold difference from mean expression in CD4+ T cells isolated from venetoclax-treated as compared to vehicle-treated RMs at day 25 p.i. Top panel, downregulated pro-cell death genes, bottom panel, upregulated genes associated with venetoclax resistance. b, GSEA results for apoptosis-related gene sets; color indicates normalized enrichment score (NES), circle size indicates p value. c, d, Heatmaps showing genes from the "negative regulation of extrinsic apoptotic signaling" (c) and "negative regulation of intrinsic apoptotic signaling" (d) gene sets; color indicates log2 fold difference from mean expression. Analyses were performed on samples from vehicle (n = 4), venetoclax (n = 4), and venetoclax + anti-CD8 (n = 3) treated RMs. Genes with adjusted P <0.05 were included for heatmaps and GSEA results.
Fig. 6.
Fig. 6.. CD4+ T cells from venetoclax-treated RMs retain sensitivity to ex vivo BCL-2 inhibition.
a, Experimental workflow. Briefly, after thawing, PBMCs from vehicle- and venetoclax-treated RMs were seeded in culture at 200,000 PBMCs per well and treated for 4 hours with DMSO or venetoclax at 10, 1, and 0.1 μM. Samples were then stained and immunophenotyped via flow cytometry. b, Representative gating strategy for CD4+ T cells positive for cleaved caspase-3 and Live/Dead from one venetoclax-treated RM, showing DMSO and venetoclax at the 10 μM condition. c, Frequencies of cleaved caspase-3+ and Live/Dead+ (death+) CD4+ T cells, normalized to DMSO, following ex vivo treatment with venetoclax at 10, 1, and 0.1 μM. d, Gating strategy for cleaved caspase-3+ CD4+ T cells from the same RM and conditions shown in (b). e, Frequency of cleaved caspase-3+ CD4+ T cells, normalized to DMSO, after ex vivo venetoclax treatment at 10, 1, and 0.1 μM. Analyses were performed on samples from vehicle (n = 4) and venetoclax (n = 4) treated RMs at day 49 p.i. Data are presented as median ± 25th and 75th percentiles. Statistical comparisons were performed using a two-sided Mann–Whitney U test. *P ≤ 0.05, **P < 0.01, ***P < 0.001, ****P < 0.0001.

Similar articles

References

    1. Wojciechowski S. et al. Bim/Bcl-2 balance is critical for maintaining naive and memory T cell homeostasis. J Exp Med 204, 1665–1675 (2007). 10.1084/jem.20070618 - DOI - PMC - PubMed
    1. Kuo H. H. et al. Anti-apoptotic Protein BIRC5 Maintains Survival of HIV-1-Infected CD4(+) T Cells. Immunity 48, 1183–1194 e1185 (2018). 10.1016/j.immuni.2018.04.004 - DOI - PMC - PubMed
    1. Sun W. et al. Phenotypic signatures of immune selection in HIV-1 reservoir cells. Nature 614, 309–317 (2023). 10.1038/s41586-022-05538-8 - DOI - PMC - PubMed
    1. Ren Y. et al. BCL-2 antagonism sensitizes cytotoxic T cell-resistant HIV reservoirs to elimination ex vivo. J Clin Invest 130, 2542–2559 (2020). 10.1172/JCI132374 - DOI - PMC - PubMed
    1. Clark I. C. et al. HIV silencing and cell survival signatures in infected T cell reservoirs. Nature 614, 318–325 (2023). 10.1038/s41586-022-05556-6 - DOI - PMC - PubMed

Publication types

LinkOut - more resources