[Preprint]. 2025 Jul 15:rs.3.rs-7087230.
doi: 10.21203/rs.3.rs-7087230/v1.

Associations of proteomic age with mortality and incident chronic diseases in the European Prospective Investigation into Cancer and Nutrition (EPIC)

Affiliations

Associations of proteomic age with mortality and incident chronic diseases in the European Prospective Investigation into Cancer and Nutrition (EPIC)

Oliver Robinson et al. Res Sq. .

Abstract

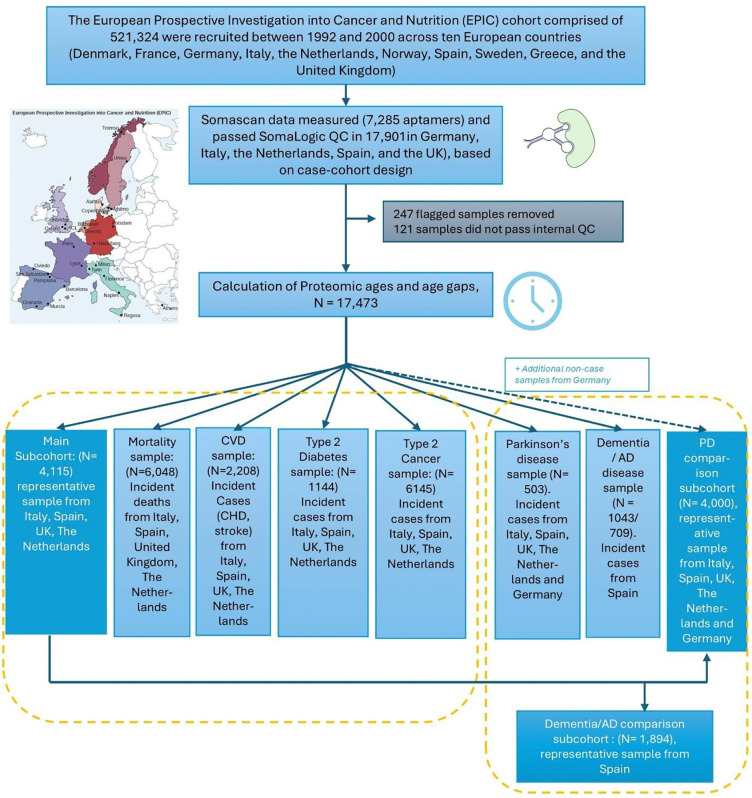
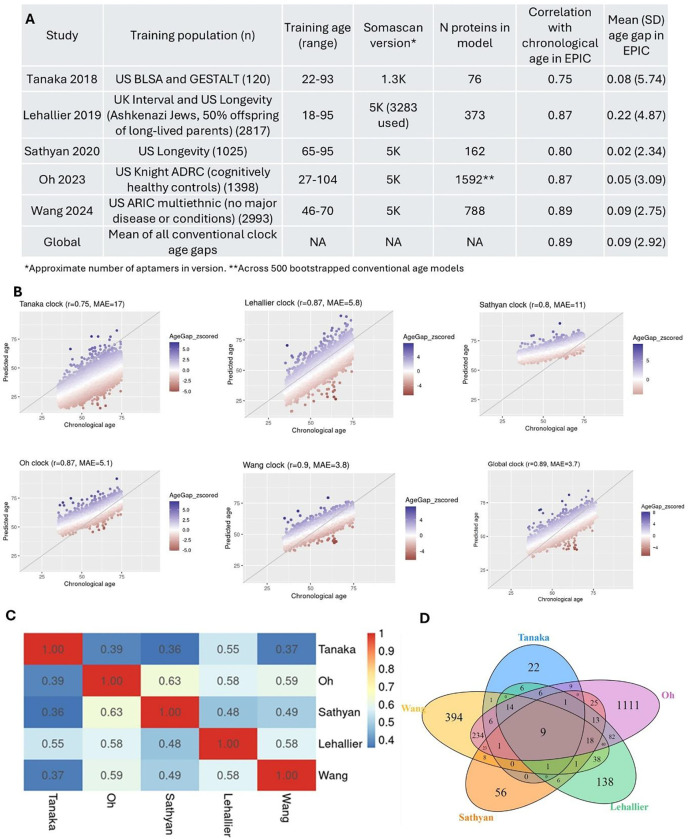
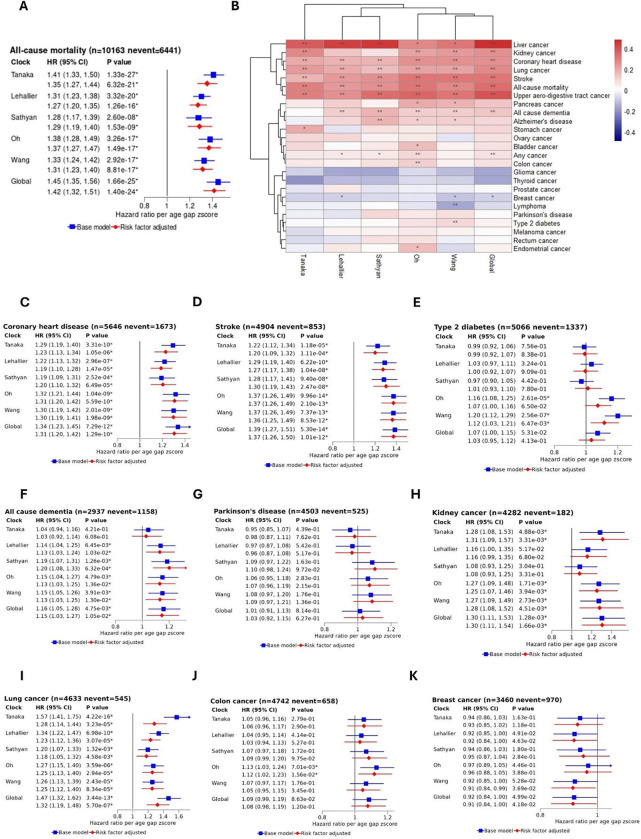
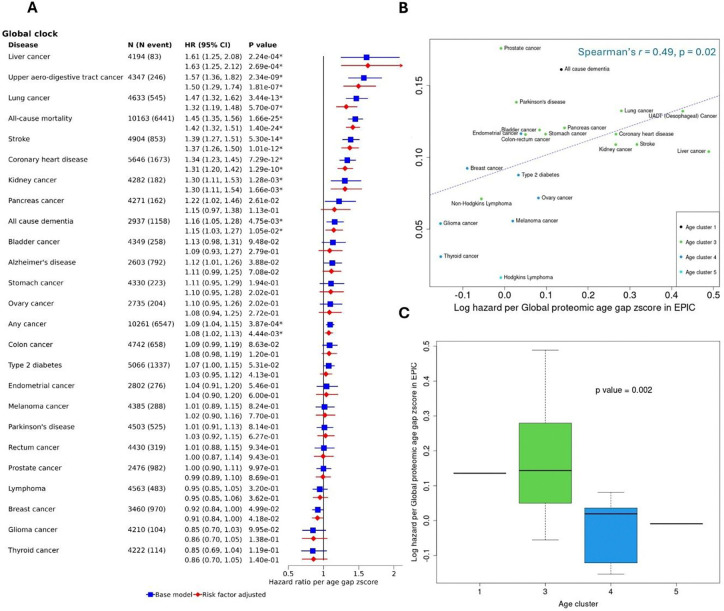
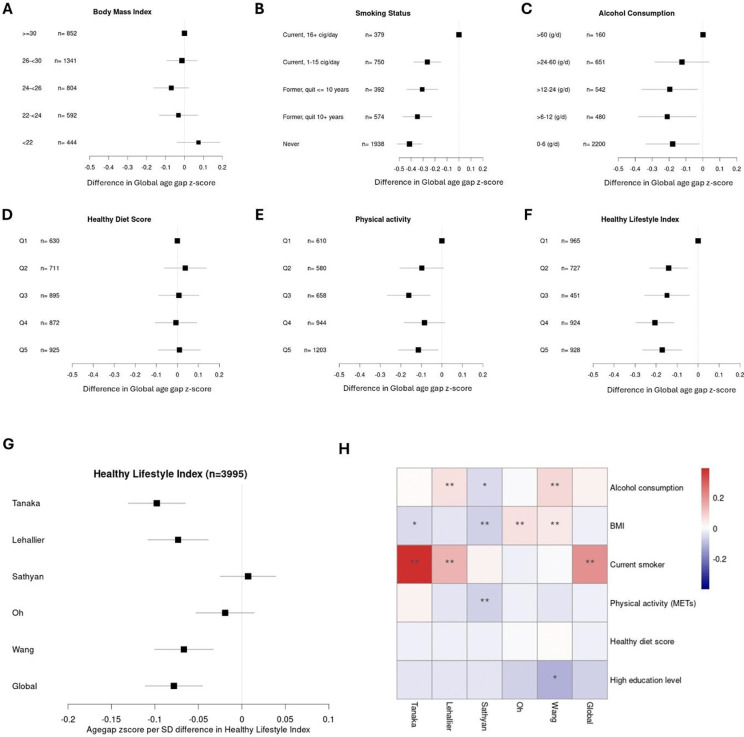
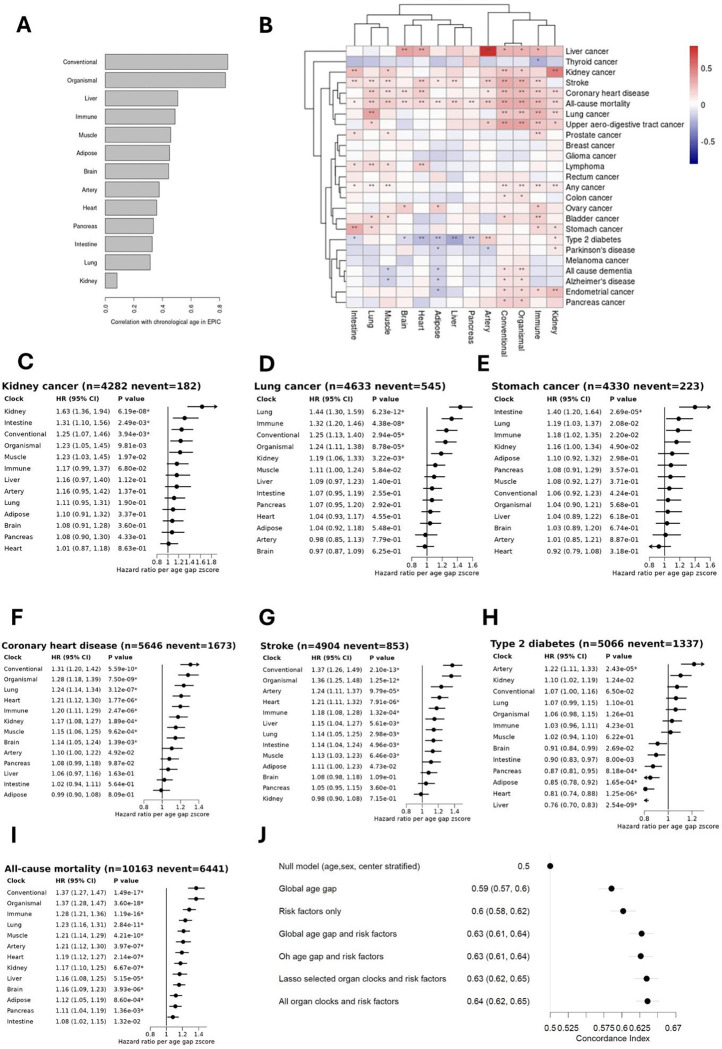
Assessment of biological ageing using proteomic clocks may enhance risk prediction and elucidate the molecular links between ageing and chronic diseases. Within a pre-diagnostic cohort of 17,473 Europeans with up to 28 years of follow-up, we examined associations of plasma SomaScan-based proteomic clocks, including organ-specific clocks, with 24 incident chronic diseases, all-cause mortality, and lifestyle risk factors. Global proteomic age gap (a composite biological age acceleration score combining previously published clocks) showed the strongest positive association of all tested clocks with all-cause mortality. Accelerated proteomic ageing was significantly associated with smoking, alcohol consumption, physical inactivity, and higher risk of cardiovascular diseases, dementia, and liver, upper aero-digestive tract, lung, and kidney cancers. Some organ-specific cancers were more strongly associated with their respective organ-specific age gaps. Mortality prediction by proteomic clocks was comparable in performance to classical lifestyle risk factors. In summary, proteomic clocks appear promising biomarkers of generalized age-related disease risk.

Keywords: Aging; SomaLogic; aptamers; biological age; biological clocks; cancer; cardiovascular disease; diabetes; neurodegeneration; proteomics; risk factors; risk prediction.


Conflict of interest statement

Additional Declarations: There is NO Competing Interest.

Figures

Figure 1:
Figure 1:. Study design and sampling flow chart.
AD: Alzheimer’s Disease, PD: Parkinson’s Disease, CVD: Cardiovascular disease, CHD Coronary Heart Disease
Figure 2:
Figure 2:. Overview of proteomic clocks.
A: Table of clock characteristics. B: Scatterplots of predicted versus chronological age for all clocks used, showing Pearson’s correlations and mean absolute error (MAE). C: Correlation heatmap of proteomic age gaps. D: Venn diagram showing overlap of proteins included in each clock
Figure 3:
Figure 3:. Associations of conventional proteomic age gaps with mortality and incident diseases.
A: Hazard ratios per conventional proteomic age gap z-score with all -cause mortality. B: Clustered heatmap showing risk factor-adjusted associations (log hazards per age gap z-score) for all -cause mortality and 25 incident diseases. * p<0.05; ** FDR-adjusted p <0.05. C-E: Hazard ratios per conventional proteomic age gap z-score with cardiometabolic diseases. F-G: Hazard ratios per conventional proteomic age gap z-score with neurodegenerative diseases. H-K: Hazard ratios per conventional proteomic age gap z-score with common cancers, including kidney, lung, colon and breast. All models stratified by study centre, sex, and five-year age group. Risk factor adjusted model additionally adjusted for education level, smoking status, alcohol consumption, BMI, healthy diet score and physical activity. All error bars show 95% confidence intervals.
Figure 4:
Figure 4:. Comparison of strengths of associations with Global proteomic age across disease endpoints.
A: Hazard ratios per Global proteomic age gap z-score with all -cause mortality and 25 incident diseases. All models stratified by study centre, sex, and five-year age group. Risk factor adjusted model additionally adjusted for education level, smoking status, alcohol consumption, BMI, healthy diet score and physical activity. All error bars show 95% confidence intervals. B: Scatterplot of log hazards per Consensus proteomic age gap z-score (risk factor adjusted model) against rate of disease incidence increase with age from UK National health records for 22 diseases. Extracted from Kuan et al. Sci Rep. 2021 Feb 3;11(1):2938 X. Correlation shows Spearman’s correlation. Disease points are labelled and colored by age cluster as reported by Kuan et al. C: Boxplots showing log hazards per Consensus proteomic age gap z-score (risk factor adjusted model) within each age cluster. P value calculated from t-test comparing log hazards for cluster 3 diseases versus cluster 4 diseases.
Fig 5:
Fig 5:. Associations of risk factors with conventional proteomic age gaps in the main subcohort.
A-F: Risk factor and Healthy lifestyle index associations with the consensus age gap z scores. Adjusted for age, sex and study centre. Reference category is always the least healthy category. Q= quartiles. G: Associations between continuous healthy lifestyle index z-score and conventional age gap z scores. Adjusted for age, sex, and study centre, H: Heatmap showing associations of risk and protective factors with conventional age gap z-scores. Estimates from mutually adjusted model including all factors shown plus for age, sex and study centre. Continuous factors (alcohol intake, BMI and healthy diet score) are scaled to facilitate comparison. Reference groups for current smoker are non/former smoker. High education level refers to equivalent or university degree or higher and the reference category is education up to technical or secondary school. All error bars show 95% confidence intervals. N=3995
Figure 6:
Figure 6:. Associations of organ specific proteomic age gaps with mortality and incident diseases.
All models generated using weights from study of Oh et al. Here were refer to the Oh clock, as previously presented, as “conventional”. A) Pearson’s correlations with chronological age in all EPIC samples B) Clustered heatmap showing risk factor-adjusted associations (log hazards per age gap z-score) for all -cause mortality and 25 incident diseases. * p<0.05; ** FDR-adjusted p <0.05. C-I): Hazard ratios from risk factor adjusted models per organ specific proteomic age gap z-score with C) kidney cancer, D) lung cancer, E) Stomach cancer, F) CHD, G) Stoke, H) type 3 Diabetes and I) All-cause mortality. Models stratified by study centre, sex, and five-year age group and adjusted for education level, smoking status, alcohol consumption, BMI, healthy diet score and physical activity. J) Comparison of discriminatory power showing concordance index for various models for prediction of mortality. All error bars show 95% confidence intervals.

Similar articles

References

    1. López-Otín C., Blasco M. A., Partridge L., Serrano M. & Kroemer G. Hallmarks of aging: An expanding universe. Cell 186, 243–278 (2023). 10.1016/j.cell.2022.11.001 - DOI - PubMed
    1. Sierra F. et al. Moving geroscience from the bench to clinical care and health policy. J Am Geriatr Soc 69, 2455–2463 (2021). 10.1111/jgs.17301 - DOI - PMC - PubMed
    1. Garmany A., Yamada S. & Terzic A. Longevity leap: mind the healthspan gap. NPJ Regen Med 6, 57 (2021). 10.1038/s41536-021-00169-5 - DOI - PMC - PubMed
    1. Horvath S. DNA methylation age of human tissues and cell types. Genome Biol 14, R115 (2013). 10.1186/gb-2013-14-10-r115 - DOI - PMC - PubMed
    1. Rutledge J., Oh H. & Wyss-Coray T. Measuring biological age using omics data. Nature Reviews Genetics 23, 715–727 (2022). 10.1038/s41576-022-00511-7 - DOI - PMC - PubMed

Publication types

LinkOut - more resources