. 2025 Jul 10:12:1598191.
doi: 10.3389/fnut.2025.1598191. eCollection 2025.

Phenylalanine modulates casein synthesis in bovine mammary epithelial cells by influencing amino acid transport and protein synthesis pathways

Affiliations

Phenylalanine modulates casein synthesis in bovine mammary epithelial cells by influencing amino acid transport and protein synthesis pathways

Yuanyuan Xing et al. Front Nutr. .

Abstract

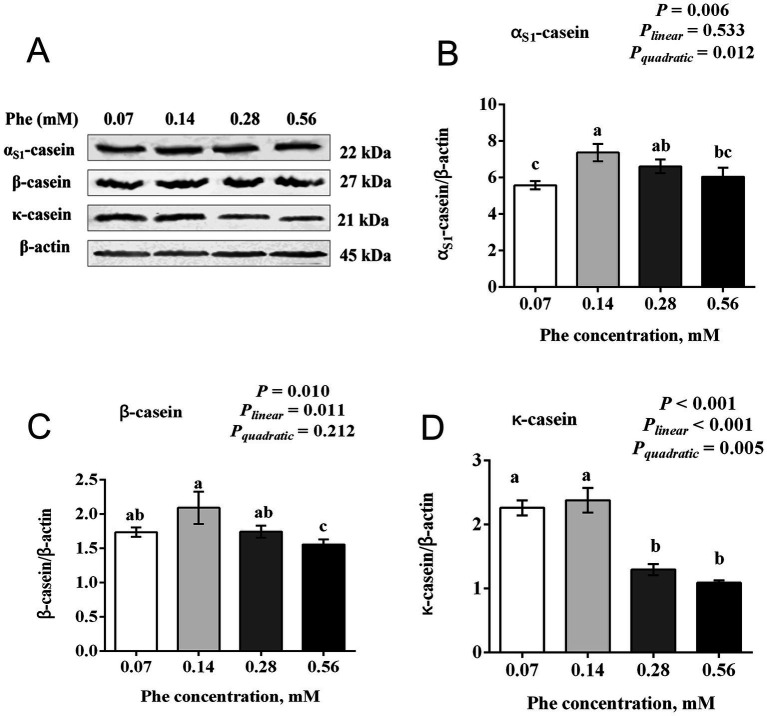
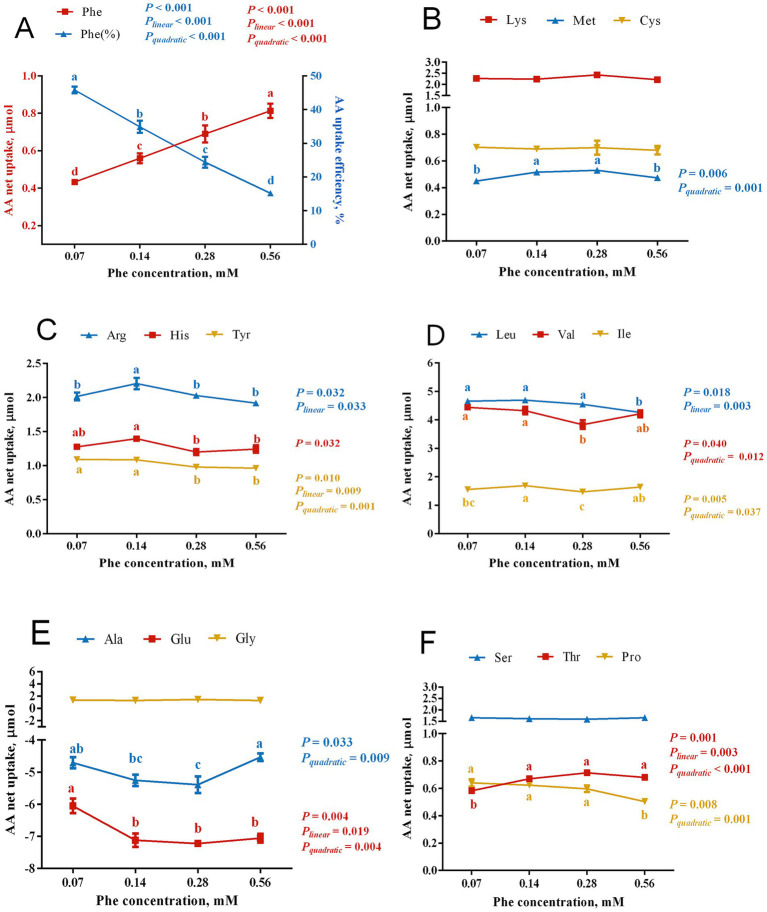
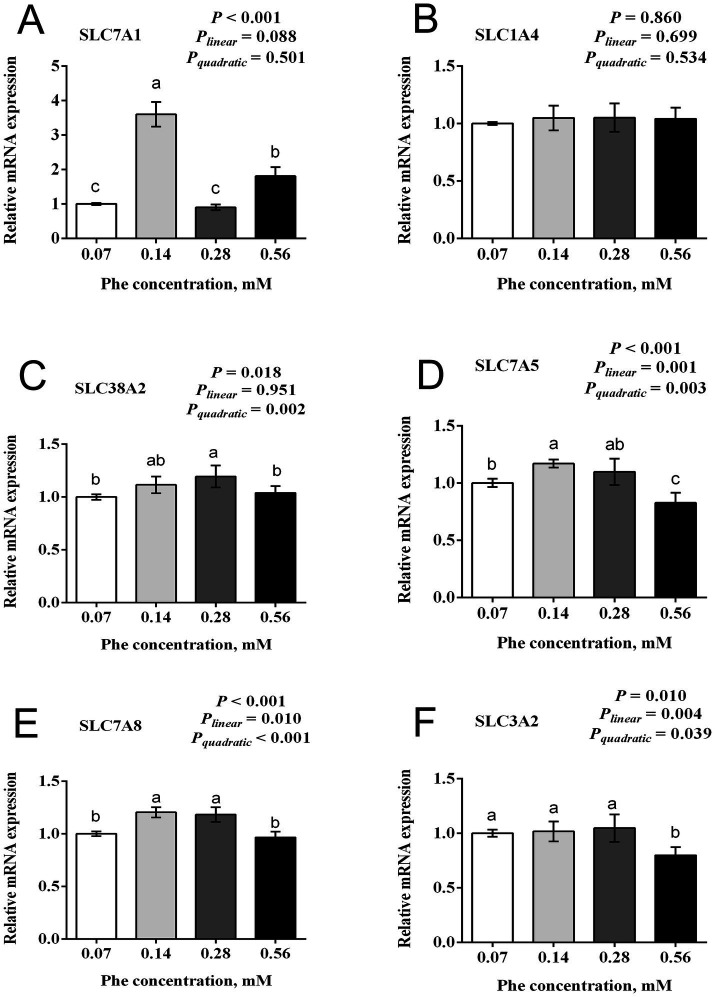
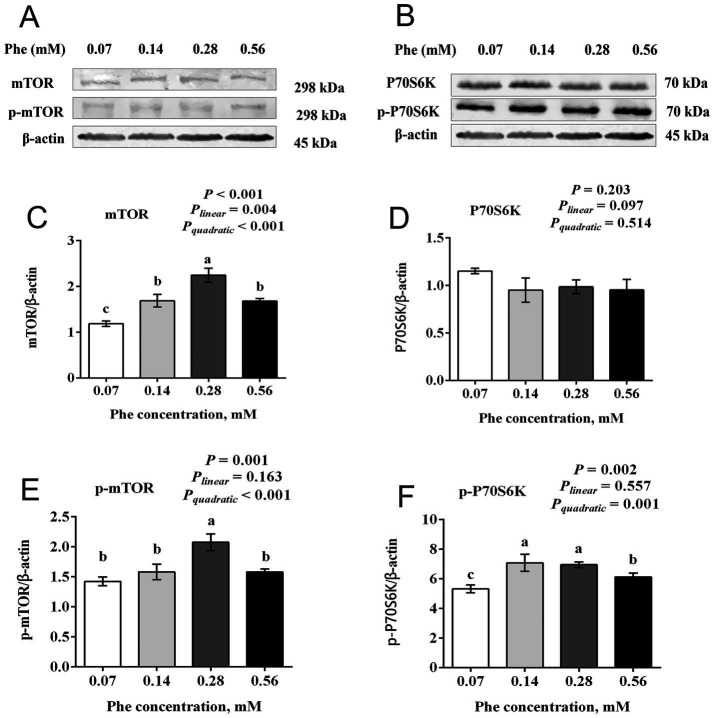
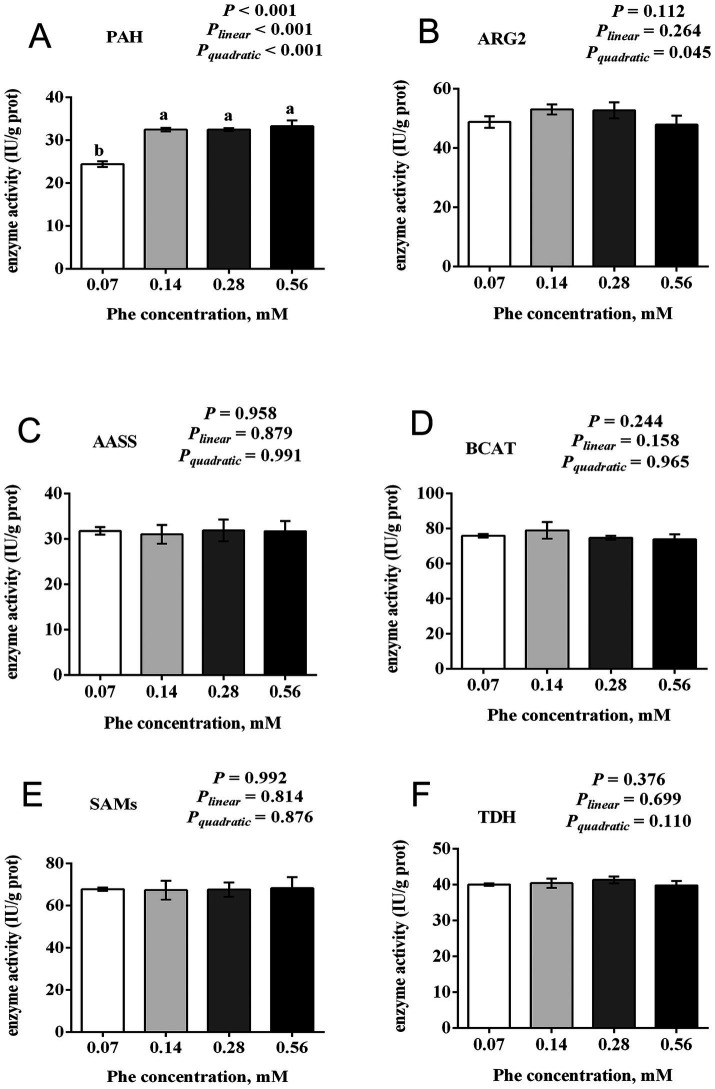
The efficiency of phenylalanine (Phe) utilization for milk protein synthesis in dairy cows is limited, and its uptake and metabolic mechanisms in the mammary tissue remaining unclear. This study investigated the effects of Phe availability (0.07, 0.14, 0.28, and 0.56 mM) on amino acid metabolism and casein synthesis in bovine mammary epithelial cells (BMECs) cultured for 24 h. Results showed that αS1-casein, β-casein, and κ-casein expression peaked at 0.14 mM Phe (p < 0.05). At this optimal concentration, amino acid transporters (SLC7A5, SLC7A8, and SLC38A2) were upregulated, corresponding with enhanced uptake of Met, Ile, His, and Arg (p < 0.05). The mammalian target of rapamycin (mTOR) signaling pathway was activated as evidenced by increased phosphorylation of P70 S6 kinase (P70S6K) and mTOR (p < 0.05), while the general control nonderepressible 2 (GCN2) pathway was suppressed through reduced eukaryotic initiation factor 2α (eIF2α) phosphorylation (p < 0.05). As Phe concentration increased, its net uptake increased linearly (Plinear < 0.05) while uptake efficiency decreased linearly (Plinear < 0.05). High Phe concentration (0.56 mM) inhibited amino acid transporter expression and reduced uptake of Leu, Pro, and Tyr (p < 0.05). Additionally, Phe-to-Tyr conversion was dynamically regulated, with phenylalanine hydroxylase (PAH) activity inhibited at 0.07 mM Phe (p < 0.05) but enhanced at higher concentrations, concurrent with reduced exogenous Tyr uptake (p < 0.05). These findings show that casein synthesis in BMECs is optimal at 0.14 mM Phe, coinciding with enhanced expression of amino acid transporters and activation of protein synthesis pathways. In contrast, higher Phe concentrations (0.56 mM) are associated with reduced amino acid utilization efficiency. These observations suggest potential mechanisms by which Phe concentration may regulate milk protein synthesis in dairy cows.

Keywords: amino acid metabolism; amino acid transport; bovine mammary epithelial cells; casein synthesis; mTOR signaling pathway; phenylalanine.


Conflict of interest statement

The authors declare that the research was conducted in the absence of any commercial or financial relationships that could be construed as a potential conflict of interest.

Figures

Figure 1
Figure 1
Effects of Phe availability on the proliferation of bovine mammary epithelial cells (BMECs). Purified BMECs were treated with varied concentration of Phe (0.07, 0.14, 0.28, and 0.56 mM) for 24 h. BMEC viability was assessed using the CCK-8 assay. Results are presented as means ± SEM (n = 6 replicates/treatment). Data were analyzed by one-way ANOVA followed by Tukey’s test for multiple comparisons. Values without a common letter differ (p < 0.05). Orthogonal polynomial contrasts were employed to assess linear and quadratic responses to increasing Phe levels.
Figure 2
Figure 2
Effects of Phe availability on casein expression in bovine mammary epithelial cells (BMECs). Purified BMECs were treated with varied concentration of Phe (0.07, 0.14, 0.28, and 0.56 mM) for 24 h. (A) Western blotting analysis of αS1-casein, β-casein and κ-casein. Quantification of (B) αS1-casein, (C) β-casein and (D) κ-casein relative to β-actin. Results are presented as means ± SEM (n = 6 replicates/treatment). Data were analyzed by one-way ANOVA followed by Tukey’s test for multiple comparisons. Values without a common letter differ (p < 0.05). Orthogonal polynomial contrasts were employed to assess linear and quadratic responses to increasing Phe levels.
Figure 3
Figure 3
Effects of Phe availability on the net uptake of amino acids in bovine mammary epithelial cells (BMECs). Purified BMECs were treated with varied Phe concentrations (0.07, 0.14, 0.28, and 0.56 mM) for 24 h. Net AA uptake was calculated as AA content in medium before incubation minus after incubation. Phe uptake efficiency was calculated as Phe net uptake divided by Phe concentration. (A) Phe net uptake and uptake efficiency. (B–F) Net uptake of various amino acids: (B) Lys, Met, Cys; (C) Arg, His, Tyr; (D) Leu, Val, Ile; (E) Ala, Glu, Gly; (F) Ser, Thr, Pro. Results are presented as means ± SEM (n = 6 replicates/treatment). Data were analyzed by one-way ANOVA with Tukey’s test. Values without a common letter differ (p < 0.05). Orthogonal polynomial contrasts assessed linear and quadratic responses to increasing Phe levels.
Figure 4
Figure 4
Effects of Phe availability on the mRNA expression of amino acid transporters in bovine mammary epithelial cells (BMECs). Purified BMECs were treated with varied Phe concentrations (0.07, 0.14, 0.28, and 0.56 mM) for 24 h. Relative mRNA expression of amino acid transporters: (A) SLC7A1 (Solute Carrier Family 7 Member 1, cationic amino acid transporter-1), (B) SLC1A4 (Solute Carrier Family 1 Member 4, neutral amino acid transporter), (C) SLC38A2 (Solute Carrier Family 38 Member 2, sodium-coupled neutral amino acid transporter 2), (D) SLC7A5 (Solute Carrier Family 7 Member 5, large neutral amino acid transporter small subunit 1), (E) SLC7A8 (Solute Carrier Family 7 Member 8, large neutral amino acid transporter small subunit 2), and (F) SLC3A2 (Solute Carrier Family 3 Member 2, 4F2 cell-surface antigen heavy chain). Results are presented as means ± SEM (n = 6 replicates/treatment). Data were analyzed by one-way ANOVA with Tukey’s test. Values without a common letter differ (p < 0.05). Orthogonal polynomial contrasts assessed linear and quadratic responses to increasing Phe levels.
Figure 5
Figure 5
Effects of Phe availability on the expression of key proteins in the mTOR signaling pathway in bovine mammary epithelial cells (BMECs). Purified BMECs were treated with varied Phe concentrations (0.07, 0.14, 0.28, and 0.56 mM) for 24 h. (A,B) Western blotting analysis of mTOR, phosphorylated mTOR (p-mTOR), P70S6K, and phosphorylated P70S6K (p-P70S6K). Quantification of (C) mTOR, (D) P70S6K, (E) p-mTOR, and (F) p-P70S6K relative to β-actin. Results are presented as means ± SEM (n = 6 replicates/treatment). Data were analyzed by one-way ANOVA with Tukey’s test. Values without a common letter differ (p < 0.05). Orthogonal polynomial contrasts assessed linear and quadratic responses to increasing Phe levels.
Figure 6
Figure 6
Effects of Phe availability on the expression of key proteins and genes in the GCN2 signaling pathway in bovine mammary epithelial cells (BMECs). Purified BMECs were treated with varied Phe concentrations (0.07, 0.14, 0.28, and 0.56 mM) for 24 h. (A) Western blotting analysis of eIF2α and phosphorylated eIF2α (p-eIF2α). Quantification of (B) eIF2α and (C) p-eIF2α relative to β-actin. (D) Relative mRNA expression of ATF4. Results are presented as means ± SEM (n = 6 replicates/treatment). Data were analyzed by one-way ANOVA with Tukey’s test. Values without a common letter differ (p < 0.05). Orthogonal polynomial contrasts assessed linear and quadratic responses to increasing Phe levels.
Figure 7
Figure 7
Effects of Phe availability on the activity of key enzymes in EAA catabolism in bovine mammary epithelial cells (BMECs). Purified BMECs were treated with varied Phe concentrations (0.07, 0.14, 0.28, and 0.56 mM) for 24 h. The enzymatic activities of (A) phenylalanine hydroxylase (PAH), (B) arginase 2 (ARG2), (C) argininosuccinate synthase (AASS), (D) branched-chain amino acid transaminase (BCAT), (E) S-adenosylmethionine synthetase (SAMs), and (F) threonine dehydrogenase (TDH) were measured. Results are presented as means ± SEM (n = 6 replicates/treatment). Data were analyzed by one-way ANOVA with Tukey’s test. Values without a common letter differ (p < 0.05). Orthogonal polynomial contrasts assessed linear and quadratic responses to increasing Phe levels.

Similar articles

References

    1. Pszczolkowski VL, Arriola Apelo SI. The market for amino acids: understanding supply and demand of substrate for more efficient milk protein synthesis. J Anim Sci Biotechnol. (2020) 11:108. doi: 10.1186/s40104-020-00514-6, PMID: - DOI - PMC - PubMed
    1. Arriola Apelo SI, Knapp JR, Hanigan MD. Invited review: current representation and future trends of predicting amino acid utilization in the lactating dairy cow. J Dairy Sci. (2014) 97:4000–17. doi: 10.3168/jds.2013-7392, PMID: - DOI - PubMed
    1. Manjarin R, Bequette BJ, Wu G, Trottier NL. Linking our understanding of mammary gland metabolism to amino acid nutrition. Amino Acids. (2014) 46:2447–62. doi: 10.1007/s00726-014-1818-8, PMID: - DOI - PubMed
    1. Fehlberg LK, Guadagnin AR, Thomas BL, Sugimoto Y, Shinzato I, Cardoso FC. Feeding rumen-protected lysine prepartum increases energy-corrected milk and milk component yields in Holstein cows during early lactation. J Dairy Sci. (2020) 103:11386–400. doi: 10.3168/jds.2020-18542, PMID: - DOI - PubMed
    1. Lee C, Lobos NE, Weiss WP. Effects of supplementing rumen-protected lysine and methionine during prepartum and postpartum periods on performance of dairy cows. J Dairy Sci. (2019) 102:11026–39. doi: 10.3168/jds.2019-17125, PMID: - DOI - PubMed

LinkOut - more resources