. 2025 Jul 10:12:1589854.
doi: 10.3389/fnut.2025.1589854. eCollection 2025.

The association between neutrophil percentage to albumin ratio and progression-free survival and overall survival in colorectal cancer patients: a retrospective cohort study

Affiliations

The association between neutrophil percentage to albumin ratio and progression-free survival and overall survival in colorectal cancer patients: a retrospective cohort study

Hailun Xie et al. Front Nutr. .

Abstract

Background: The neutrophil percentage-to-albumin ratio (NPAR) is a promising indicator for predicting outcomes in various cancers. However, its prognostic value in colorectal cancer (CRC) is still underexplored. This study aimed to investigate the relationship between NPAR and progression-free survival (PFS) as well as overall survival (OS) in CRC patients.

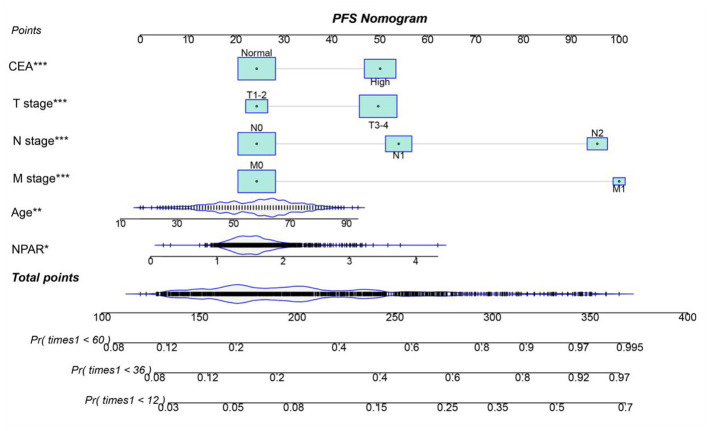
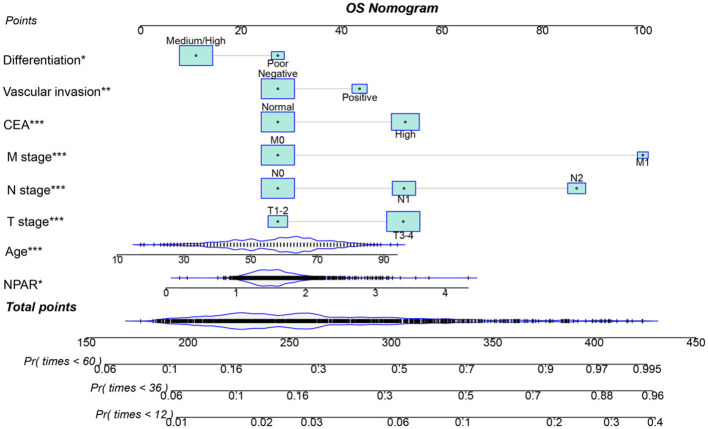
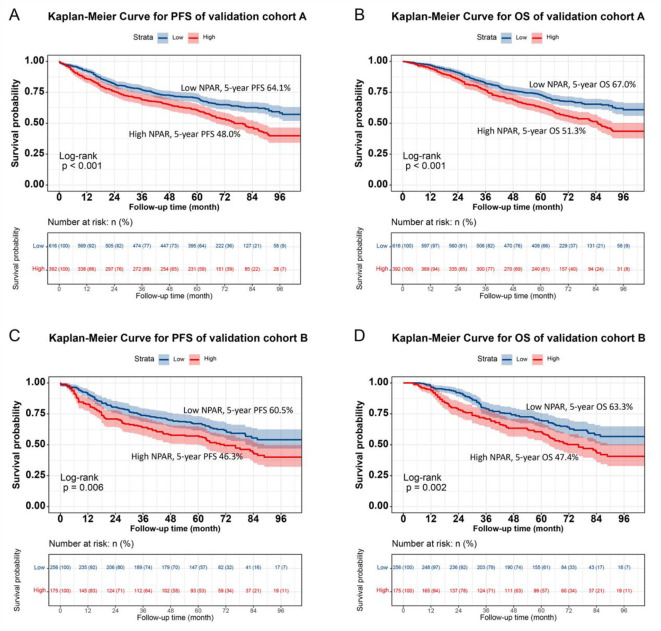
Methods: We conducted a retrospective cohort study involving 1,339 CRC patients who underwent surgical resection. The Kaplan-Meier method was utilized to plot survival curves for PFS and OS. Cox proportional hazards regression analysis assessed the relationship between NPAR and survival outcomes. The nomograms that included NPAR and other significant prognostic factors were developed to predict 1-, 3-, and 5-year survival rates.

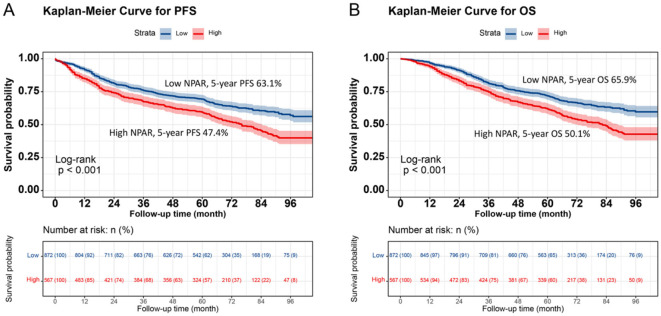
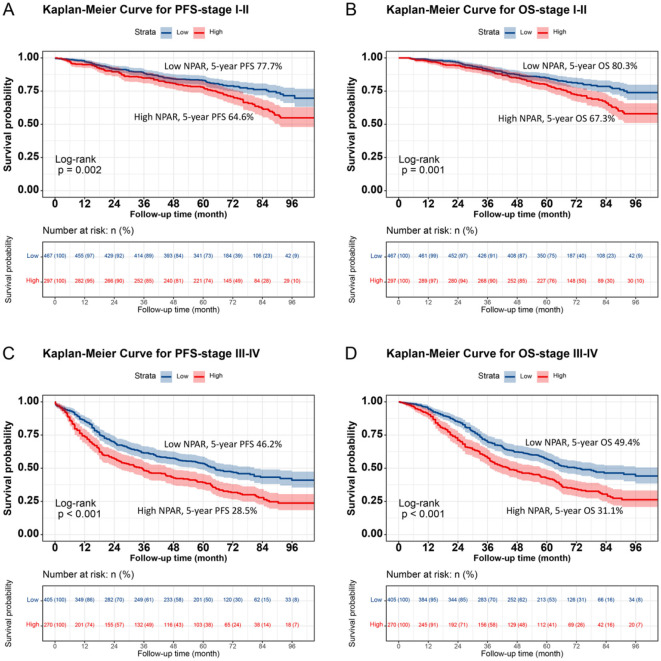
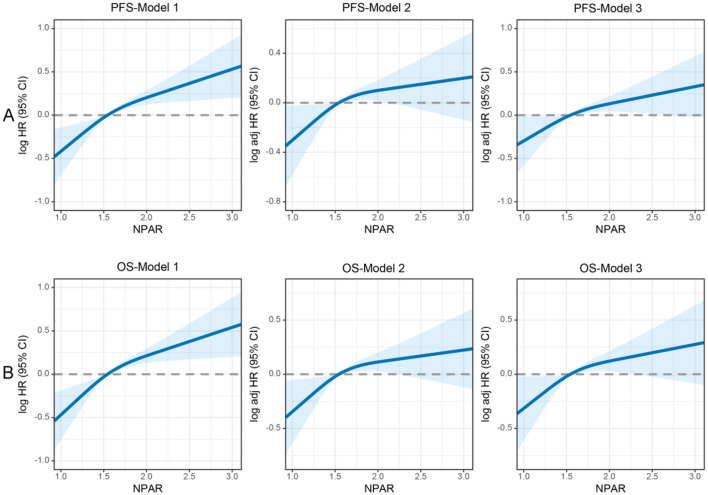
Results: Patients with high NPAR (≥1.62) experienced significantly worse PFS and OS compared to those with low NPAR (<1.62) (PFS: 47.4% vs. 63.1%, p < 0.001; OS: 50.1% vs. 65.9%, p < 0.001). Compared to other relevant markers, NPAR exhibited strong prognostic predictive efficacy. Multivariate Cox regression analysis identified high NPAR as an independent predictor of poor PFS (hazard ratio [HR] = 1.671, 95% Confidence Interval [CI]: 1.142-2.444, p = 0.008) and OS (HR = 2.697, 95% CI: 1.761-4.130, p < 0.001). The NPAR-based nomograms demonstrated high predictive accuracy and received favorable evaluations in the internal validation cohort.

Conclusion: Preoperative NPAR is a promising indicator for predicting PFS and OS in CRC patients. The NPAR-based nomogram offers a practical tool for personalized survival prediction and may assist in clinical decision-making.

Keywords: albumin; colorectal cancer; neutrophil percentage; overall survival; progression-free survival.


Conflict of interest statement

The authors declare that the research was conducted in the absence of any commercial or financial relationships that could be construed as a potential conflict of interest.

Figures

Kaplan-Meier curves comparing survival probabilities for different NPAR levels. Panel A shows progression-free survival (PFS) with a 5-year PFS of 63.1% for low NPAR and 47.4% for high NPAR. Panel B shows overall survival (OS) with a 5-year OS of 65.9% for low NPAR and 50.1% for high NPAR. Both panels include log-rank p-values below 0.001 and number-at-risk tables.
Figure 1
Kaplan-Meier survival analysis of PFS and OS stratified by preoperative NPAR in CRC patients. (A) PFS curves: high NPAR group (red, lower curve) vs. Low NPAR group (blue, upper curve). 5-year PFS rates: 47.4% (red, lower curve) vs. 63.1% (blue, upper curve) (p < 0.001). (B) OS curves: high NPAR (red, lower curve) vs. Low NPAR (blue, upper curve). 5-year OS rates: 50.1% (red, lower curve) vs. 65.9% (blue, upper curve) (p < 0.001). Survival probabilities were estimated using the Kaplan-Meier method, and differences were assessed by log-rank test. This figure demonstrates the prognostic value of NPAR in distinguishing survival outcomes among CRC patients.
Four Kaplan-Meier survival curves depict survival probabilities over time for different stages and risk levels. Chart A shows stage I-II progression-free survival (PFS) with higher outcomes for low NPAR (77.7%) versus high NPAR (64.6%). Chart B shows overall survival (OS) for stage I-II, with low NPAR at 80.3% and high NPAR at 67.3%. Chart C presents stage III-IV PFS with 46.2% for low NPAR and 28.5% for high NPAR. Chart D shows stage III-IV OS with low NPAR at 49.4% compared to high NPAR at 31.1%. Each chart includes log-rank p-values and risk tables below.
Figure 2
Stratified Kaplan-Meier survival curves of NPAR by TNM stage subgroups in CRC patients. (A) PFS for Stage I-II patients: High NPAR (red, lower curve) vs. Low NPAR (blue, upper curve). 5-year PFS rates: 64.6% (red, lower curve) vs. 77.7% (blue, upper curve) (p = 0.002). (B) OS for Stage I-II patients: High NPAR (red, lower curve) vs. Low NPAR (blue, upper curve). 5-year OS rates: 67.3% (red, lower curve) vs. 80.3% (blue, upper curve) (p = 0.001). (C) PFS for Stage III-IV patients: high NPAR (red, lower curve) vs. low NPAR (blue, upper curve). 5-year PFS rates: 28.5% (red, lower curve) vs. 46.2% (blue, upper curve) (p < 0.001). (D) OS for Stage III-IV patients: High NPAR (red, lower curve) vs. Low NPAR (blue, upper curve). 5-year OS rates: 31.1% (red, lower curve) vs. 49.4% (blue, upper curve) (p < 0.001). This figure highlights NPAR's prognostic utility across different tumor stages.
Six graphs display the relationship between NPAR and log hazard ratios (HR) for PFS and OS models. Each graph shows a trend line with 95% confidence intervals shaded in blue. The x-axis represents NPAR values, while the y-axis represents log HR and adjusted HR. The dashed horizontal line indicates a neutral HR of zero.
Figure 3
Restricted cubic spline analysis of the nonlinear association between preoperative NPAR and survival outcomes in CRC patients. (A) PFS and (B) OS. Model 1: Unadjusted. Model 2: Adjusted for gender, age, BMI, T stage, N stage, and M stage. Model 3: Fully adjusted for gender, age, BMI, hypertension, diabetes, T/N/M stage, tumor size, 0perineural/vascular invasion, differentiation, CEA, radiotherapy, and chemotherapy. RCS curves were generated using 3 knots placed at the 10th, 50th, and 90th percentiles of NPAR. Solid lines represent hazard ratios, and shaded bands indicate 95% confidence intervals. This figure highlights the nonlinear dynamics of NPAR as a continuous prognostic marker and identifies a critical threshold for clinical risk stratification in CRC patients.
PFS nomogram illustrating predictors for progression-free survival, including CEA, T stage, N stage, M stage, age, and NPAR. Each predictor contributes to a total point score, which correlates with survival probabilities at 12, 36, and 60 months. Blue boxes and points represent values for each predictor.
Figure 4
Nomogram for predicting 1-, 3-, and 5-year PFS in CRC patients. The nomogram incorporates NPAR and other independent predictors (age, T stage, N stage, M stage, CEA). Points are assigned to each variable, and total points correspond to predicted survival probabilities. The nomogram achieved a C-index of 0.721. This tool provides a visual method to estimate individualized PFS probabilities based on preoperative parameters.
Nomogram illustrating overall survival (OS) with variables like differentiation, vascular invasion, CEA level, M, N, T stages, age, and NPAR. Each factor is scored, contributing to total points influencing survival probabilities at different times.
Figure 5
Nomogram for predicting 1-, 3-, and 5-year OS in CRC patients. The nomogram incorporates NPAR and other independent predictors (T stage, N stage, M stage, vascular invasion, differentiation, and CEA). Points are assigned to each variable, and total points correspond to predicted survival probabilities. The nomogram showed a C-index of 0.729. This figure facilitates personalized OS prediction by integrating inflammatory, nutritional, and clinicopathological factors.
Kaplan-Meier curves for validation cohorts A and B comparing survival probabilities. Charts A and C display progression-free survival (PFS), while charts B and D show overall survival (OS). In each chart, low NPAR (in blue) is associated with higher survival rates compared to high NPAR (in red). Chart A: low NPAR 64.1% 5-year PFS, high NPAR 48.0%. Chart B: low NPAR 67.0% 5-year OS, high NPAR 51.3%. Chart C: low NPAR 60.5% 5-year PFS, high NPAR 46.3%. Chart D: low NPAR 63.3% 5-year OS, high NPAR 47.4%. Log-rank p-values indicate statistical significance.
Figure 6
Validation of NPAR's prognostic value in validation cohort A and B using Kaplan-Meier analysis. (A) Progression-free survival in validation cohort A: high NPAR (red, lower curve) vs. Low NPAR (blue, upper curve). 5-year PFS rates: 48.0% (red, lower curve) vs. 64.1% (blue, upper curve) (p < 0.001). (B) Overall survival in validation cohort A: high NPAR (red, lower curve) vs. Low NPAR (blue, upper curve). 5-year OS rates: 51.3% (red, lower curve) vs. 67.0% (blue, upper curve; p < 0.001). (C) Progression-free survival in validation cohort B: high NPAR (red, lower curve) vs. Low NPAR (blue, upper curve). 5-year PFS rates: 46.3% (red, lower curve) vs. 60.5% (blue, upper curve; p < 0.001). (D) Overall survival in validation cohort B: high NPAR (red, lower curve) vs. Low NPAR (blue, upper curve). 5-year OS rates: 47.4% (red, lower curve) vs. 63.3% (blue, upper curve) (p < 0.001). Survival probabilities were estimated using the Kaplan-Meier method, and differences were assessed by log-rank test. This figure confirms the reproducibility of NPAR's prognostic significance in independent validation sets.

Similar articles

References

    1. Eng C, Yoshino T, Ruíz-García E, Mostafa N, Cann CG, O'Brian B, et al. Colorectal cancer. Lancet. (2024) 404:294–310. 10.1016/S0140-6736(24)00360-X - DOI - PubMed
    1. Bray F, Laversanne M, Sung H, Ferlay J, Siegel RL, Soerjomataram I, et al. Global cancer statistics 2022: GLOBOCAN estimates of incidence and mortality worldwide for 36 cancers in 185 countries. CA Cancer J Clin. (2024) 74:229–63. 10.3322/caac.21834 - DOI - PubMed
    1. Han B, Zheng R, Zeng H, Wang S, Sun K, Chen R, et al. Cancer incidence and mortality in China, 2022. J Natl Cancer Cent. (2024) 4:47–53. 10.1016/j.jncc.2024.01.006 - DOI - PMC - PubMed
    1. Motepalli PRK, Nukala RL. Increased incidence of young age presentation of colorectal carcinoma: a tertiary cancer hospital study. J Cancer Res Ther. (2020) 16:S172–5. 10.4103/jcrt.JCRT_912_17 - DOI - PubMed
    1. Keum N, Giovannucci E. Global burden of colorectal cancer: emerging trends, risk factors and prevention strategies. Nat Rev Gastroenterol Hepatol. (2019) 16:713–32. 10.1038/s41575-019-0189-8 - DOI - PubMed

LinkOut - more resources