. 2025 Nov 3;15(11):2374-2396.
doi: 10.1158/2159-8290.CD-25-0629.

Off-pore Nucleoporin sPOM121 Transcriptionally Propels β-Catenin-driven Tumor Progression and Immune Escape in Prostate Cancer

Affiliations

Off-pore Nucleoporin sPOM121 Transcriptionally Propels β-Catenin-driven Tumor Progression and Immune Escape in Prostate Cancer

Perumalraja Kirthika et al. Cancer Discov. .

Abstract

The roles of nucleoplasm-residing nucleoporins (NUP) in solid tumors, including prostate cancer, remain unknown. In this study, we reveal the clinical significance and mechanistic role of the off-pore NUP, soluble POM121 (sPOM121), as a crucial transcriptional regulator that enhances the aggressiveness of metastatic prostate cancer. Using orthogonal methodologies in human samples, sPOM121 was identified as the predominantly expressed nucleoplasmic NUP in prostate cancer. Unbiased proteomic and epigenomic studies demonstrate that sPOM121, through its C-terminus, interacts with the chromatin remodeler SMARCA5 at gene promoter sites and localizes at nuclear condensates, reprogramming gene expression. Indeed, sPOM121 regulates a distinct oncogenic gene network, including β-catenin, leading to prostate cancer progression and immune evasion. Importantly, targeting the sPOM121/β-catenin axis in patient-derived preclinical and syngeneic mouse models halts prostate cancer aggressiveness and enhances antitumor immunity. Taken together, these findings reveal previously unknown actionable reprogramming functions of off-pore NUPs in solid tumors.

Significance: This study uncovers how oncogenic signaling programs are transcriptionally heightened by the NUP sPOM121 in metastatic prostate cancer. Localization of sPOM121 at active transcriptional nuclear condensates propels disease progression and immune evasion, offering novel anticancer therapeutic opportunities.


Conflict of interest statement

J.J. Orme reports grants from NIH and Prostate Cancer Foundation and nonfinancial support from Genentech outside the submitted work. S.M. Dehm reports personal fees from Oncternal Therapeutics, TCG Crossover, and American Association for Cancer Research and grants from NCI, US Department of Defense Prostate Cancer Research Program, and Prostate Cancer Foundation outside the submitted work. E.S. Antonarakis reports grants and personal fees from Janssen, Johnson & Johnson, Sanofi, Bayer, Bristol Myers Squibb, Convergent Therapeutics, Curium, MacroGenics, Merck, Pfizer, and AstraZeneca, personal fees from Aadi Bioscience, Abeona Therapeutics, Aikido Pharma, Astellas, Blue Earth, Boundless Bio, Corcept Therapeutics, Duality Bio, Exact Sciences, Hookipa Pharma, Invitae, Eli Lilly and Company, Foundation Medicine, Menarini-Silicon Biosystems, Tango Therapeutics, Tempus, Tolmar Scientific, VIR Biotechnology, and Z-alpha, and grants from Novartis, Celgene, and Orion outside the submitted work, as well as a patent for an AR-V7 biomarker technology that is issued and licensed to Qiagen. No disclosures were reported by the other authors.

Figures
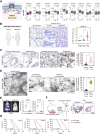
Figure 1.
Figure 1.
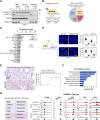
sPOM121 contributes to lethal prostate cancer aggressiveness. A, Diagram illustrates nucleoporins (NUP) reported to localize exclusively off-pore in the nucleoplasm (sPOM121) and with both nucleoplasmic and nuclear pore (NPC) localization (NUP98, NUP107, NUP133, NUP160, AHCTF1, NUP153, SEC13, and NUP50). Gene expression of indicated NUPs in normal prostate (N) and prostate tumors (T) from the publicly available TCGA transcriptomic patient dataset. sPOM121 is highlighted as the most significant off-pore NUP with increased expression in tumors. CPM, counts per million. B, Representative images and quantification of sPOM121 RNA-ISH in a cohort of normal prostate (n = 30), primary prostate cancer (n = 30), and metastatic prostate cancer (n = 24) tissue samples. *, P ≤ 0.05 as determined by a Student t test. C, Representative POM121 IHC images and quantification of tumor cells with nucleoplasmic POM121 (sPOM121) in primary (n = 30) and metastatic (n = 24) prostate cancer tissue samples. *, P ≤ 0.05 as determined by a Student t test. D, Representative images of transmission electron microscopy (TME) after POM121 immunogold staining and quantification of sPOM121 nucleoplasmic signal in primary (n = 3) and advanced (n = 3) prostate cancer tissue samples. sPOM121 immunogold stain was quantified from 15 cells from each tissue sample. Blue dotted lines delineate the nuclear envelope (NE). Blue and yellow arrows point to relevant signal clusters of TM-POM121 and sPOM121, respectively. Cyt, cytoplasm; Nuc, nucleus. *, P ≤ 0.05 as determined by a Student t test. E, Representative images and quantification of photon flux signals from mice 21 days after intracardially injected with 105 luciferase-tagged prostate cancer cells (22Rv1 and DU145) stably expressing shRNA-control or -sPOM121. Ten male mice were used in each experimental group. *, P ≤ 0.05 as determined by a Student t test. F, Diagram illustrating the experimental workflow using sPOM121-depleted prostate cancer PDX organoid models (PDO) and representative POM121 staining images of shRNA-control or -sPOM121 organoids. G, Survival of mice injected intracardially with 105 shRNA-control or -sPOM121 cancer cells from prostate cancer patient-derived organoids (PDO). Ten male mice were used for each experimental group. Survival was analyzed using the Kaplan–Meier method.
Figure 2.
Figure 2.
sPOM121 is preferentially enriched at gene promoters. A, POM121, hnRNPA, and histone H3 immunoblots in 22Rv1 total, nuclear, and chromatin subcellular fraction protein extracts after control or sPOM121 knockdown (KD). Arrows point to both POM121 isoforms. B, Experimental design of sPOM121 ChIP-seq and pie chart of its genomic enrichment annotation. C, Top 20 motifs most significantly enriched in sPOM121 ChIP-seq peaks. The X-axis represents the TFs, and the Y-axis represents the difference of motif enrichment (indicated by Z-score) in ChIP-seq compared with the input DNA. The dash line indicates Bonferroni-corrected P = 0.05. D, Representative images and quantification of POM121-RNA Pol II (up) and POM121-RNA Pol II phospho S5 (S5, down) PLAs in control or sPOM121 KD prostate cancer cells. One hundred nuclei were counted for each condition. Data represent the mean ± SD of at least three independent experiments. *, P ≤ 0.05 as determined by a Student t test. E, Representative images and quantification of POM121-RNA Pol II phospho S5 (S5) PLA in a cohort of primary/localized (n = 14) and metastatic (n = 14) prostate cancer tissue samples. Black lined circles = matched samples. *, P ≤ 0.05 as determined by a Student t test. F, Gene Ontology (GO) analysis of biological processes enriched in sPOM121 ChIP-seq in two prostate cancer cell lines (22Rv1 and DU145). G, Genome browser tracks of sPOM121 peak enrichment at promoters of specific genes representing top biological categories from F. ChIP-seq and corresponding input DNA of the same gene are plotted.
Figure 3.
Figure 3.
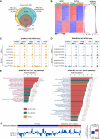
sPOM121 localizes at gene promoters through SMARCA5 interaction. A, Experimental design to determine sPOM121 chromatin interactome using RIME (left). Venn diagram of commonly identified sPOM121-interacting proteins in three prostate cancer cell lines (right). B, Gene Ontology (GO) molecular functions enriched in sPOM121 protein interactome (g:Profiler). P value computed by a Fisher test corrected with Benjamini–Hochberg FDR. C, Table describing top sPOM121-interacting proteins and their overlap with RNA Pol–interacting proteins from a publicly available proteomic dataset. D, POM121, SMARCA5, DDX54, RBM25, and histone H3 immunoblots after POM121 IP using nuclear (N) and chromatin (Ch) subcellular fraction protein extracts from 22Rv1, DU145, and VCaP cells. Arrows point to both POM121 isoforms. E, Representative images and quantification of POM121–SMARCA5 PLA in control or sPOM121 knockdown (KD) cells. Data represent the mean ± SD of at least three independent experiments. *, P ≤ 0.05 as determined by a Student t test. F, Representative images and quantification of POM121–SMARCA5 PLA in a cohort of primary/localized (n = 14) and metastatic (n = 14) prostate cancer tissue samples. Black lined circles = matched samples. *, P ≤ 0.05 as determined by a Student t test. G, Venn diagram of sPOM121 and SMARCA5 ChIP-seq peaks at promoter sites in 22Rv1 and DU145 prostate cancer cells. H, Genome browser tracks of SMARCA5 peak enrichment at promoters of sPOM121-specific genes. ChIP-seq and corresponding input DNA of the same gene are plotted. I, ChIP-qPCR analysis of sPOM121 enrichment at gene promoters comparing control and SMARCA5 KD in 22Rv1 and DU145 cells. Data represent the mean ± SD of at least three independent experiments. *, P ≤ 0.05 as determined by a Student t test.
Figure 4.
Figure 4.
The C-terminus of sPOM121 is essential for SMARCA5 interaction and localization to nucleoplasmic condensates. A, Diagram of GFP-fused sPOM121 deletion mutant proteins. N terminal (NT), middle (M) and C terminal (CT) protein fragments are highlighted in orange, yellow, and purple, respectively. FL, full length. B, GFP and SMARCA5 immunoblots after GFP IP from 22Rv1 cells stably expressing sPOM121 fragments under endogenous sPOM121 knockdown. C, SMARCA5 and GFP immunoblots after SMARCA5 IP from 22Rv1 cells stably expressing sPOM121 fragments under endogenous sPOM121 knockdown. D, ChIP-qPCR enrichment of GFP at gene promoters of indicated genes comparing FL, ΔC, and CT sPOM121-GFP under endogenous sPOM121 knockdown in 22Rv1 cells. Data represent the mean ± SD of at least three independent experiments. *, P ≤ 0.05 as determined by a Student t test. E, Representative GFP IF z-projection images and quantification of nucleoplasmic foci in 22Rv1 cells expressing FL, ΔC, and CT sPOM121-GFP under endogenous sPOM121 knockdown. A total of 60 nuclei for each condition were quantified. Data represent the mean ± SD of at least three independent experiments. *, P ≤ 0.05 as determined by a Student t test. F, POM121 and FUS immunoblots from input, supernatant, and pellet of 22Rv1 chromatin fractions treated with 33 or 100 μmol/L b-isox. G, Representative POM121 IF z-projection images and nucleoplasmic foci quantification of endogenous sPOM121 in 22Rv1 cells treated with vehicle or with 5% HD for the indicated times. A total of 36 nuclei for each condition were quantified. Data represent the mean ± SD of at least three independent experiments. *, P ≤ 0.05, determined by Student t test. H, Representative images and quantification of fluorescence recovery of sPOM121-GFP nuclear foci after photobleaching (FRAP) in 22Rv1 cells. A total of 30 cells were assessed. I, Diagram of wild type (WT) and FG repeats mutant (FS, phenylalanine to serine substitution) in FL and CT sPOM121 proteins. Representative GFP IF z-projection images and quantification of nucleoplasmic foci in 22Rv1 cells expressing FL and CT sPOM121-GFP, wild-type (WT) or FS, under endogenous sPOM121 knockdown. A total of 60 nuclei for each condition were quantified. Data represent the mean ± SD of at least three independent experiments. *, P ≤ 0.05 as determined by a Student t test. J, GFP and SMARCA5 ChIP-qPCR enrichment at gene promoters of indicated genes comparing 22Rv1 cells expressing either sPOM121-GFP WT or FS mutant under endogenous sPOM121 knockdown. Data represent the mean ± SD of at least three independent experiments. *, P ≤ 0.05 as determined by a Student t test. K, GFP and SMARCA5 immunoblots after GFP IP from 22Rv1 cells stably expressing WT or FS mutant FL and CT sPOM121, under endogenous sPOM121 knockdown. L, Diagram of sPOM121-FL and FUS-IDR chimera proteins. Representative GFP IF images and quantification of nucleoplasmic foci in 22Rv1 cells expressing sPOM121-FL or the sPOM121 FUS-IDR chimera, under endogenous sPOM121 knockdown. A total of 60 nuclei for each condition were quantified. Data represent the mean ± SD of at least three independent experiments. n.s., non-significant. M, GFP and SMARCA5 immunoblots after GFP IP from 22Rv1 cells stably expressing sPOM121 WT or the FUS-IDR chimera, under endogenous sPOM121 knockdown. N, Nascent mRNA quantification of indicated genes in 22Rv1 cells expressing sPOM121-FL WT, FS-mutant, or FUS-IDR chimera, under endogenous sPOM121 knockdown. Data represent the mean ± SD of at least three independent experiments. *, P ≤ 0.05 as determined by a Student t test.
Figure 5.
Figure 5.
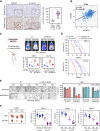
sPOM121 reprograms lethal prostate cancer. A, Venn diagram showcases the overlap of genes from RNA-seq of sPOM121 knockdown (KD), ATAC-seq of sPOM121 KD, and ATAC-seq of SMARCA5 KD of 22Rv1 and DU145 cells at promoter sites. B, Heatmap of sPOM121–target gene promoter signature obtained upon sPOM121 KD. Red and blue indicate high and low gene expression, respectively. C, ATAC-seq genome browser tracks of specific gene promoters comparing control vs. sPOM121 KD. D, ATAC-seq genome browser tracks of specific gene promoters comparing control vs. SMARCA5 KD. E, Gene set enrichment analysis of sPOM121–target gene signature in Hallmark, Reactome, and Kyoto Encyclopedia of Genes and Genomes (KEGG) databases. F, Left, modulation of the sPOM121–target gene expression signature in a publicly available patient sample dataset containing primary/localized prostate cancer and metastatic warm autopsy samples (Grasso GSE35988). Right, gene set enrichment (GSEA) index box plot.
Figure 6.
Figure 6.
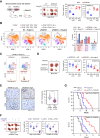
sPOM121 promotes prostate cancer aggressiveness by regulating β-catenin expression. A, Representative IHC images and quantification of β-catenin in a cohort of prostate cancer tissue samples exhibiting sPOM121 high and low expression. *, P ≤ 0.05 as determined by a Student t test. B, Correlation (Pearson) between CTNNB1 (β-catenin) and sPOM121 mRNA expression in the TCGA dataset of patients with prostate cancer. C, Representative images and quantification of photon flux signals of mice 21 days after intracardially injected with 105 luciferase-tagged 22Rv1 and DU145 cells expressing EV and sPOM121 transduced with shControl or shβ-catenin. Ten male mice were used in each experimental group. *P ≤ 0.05 as determined by a Student t test. D, Survival of mice from C. Survival was analyzed using the Kaplan–Meier method. E, Representative images and quantification of prostate cancer PDX organoids (PDO1) expressing either EV or β-catenin ΔN89 transduced with shControl or shsPOM121 and treated for 7 days with vehicle (Veh; DMSO), enzalutamide (Enz; 10 μmol/L), or docetaxel (Doc; 50 nmol/L). Data represent the mean ± SD of at least three independent experiments. *, P ≤ 0.05 when comparing the effect of enzalutamide or docetaxel with vehicle in shsPOM121 PDOs. *, P ≤ 0.05 comparing EV vs. β-catenin ΔN89 in shsPOM121 PDX organoids (PDO) treated with enzalutamide or docetaxel. P value determined by a Student t test. F, Representative images and tumor weight of mice subcutaneously injected with prostate cancer PDX organoids (PDO1, PDO2, and PDO3) treated with vehicle or ICG-001 (25 mg/kg/i.p., 5 days a week), docetaxel (10 mg/kg i.p. weekly), or enzalutamide (25 mg/kg orally alternate days) alone or in combination. Ten male mice were used for each treatment group. *, P ≤ 0.05 as determined by a Student t test.
Figure 7.
Figure 7.
sPOM121 promotes prostate cancer immune evasion. A, Representative image and quantification of tumor weights of EV and sPOM121-expressing MyC-CaP and TRAMP-C2 tumors intratumorally injected with vehicle (PBS) or Poly(I:C) at 2.5 mg/kg every 2 days for 14 days. Ten male mice were used for each experimental group. *, P ≤ 0.05 as determined by a Student t test. B, Representative CyTOF plots depicting cell populations in MyC-CaP tumors. Plots illustrate PhenoGraph-defined distribution and clustering of cells defined by tSNE1 and tSNE2 (t-distributed stochastic neighbor embedding) and colored by cell populations in MyC-CaP EV- and sPOM121-expressing tumors from mice 2 days after the last intratumoral injection of vehicle (PBS) or Poly(I:C) at 2.5 mg/kg. The different cell populations quantified by the PhenoGraph algorithm are shown in the bar graph as means ± SD (n = 3). *, P ≤ 0.05 as determined by one-way ANOVA with Bonferroni correction for multiple tests. MDSC, myeloid-derived suppressor cells. C, Representative flow cytometry plots showing infiltration of CD8 and granzyme B (GzmB)–positive T cells in tumors from sPOM121-expressing MyC-CaP cells transduced with shControl or shβ-catenin and treated with Poly(I:C) at 2.5 mg/kg. Ten male mice were used for each treatment group. D, Representative image and quantification of tumor weights from sPOM121-expressing MyC-CaP and TRAMP-C2 cells transduced with shControl or shβ-catenin and treated with vehicle (PBS) or Poly(I:C) at 2.5 mg/kg. Ten male mice were used for each treatment group. *, P ≤ 0.05 as determined by a Student t test. E, Representative IHC and quantification of CD8+ T lymphocytes in low and high sPOM121-expressing human prostate tumors. CD8+ cells were counted in three different areas of each tumor section. *, P ≤ 0.05 as determined by a Student t test. F, Representative image and quantification of sPOM121-expressing MyC-CaP and TRAMP-C2 tumor weight of mice treated with vehicle (DMSO/IgG), ICG-001 (25 mg/kg/i.p., 5 days a week), or anti–PD-1 (250 μg/i.p., alternate days) alone or in combination. Ten male mice were used for each treatment group. *, P ≤ 0.05 as determined by a Student t test. G, Survival of mice from F. Survival was analyzed using the Kaplan–Meier method.

References

    1. Knockenhauer KE, Schwartz TU. The nuclear pore complex as a flexible and dynamic gate. Cell 2016;164:1162–71. - PMC - PubMed
    1. Wente SR, Rout MP. The nuclear pore complex and nuclear transport. Cold Spring Harb Perspect Biol 2010;2:a000562. - PMC - PubMed
    1. Rodriguez-Bravo V, Maciejowski J, Corona J, Buch HK, Collin P, Kanemaki MT, et al. Nuclear pores protect genome integrity by assembling a premitotic and Mad1-dependent anaphase inhibitor. Cell 2014;156:1017–31. - PMC - PubMed
    1. Ibarra A, Hetzer MW. Nuclear pore proteins and the control of genome functions. Genes Dev 2015;29:337–49. - PMC - PubMed
    1. Capelson M, Liang Y, Schulte R, Mair W, Wagner U, Hetzer MW. Chromatin-bound nuclear pore components regulate gene expression in higher eukaryotes. Cell 2010;140:372–83. - PMC - PubMed