. 2025 Jun 22;15(7):404.
doi: 10.3390/bios15070404.

Whole-Cell Fiber-Optic Biosensor for Real-Time, On-Site Sediment and Water Toxicity Assessment: Applications at Contaminated Sites Across Israel

Affiliations

Whole-Cell Fiber-Optic Biosensor for Real-Time, On-Site Sediment and Water Toxicity Assessment: Applications at Contaminated Sites Across Israel

Gal Carmeli et al. Biosensors (Basel). .

Abstract

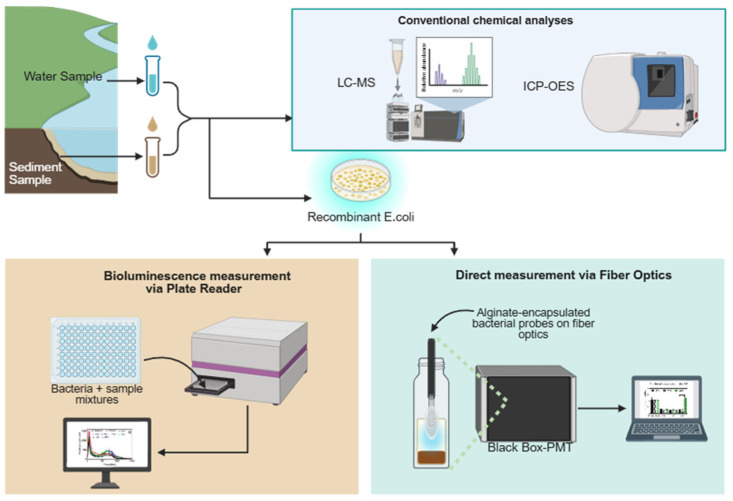
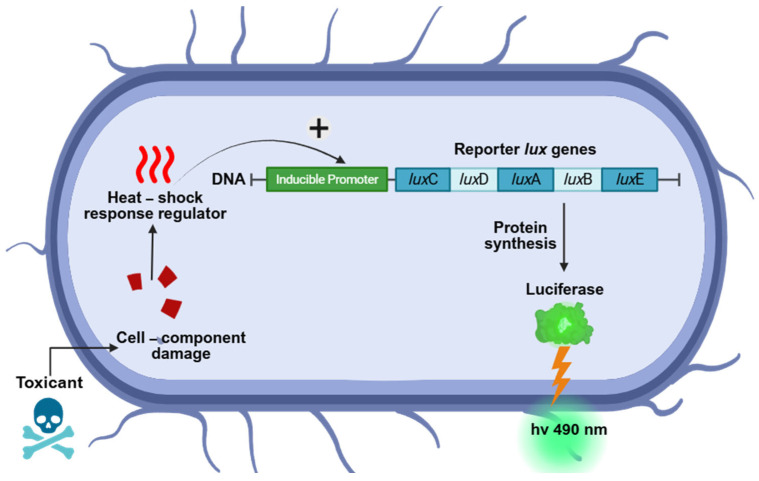
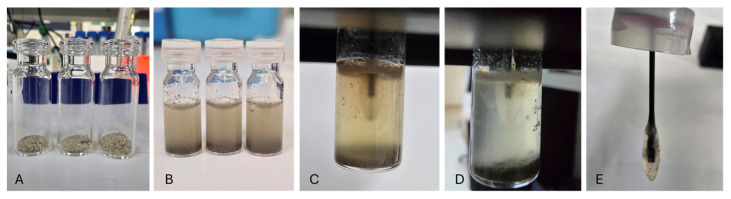
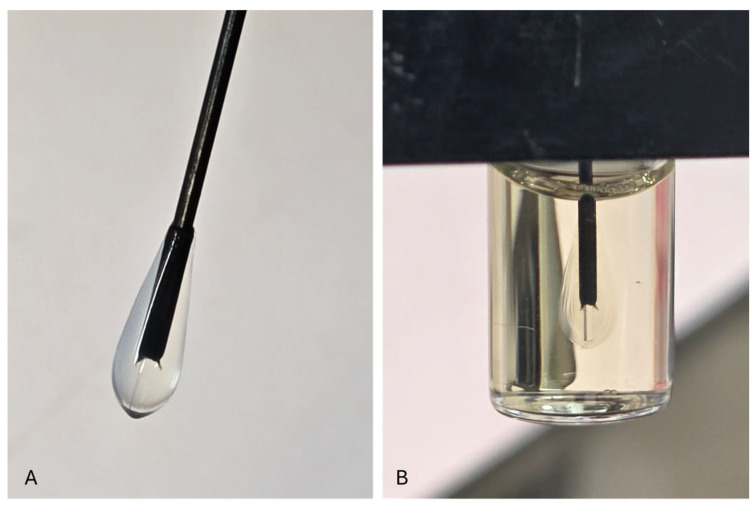
Sediments are key players in the optimum functioning of ecosystems; however, they also represent the largest known repository of harmful contaminants. The vast variety of these sediment-associated contaminants may exert harmful effects on marine communities and can impair ecosystem functioning. Whole-cell biosensors are a rapid and biologically relevant tool for assessing environmental toxicity. Therefore, in this study, we developed a bioassay-based toxicity measurement system using genetically modified bacteria to create a whole-cell optical biosensor. Briefly, reporter bacteria were integrated and immobilized using a calcium alginate matrix on fiber-optic tips connected to a photon counter placed inside a light-proof, portable case. The calcium alginate matrix acts as a semi-permeable membrane that protects the reporter-encapsulated optical fiber tips and allows the inward passage of toxicant(s) to induce a dose-dependent response in the bioreporter. The samples were tested by directly submerging the fiber tip with immobilized bacteria into vials containing either water or suspended sediment samples, and the subsequent bioluminescent responses were acquired. In addition to bioavailable sediment toxicity assessments, conventional chemical methods, such as liquid chromatography-mass spectroscopy (LC-MS) and inductively coupled plasma optical emission spectroscopy (ICP-OES), were used for comprehensive evaluation. The results demonstrated the efficacy of the biosensor in detecting various toxicity levels corresponding to identified contaminants, highlighting its potential integration into environmental monitoring frameworks for enhanced sediment and water quality assessments. Despite its utility, this study notes the system's operational challenges in field conditions, recommending future enhancements for improved portability and usability in remote locations.

Keywords: bioluminescent bacteria; bioreporter; in situ monitoring; optical-fiber biosensor; sediment toxicity; water toxicity; whole-cell biosensor.


Conflict of interest statement

R.S.M. is the co-founder of footprints. The other authors have no conflicts of interest to declare.

Figures

Figure 1
Figure 1
Sample collection. (A) Sampling sites across Israel; (B) Hadera (HD2) Stream; (C) Alexander (AX1) River; (D) Yarkon (YA2) River; and (E) Beersheba (BS1) stream. The coordinates are listed in Supplementary Table S1).
Figure 2
Figure 2
Human activity at potentially polluted sites. (A) Fishing at Hadera Stream alongside a sign that says “Danger—risk of contamination, bathing, sailing, and fishing is strictly prohibited”; (B) sailing at Alexander River.
Figure 3
Figure 3
Experimental workflow for this study. Water and sediment samples were evaluated using both a plate reader and a field-enabled optical fiber whole-cell biosensor in combination with conventional methods (Created in BioRender. Marks, R. (2025), https://BioRender.com/9yr6jqi, accessed on 20 February 2025).
Figure 4
Figure 4
Mechanism of bioluminescence toxicity measurements. A toxicant penetrates the cell wall and binds to an intracellular heat shock receptor, initiating a signaling cascade to the grpE promoter. This promoter facilitates the transcription of the reporter gene (luxCDABE), leading to the induction of lux gene expression. Consequently, luciferase synthesis increases, resulting in a detectable luminescence signal. Toxicants cause protein damage, which activates specialized regulatory proteins that simultaneously trigger stress response genes and lux genes. When the stimulus is sufficiently harmful to impair cellular function and disrupt metabolic processes, luminescence decreases, owing to reduced luciferase synthesis and substrate depletion (created with biorender.com, accessed on 20 February 2025).
Figure 5
Figure 5
Direct testing using the fiber-optic whole-cell bacterial setup (black box). (A) Dry sediment samples; (B) sediment samples in LB broth and CaCl2; (C) probe immersed in solution B prior to measurements; (D) sample following measurement; (E) probe outside of the vial after measurements. The appearance of the biosensor probe during water measurement is shown in Figure S1 in the Supplementary Material.
Figure 6
Figure 6
Setup of fiber-optic probe: (A) encapsulated in alginate bacteria and (B) inserted into the black box housing the bacterial probe and photon-counting unit of the whole-cell biosensor unit.
Figure 7
Figure 7
Fiber-optic-based reporter bioluminescent bacterial direct sediment toxicity response. The wet sediment and water samples were tested on-site, whereas the sediment extracts and dry sediment samples were tested in the laboratory after the samples were oven-dried, and the moisture content was determined. The results indicate that in several cases, especially in BS1 and YA2, the water samples yielded higher induction factors than the sediment, suggesting greater bioavailable toxicity in the aqueous phase. Ethanol was used as a positive control. The results for each location were statistically compared between dry and wet sediments and water collected from the same location (* p < 0.05, ** p < 0.01 *** p < 0.001). The results are expressed as the mean of replicate measurements, and the error bars represent the standard deviation (SD).
Figure 8
Figure 8
Bioluminescence and bacterial growth curves in response to bioavailable sediment extracts. (a) Kinetic curves of the bioluminescent response of the bioavailable toxicant obtained during the 24 h extraction. (b) Bacterial growth curve (OD600) during toxicity measurements in the presence of bioavailable sediment. (c) Kinetic curve normalized to OD600 at each time point. (d) The induction factor was calculated as described earlier as the ratio of induced bioluminescence to non-induced control. The results are reported as mean ± SD, n = 4. Statistical analysis revealed significant differences in the readings between different samples and ethanol at p < 0.05, 0.01, and 0.001, and ns represents no significant difference at p < 0.05. Results were considered statistically significant at p ≤ 0.05 (*), highly significant at p ≤ 0.01 (**), extremely significant at p ≤ 0.001 (***), and extremely significant at p ≤ 0.0001 (****), as indicated in the figure. Notably, the BS1 extracts triggered significantly higher normalized luminescence than the control (p < 0.001), indicating strong cytotoxic stress.
Figure 9
Figure 9
Bioluminescence responses of water and bioavailable sediment samples. The results showed a bioluminescent response to water samples and bioavailable toxicants prepared instantly or after 24 h of extraction at different times. The 24 h extracts generally produced stronger responses, likely due to the improved solubilization of hydrophobic toxicants. The results are reported as mean ± SD, n = 4. Statistical analysis revealed significant differences in the readings between 0 min and 24 h compared with water within each sample group at p < 0.05, 0.01, and 0.001, and ns represents no significant difference at p < 0.05. Results were considered statistically significant at p ≤ 0.05 (*), highly significant at p ≤ 0.01 (**), extremely significant at p ≤ 0.001 (***), and extremely significant at p ≤ 0.0001 (****), as indicated in the figure. A complete comparison is presented in Supplementary Table S3.
Figure 10
Figure 10
Calibration curve showing the dose-dependent bioluminescent response of the bioreporter to serially diluted sediment samples. (a) Luminescence intensity increased proportionally with sample concentration (sample from location BS1). (b) Bioluminescence decreased with increasing concentration, leading to a negative correlation (sample from location AX1). Linear regression lines (bold) were drawn on a linear scale, and the 95% confidence interval limits were the black dotted lines parallel to the regression lines, the black dots are the data points used in the plot. The equation and the R2 value for each regression line are shown. The result is presented as the mean ± SD of triplicate experiments.
Figure 11
Figure 11
Heatmap of the comparative analysis of chemical composition of sediments versus pure water in four geographical locations (HD2, Hadera; YA2, Yarkon; AX1, Alexander; BS1, Beer Sheva). Blue color represents the chemicals found more abundantly in water; red color represents the chemicals found more abundantly in the sediment samples.
Figure 12
Figure 12
Heatmap of putatively annotated specific toxic compound distributions across various locations. The compounds identified from the LC-MS analysis and heatmap were generated as the ratio of the area under the peaks of the samples divided by that of the blank. Locations A, B, C, D, E, F, G, and H are the HD2 water, HD2 sediment, YA2 water, YA2 sediment, AX1 water, AX1 sediment, BS1 water, and BS1 sediment, respectively. BS1 samples contained high levels of triethanolamine and dichloromethane, which may explain their elevated bioluminescent induction factors. This highlights the site-specific chemical toxicity profiles.

Similar articles

  • Prescription of Controlled Substances: Benefits and Risks.
    Preuss CV, Kalava A, King KC. Preuss CV, et al. 2025 Jul 6. In: StatPearls [Internet]. Treasure Island (FL): StatPearls Publishing; 2025 Jan–. 2025 Jul 6. In: StatPearls [Internet]. Treasure Island (FL): StatPearls Publishing; 2025 Jan–. PMID: 30726003 Free Books & Documents.
  • Management of urinary stones by experts in stone disease (ESD 2025).
    Papatsoris A, Geavlete B, Radavoi GD, Alameedee M, Almusafer M, Ather MH, Budia A, Cumpanas AA, Kiremi MC, Dellis A, Elhowairis M, Galán-Llopis JA, Geavlete P, Guimerà Garcia J, Isern B, Jinga V, Lopez JM, Mainez JA, Mitsogiannis I, Mora Christian J, Moussa M, Multescu R, Oguz Acar Y, Petkova K, Piñero A, Popov E, Ramos Cebrian M, Rascu S, Siener R, Sountoulides P, Stamatelou K, Syed J, Trinchieri A. Papatsoris A, et al. Arch Ital Urol Androl. 2025 Jun 30;97(2):14085. doi: 10.4081/aiua.2025.14085. Epub 2025 Jun 30. Arch Ital Urol Androl. 2025. PMID: 40583613 Review.
  • Electrophoresis.
    Sonagra AD, Zubair M, Dholariya SJ. Sonagra AD, et al. 2025 Jul 14. In: StatPearls [Internet]. Treasure Island (FL): StatPearls Publishing; 2025 Jan–. 2025 Jul 14. In: StatPearls [Internet]. Treasure Island (FL): StatPearls Publishing; 2025 Jan–. PMID: 36251838 Free Books & Documents.
  • Optimized genetic circuitry and reporters for sensitive whole-cell arsenic biosensors: advancing environmental monitoring.
    Guo Y, Liu M-q, Yang X-q, Guo Y-y, Hui C-y. Guo Y, et al. Appl Environ Microbiol. 2025 Aug 20;91(8):e0060125. doi: 10.1128/aem.00601-25. Epub 2025 Jul 10. Appl Environ Microbiol. 2025. PMID: 40637449 Free PMC article.
  • Systemic treatments for metastatic cutaneous melanoma.
    Pasquali S, Hadjinicolaou AV, Chiarion Sileni V, Rossi CR, Mocellin S. Pasquali S, et al. Cochrane Database Syst Rev. 2018 Feb 6;2(2):CD011123. doi: 10.1002/14651858.CD011123.pub2. Cochrane Database Syst Rev. 2018. PMID: 29405038 Free PMC article.

References

    1. de Baat M.L., Wieringa N., Droge S.T., van Hall B.G., van der Meer F., Kraak M.H. Smarter sediment screening: Effect-based quality assessment, chemical profiling, and risk identification. Environ. Sci. Technol. 2019;53:14479–14488. doi: 10.1021/acs.est.9b02732. - DOI - PMC - PubMed
    1. Burton G.A., Jr. Assessing sediment toxicity: Past, present, and future. Environ. Toxicol. Chem. 2013;32:1438–1440. doi: 10.1002/etc.2250. - DOI - PubMed
    1. Massei R., Hollert H., Krauss M., Von Tümpling W., Weidauer C., Haglund P., Küster E., Gallampois C., Tysklind M., Brack W.J. Toxicity and neurotoxicity profiling of contaminated sediments from Gulf of Bothnia (Sweden): A multi-endpoint assay with Zebrafish embryos. Environ. Sci. Eur. 2019;31:8. doi: 10.1186/s12302-019-0188-y. - DOI
    1. Borja A., Valencia V., Franco J., Muxika I., Bald J., Belzunce M., Solaun O. The water framework directive: Water alone, or in association with sediment and biota, in determining quality standards? Mar. Pollut. Bull. 2004;49:8–11. doi: 10.1016/j.marpolbul.2004.04.008. - DOI - PubMed
    1. Besten P.J.D., de Deckere E., Babut M.P., Power B., DelValls T.A., Zago C., Oen A.M.P., Heise S. Biological effects-based sediment quality in ecological risk assessment for European waters. J. Soils Sediments. 2003;3:144–162. doi: 10.1065/jss2003.08.084. - DOI

MeSH terms

Substances

LinkOut - more resources