Review
. 2025 Jul 2;15(7):422.
doi: 10.3390/bios15070422.

Bioluminescence in Clinical and Point-of-Care Testing

Affiliations
Review

Bioluminescence in Clinical and Point-of-Care Testing

Sherwin Reyes et al. Biosensors (Basel). .

Abstract

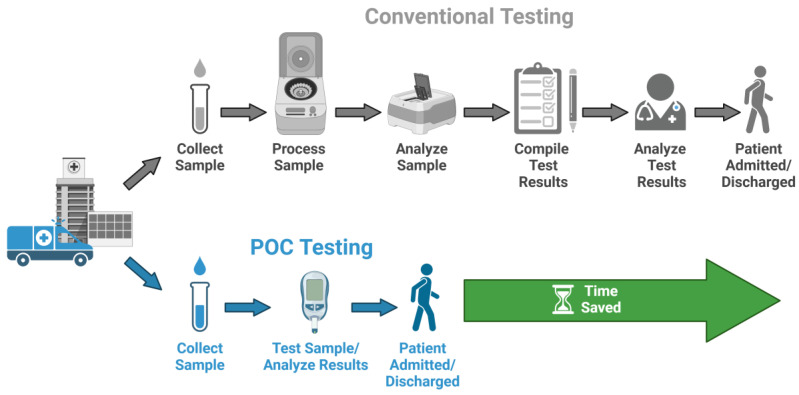
Point-of-care testing (POCT) offers a transformative approach to diagnostics by enabling rapid and accurate results at or near the site of patient care. This is especially valuable in critical care, emergency settings, and resource-limited areas. However, one major limitation of POCT remains its analytical sensitivity, particularly in detecting low concentrations of analytes. To address this, various innovations are being explored, including advanced sensors, signal amplification, and sensitive labels. Among these, bioluminescent proteins have gained attention for their high sensitivity, fast readout, minimal background interference, and simplified instrumentation. Bioluminescence-light emission from biochemical reactions-presents an ideal platform for enhancing POCT sensitivity. In parallel, metal-organic frameworks (MOFs), especially structures like ZIF-8, are emerging as valuable materials in biosensing. Their high porosity, tunable surface properties, and ability to host biomolecules make them excellent candidates for improving analyte capture and signal transduction. When integrated with bioluminescent systems, MOFs can stabilize proteins, concentrate targets, and enhance overall assay performance. This review highlights the role of bioluminescent proteins in medical diagnostics and their application in POCT platforms. We also discuss the potential synergy between MOFs and bioluminescence to overcome current sensitivity limitations. Finally, we examine existing challenges and strategies to optimize these technologies for robust, field-deployable diagnostic tools. By leveraging both the natural sensitivity of bioluminescence and the structural advantages of MOFs, next-generation POCT systems can achieve superior performance, driving forward diagnostic accessibility and patient care outcomes.

Keywords: bioluminescence; clinical diagnostics; encapsulation; metal organic frameworks; point-of-care.


Conflict of interest statement

The authors declare no conflicts of interest.

Figures

Figure 1
Figure 1
Bioluminescence in nature.
Figure 2
Figure 2
Some representative bioluminescent reactions. The reactions are catalyzed by the luciferin, coelenterazine, and flavin oxidizing classes of luciferase reporter transgenes. The chemical structures of the luciferase substrates and their oxidized products are indicated, together with the wavelength of the emitted light.
Figure 3
Figure 3
Bioluminescent technologies (TuBETUr: Tube Bioluminescence Extinction Technology Urine and CUBET: Cellphone-based UTI Bioluminescence Extinction Technology) for the detection of urinary tract infection. The figure was reproduced from [78] with permission.
Figure 4
Figure 4
Point-of-care test schematic diagram.
Figure 5
Figure 5
The design of LUCIDs for PoC diagnostics. (a) Schematic representation of the paper-based device. The LUCID is a fusion protein of SNAP-tag, NanoLuc luciferase (NLuc), and a binding protein (BP). SNAP-tag is labeled with a molecule containing a fluorophore (red star) and a ligand (green ball) that binds to BP. The filter paper was printed with wax circles, and the signal was collected by a digital camera. (b) The variable fragment of the methotrexate antibody (PDB ID: 4OCX) bound to methotrexate (yellow). The N-termini of both chains are indicated in green. The three CDRs (H1-3, blue) on the heavy chain (light blue) and three CDRs (L1-3, red) on the light chain (pink) are involved in antigen binding. (c) In Fab-based LUCIDs, the binding protein is an antibody Fab fragment. SNAP-tag and NanoLuc are attached to the light chain. The figure was reproduced from [109] with permission.
Figure 6
Figure 6
(a) Schematic of the LUMABS working principle with the “closed form” green light-emitting and the “open form” blue light-emitting protein sensor in the absence and presence of target antibody, respectively (NLuc = NanoLuc luciferase; mNG = mNeonGreen fluorescent protein). (b) Schematic of a multi-layer 3D-μPAD. All layers are kept together through lamination. (c) Schematic of the use of a 3D-μPAD for simultaneous detection of three different antibodies. The figure was reproduced from [110] with permission.
Figure 7
Figure 7
Characterization of various LUMABS designs. Luminescence spectra of LUMABS sensors in the absence (blue line) and presence (black line) of 1 nM anti HIV1-p17 antibody for (A) a sensor lacking helper domains, (B) a sensor with leucine zippers as helper domains (HIV-LUMABS-LZ1), and (C) a sensor employing the SH3-proline-rich peptide helper interaction (HIV-LUMABS-1). Spectra were obtained using 100 pM sensor protein. (D) Response of HIV-LUMABS-LZ1 sensor (Kd,app = 115 ± 41 pM) and HIV-LUMABS-1 (Kd,app = 83 ± 10 pM) to increasing antibody concentrations. These titrations were performed at a sensor concentration of 5 pM. All measurements were performed in a buffer composed of 50 mM phosphate, 100 mM NaCl, and 1 mg/mL bovine serum albumin at pH = 7.4. Data points are plotted as mean ± SEM (n = 2). The figure was reproduced from [111] with permission.
Figure 8
Figure 8
(A) Illustration of the bioluminescence reaction mechanism on μTADs, showing the separate dry deposition of LUMABS and its bioluminescent substrate (furimazine) on two intertwisted cotton threads; the emission of bioluminescence changes color from green to blue in response to a specific antibody. (B) Proposed μTADs analysis technique schematic: a total of 5 μL of whole blood sample applied to the device, bioluminescence signal captured by a digital camera or mobile phone camera 5 min after sample application. The figure was reproduced from [14] with permission.
Figure 9
Figure 9
Scheme of the ABS for highly sensitive and quantitative detection of targets. (A) ALP can efficiently degrade ATP to AMP, which subsequently inhibits this bioluminescent reaction. In the presence of ATP, luciferase can catalyze the oxidation of luciferin into oxidized oxyluciferin and produce bioluminescence. (B) In ABS, the presence of target could be captured by the Ab1–MNPs and Ab2–PS–ALP to form the sandwiched PS–target–MNPs immuno-nanocomplex. After magnetic enrichment, the added ATP is dephosphorylated by ALP on the surface of PS, resulting in the change in the bioluminescence intensity (ΔBI) which is quantitatively measured by a portable ATP detector. The figure was reproduced from [112] with permission.
Figure 10
Figure 10
Detector chamber for BAQS: (A,B) shows BAQS for two different models; (CE) displays a reflection film module, a mirror surface module, and default sample chamber, respectively. The figure was reproduced from [98] with permission.
Figure 11
Figure 11
SCC platform for molecular diagnostics using BART-LAMP assay. (A) Detailed CAD rendering of the SCC. (B) A photograph of the assembled SCC. (C) A photograph of the detection microfluidics system. (D) Real-time monitoring of ZIKV amplification using BART-LAMP assay. (E) The quantitative analysis of the ZIKV virus. (F) HIV detection in blood. The figure was adapted from [114] with permission.
Figure 12
Figure 12
Various metal–organic framework architectures along with their respective metallic clusters and organic linkers. The figure was reproduced from [127] with permission.
Figure 13
Figure 13
Metal–organic frameworks (ZIF-8) (A). Encapsulation of TA2-Gluc. (B). TA2-Gluc release at pH 6. (C). TA2-Gluc with its substrate coelenterazine producing bioluminescent signal. The figure was reproduced from [66] with permission.

Similar articles

References

    1. Shaw J.L. Practical challenges related to point of care testing. Pract. Lab. Med. 2016;4:22–29. doi: 10.1016/j.plabm.2015.12.002. - DOI - PMC - PubMed
    1. Aguilera-Herrador E., Cruz-Vera M., Valcárcel M. Analytical connotations of point-of-care testing. Analyst. 2010;135:2220–2232. doi: 10.1039/c0an00307g. - DOI - PubMed
    1. Hansen G.T. Point-of-care testing in microbiology: A mechanism for improving patient outcomes. Clin. Chem. 2020;66:124–137. doi: 10.1373/clinchem.2019.304782. - DOI - PubMed
    1. Luppa P.B., Müller C., Schlichtiger A., Schlebusch H. Point-of-care testing (POCT): Current techniques and future perspectives. TrAC Trends Anal. Chem. 2011;30:887–898. doi: 10.1016/j.trac.2011.01.019. - DOI - PMC - PubMed
    1. Heidt B., Siqueira W.F., Eersels K., Diliën H., van Grinsven B., Fujiwara R.T., Cleij T.J. Point of care diagnostics in resource-limited settings: A review of the present and future of PoC in its most needed environment. Biosensors. 2020;10:133. doi: 10.3390/bios10100133. - DOI - PMC - PubMed

Substances

LinkOut - more resources