. 2025 Jul 10;14(14):1058.
doi: 10.3390/cells14141058.

Hypergravity and ERK Inhibition Combined Synergistically Reduce Pathological Tau Phosphorylation in a Neurodegenerative Cell Model

Affiliations

Hypergravity and ERK Inhibition Combined Synergistically Reduce Pathological Tau Phosphorylation in a Neurodegenerative Cell Model

Valerio Mignucci et al. Cells. .

Abstract

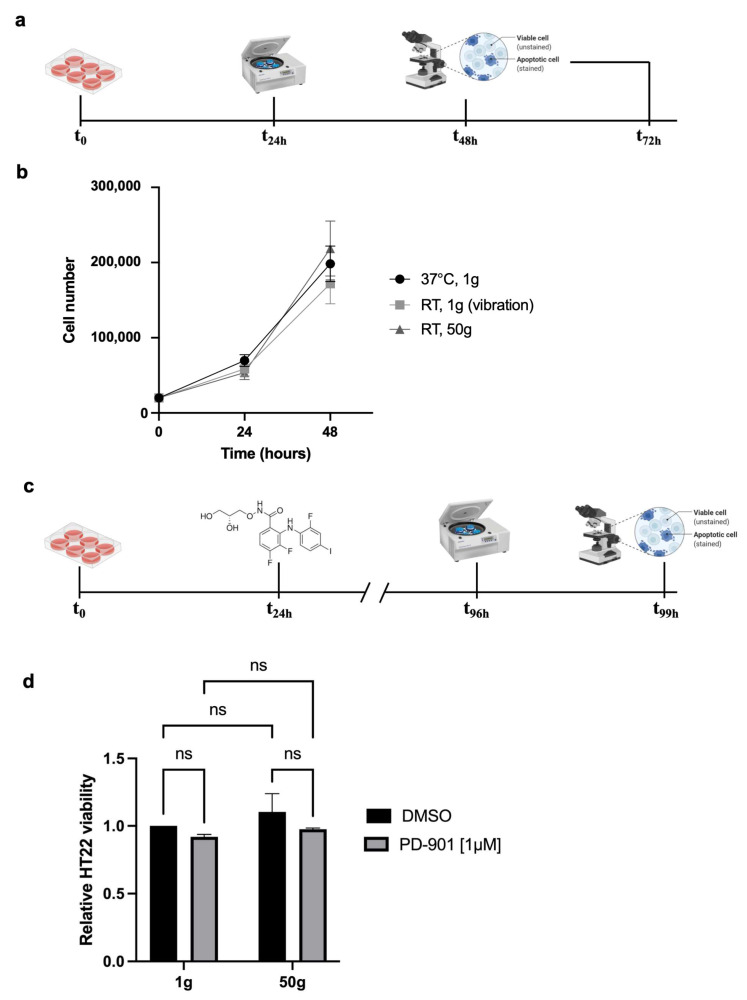
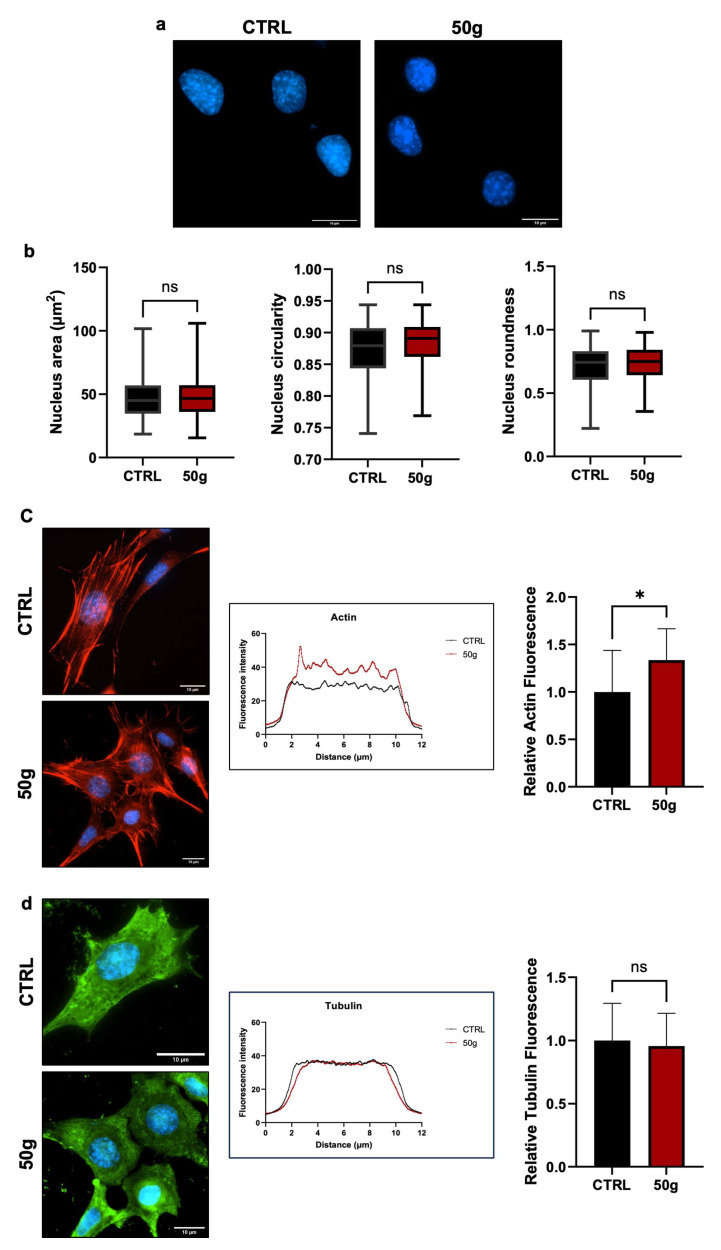
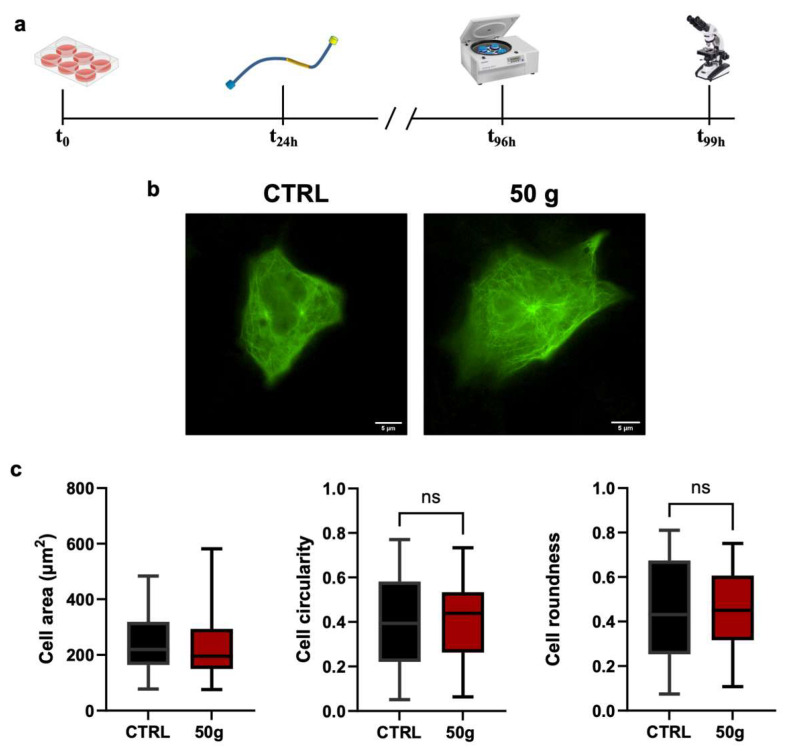
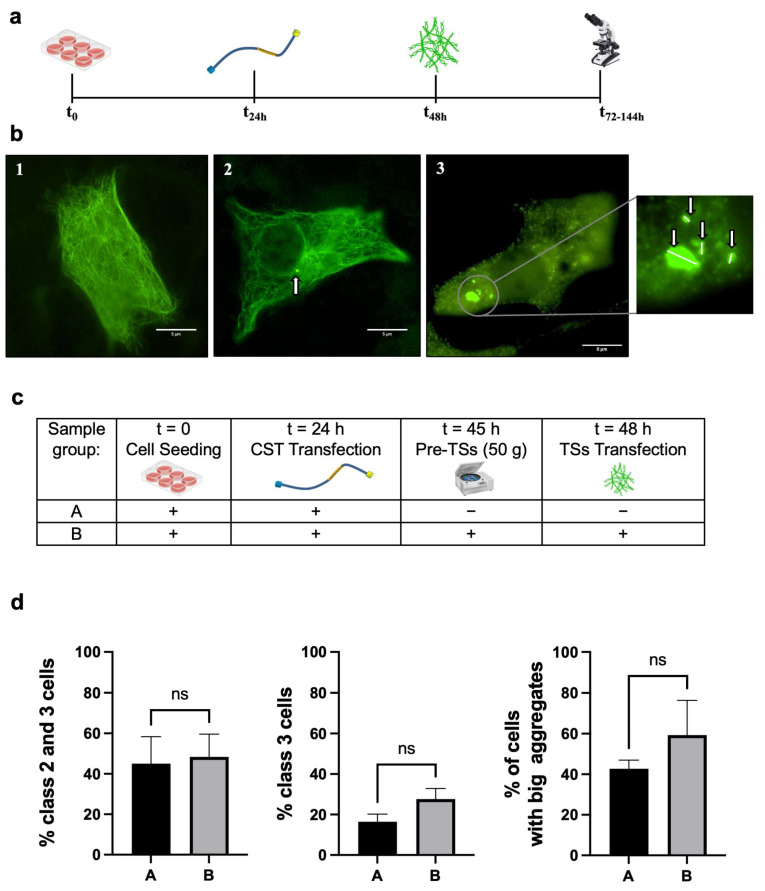
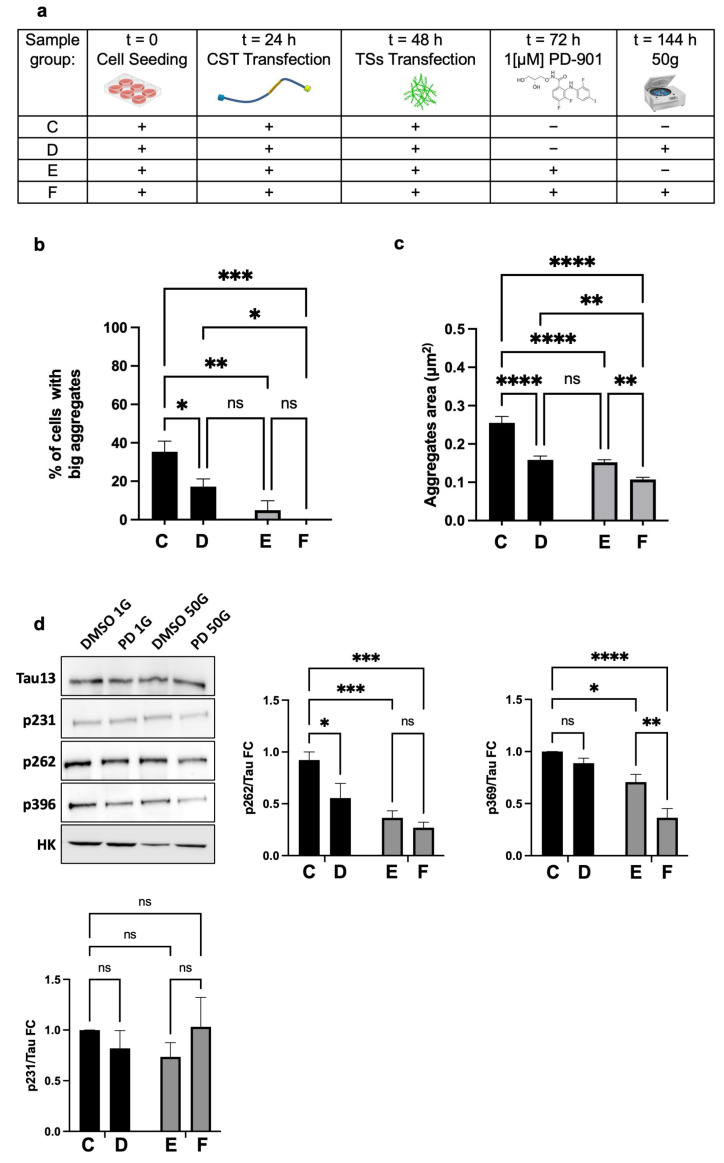
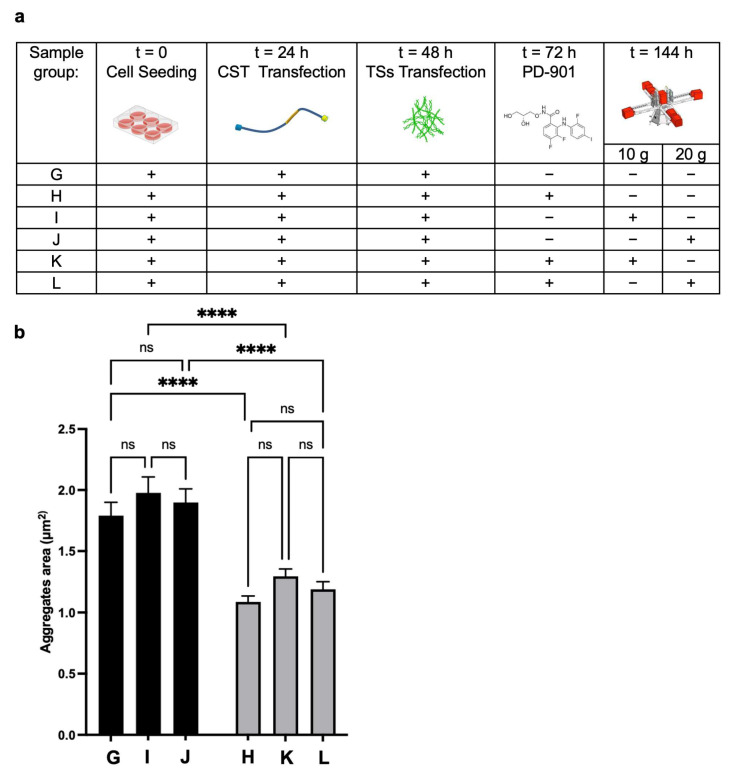
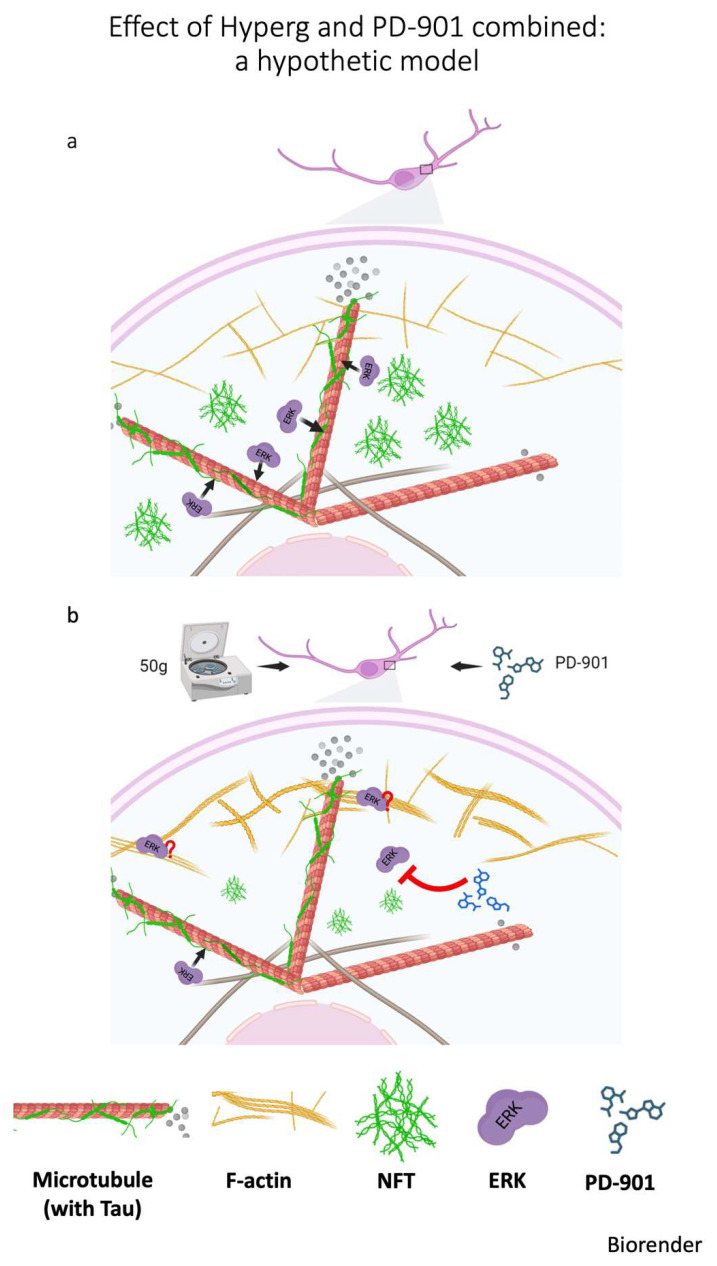
This study evaluates the effects of hypergravity (HG) on a neurodegenerative model in vitro, looking at how HG influences Tau protein aggregation in Mouse Hippocampal Neuronal Cells (HT22) induced by neurofibrillary tangle seeds. Overall, 50× g significantly, synergistically, reduced the Tau aggregate Area when combined with ERK-inhibitor PD-0325901, correlating with decreased phosphorylation at critical residues pS262 and pS396. These findings suggest HG treatments may help mitigate cytoskeletal damage linked to Tau aggregation.

Keywords: European Space Agency (ESA); PD-0325901; hypergravity; large diameter centrifuge (LDC); neurodegeneration; tauopathies.


Conflict of interest statement

Author Jack J.W.A. Van Loon was employed by the European Space Agency. The remaining authors, Valerio Mignucci, Ivana Barravecchia, Davide De Luca, Giacomo Siano, Cristina Di Primio, and Debora Angeloni, declare that the research was conducted in the absence of any commercial or financial relationships that could be construed as a potential conflict of interest.

Figures

Figure 1
Figure 1
Mouse Hippocampal Neuronal Cells HT22 endure exposure to HG and ERK inhibitor PD-901 both alone and combined. (a) 20,000 cells per group were seeded at T0; the next day, cells were exposed to a gravitational acceleration of 50× g for three hours, at RT. Imaging and viability assays were performed 24 and 48 h later. (b) Viability assays of the three groups of samples: one centrifuged at 50× g (triangles), and two reference groups: one left in the cell incubator (circles), one kept at RT on the centrifuge lid (squares) to sense the vibrations of the operating instrument. Data represent mean ± SEM. Statistical test: Two-way ANOVA, n = 3. (c) Experimental design as in A with the adjunctive step of drug administration, 1μM PD-0325901 (PD-901). (d) Viability assay of HT22 cells exposed to 50× g with 1μM PD-901 (gray) or without (Dimethyl sulfoxide, DMSO, as the vehicle, black). Data represent mean ± SEM. Statistical test: Two-way ANOVA, n = 3, ns = not significant, p > 0.05. Note: ‘n = 3’ is an indication of the number of biological replicas (i.e. number of experiments), each one having its own three technical replicas.
Figure 2
Figure 2
HG does not change Area, Circularity, and Roundness of HT22 nuclei; however, it modifies the organization of F-actin but not of microtubules. (a) After the HG treatment that lasted three hours, cells were fixed and stained. Nuclei, stained with 4′,6-diamidino-2-phenylindole (DAPI, blue), of HT22 reference cells (kept on the centrifuge lid at 1× g, CTRL), and of cells centrifuged at 50× g. No morphological differences are evident. Scale bar: 10 µm. (b) Nuclear Area, Circularity, and Roundness are not different between centrifuged and reference cells. Roundness and Circularity were measured as described in the Methods section. Data represent mean ± SEM. Statistical test: Student’s t-test for unpaired groups (ns = not significant). (c) Left: representative images of F-Actin staining of reference (CTRL) and treated (50× g) cells (Phalloidin). Scale bar: 10 µm. Center: fluorescence was analyzed with Plot Profile (ImageJ suite); red curve: samples at 50× g; black curve: reference cells at 1× g. Right: data show an increase of relative fluorescence in centrifuged samples associated with a structural reorganization of fibers. Data represent mean ± SEM. Statistical test: Student’s t-test for unpaired groups. * = p < 0.05. (d) Left: representative images of microtubules (IF with anti-beta-tubulin antibodies) of HT22 reference cells (CTRL) and cells centrifuged at 50× g. Scale bar: 10 µm. Center: fluorescence intensity was analyzed with Plot Profile (ImageJ suite). Red lines: 50× g; black lines: reference cells at 1× g. Right: data do not show any increase in fluorescence intensity. Data represent mean ± SEM. Statistical test: Student’s t-test for unpaired groups. ns = not significant. n = 3 independent biological replicas (i.e., number of experiments), each one having at least three technical replicas. For each replica, at least 20 nuclei were analyzed, and at least 20 cells were analyzed for actin and tubulin staining.
Figure 3
Figure 3
HT22 cells transfected with CST sensor allow visualization of microtubules and endure HG. Tau is an intrinsically disordered protein that, like other natively unfolded proteins, tends to be highly flexible [13]. From being distended when free in the cytosol, Tau shifts to a hairpin structure when bound to microtubules [13]. This change prompted researchers to develop a conformational-sensitive Tau (CST) sensor for measuring the ratio of microtubule-bound Tau versus free Tau in the cytoplasm or aggregated into NFTs. The tool, originally developed by co-authors of this work, takes advantage of a full-length Tau protein carrying two different, terminal fluorophores that work as a FRET couple [29]. (a) Experimental design: cells were seeded, allowed to attach and spread, and transfected with the CST sensor (which emits green fluorescence when excited at 500 nm). Microtubules are visualized in detail because of their binding with CST. 96 h from seeding, cells were centrifuged for three hours and immediately afterward fixed and analyzed under the microscope. (b) Results showed that the cells, both reference (that remained on the centrifuge lid, CTRL) and centrifuged at 50× g, maintained their characteristic elongated and branched shape. All recombinant Tau protein was associated with microtubules; no intracellular deposits were observed. The areas of highest fluorescence correspond to the microtubule organizing centers (MTOCs), which are known to contain a dense concentration of Tau protein. Scale bar: 5 µm. (c) Area, Circularity, and Roundness of live, CST-transfected HT22 cells did not change between CTRL and centrifuged cells. Data represent mean ± SEM. Statistical test: groups were compared with Student’s t-test for unpaired samples, n > 45; ns = not significant. n = 3 independent biological replicas (i.e., number of experiments), each one with at least three technical replicas. For each replica, at least 20 cells were analyzed.
Figure 4
Figure 4
Mouse hippocampal cells HT22 transfected with Tau seeds undergo Tau aggregation. (a) Experimental design to evaluate the feasibility of double transfection in HT22 cells, to visualize Tau conformational changes and induce neurofibrillary tangles (NFTs) deposition, as a model of neurodegeneration: cells were seeded, allowed to attach and spread; 24 h later, cells were transfected with CST sensor. 48 h after seeding, cells were also transfected with TSs. Different batches of cells were fixed and analyzed under the microscope up to 5 days after TSs transfection, for a time course evaluation of the phenotype. (b) Analysis of the phenotypes of Tau aggregates (indicated by arrows). CST—positive, TS—transfected cells were divided into three classes based on the phenotype: Class 1, cells expressing CST, with clearly detectable microtubules and no visible aggregates (left); Class 2: cells displaying a small number of aggregates, with CST still visible in the microtubule lattice (center); Class 3: cells exhibiting a high number of aggregates, with microtubules no longer detectable in the cytoskeleton (right). The threshold used to divide aggregates into major and minor was 0.16 μm2, which corresponds to the 75th percentile of the reference group (Sample A, see below). Scale bar: 5 µm. Inset: magnification of Tau aggregates. (c) Experimental design to evaluate a potential protective effect of HG (50× g) from the onset of degeneration (i.e., Tau precipitation). Cells were prepared as above, except for a three-hour centrifugation at 50× g before TS transfection (Pre—TSs, which was performed right at the end of the centrifugation). Cells were observed 24 h later. (d) Results showed that the relative percentage of cells with major Tau aggregates did not change as a result of the Pre−TSs 50× g, suggesting in this scenario, HG does not prevent the onset of Tau precipitation. Data represent mean ± SEM. Statistical test: groups were compared with Student’s t-test for unpaired samples, n > 60; ns = not significant. n = 3 independent biological replicas (i.e., number of experiments), each one having its own technical replicas in the number of at least 3, for each experimental condition. For each technical replicate, at least 30 cells were analyzed.
Figure 5
Figure 5
HG alone, and synergistically when combined with ERK inhibition, significantly reduce pathological Tau phosphorylation at specific, critical residues. (a) Experiment design: cells were seeded, allowed to attach and spread, transfected with CST, induced to Tau deposition, and treated with ERK inhibitor PD-901 (or vehicle). The treatment lasted for 72 h following Tau seed (TS) administration, which induced Tau aggregation. Centrifugation at 50× g for 3 h was applied afterwards. (b) Centrifuged cells (Group D) showed fewer cells with large Tau aggregates, suggesting that HG effectively countered the most aggressive phenotype of Tau aggregation. When HG was combined with PD-901 (Group F), the reduction was even stronger, suggesting that the two treatments have a synergistic effect; although there was no statistical difference, we noticed that cells treated with ERK-inhibitor and HG combined showed no Tau aggregates above the threshold in any of the biological replicas. (c) The synergistic effect of the combined HG and drug administration was also mirrored by the statistically significant reduction of aggregate Area. (d) The morphological observations described above were confirmed by the biochemical analysis: the reduction of p626 was evident after centrifugation, and even more marked after the combination of HG and PD-901. Reduction of p231 was more pronounced after the combined treatments, suggesting that HG alone is not as effective as PD-901 in reducing phosphorylation of this residue. Interestingly, p231 was not modified by either treatment, suggesting a specificity of action of both treatments. Data represent mean ± SEM. Statistical test: groups were compared using one-way ANOVA with Tukey’s multiple comparison post-hoc test. With “n” indicating the number of independent biological replicas, the samples’ size was as follows: n = 6 for p262; n = 7 for p231; n = 5 for p396. ns = not significant, * = p < 0.05, ** = p < 0.01, *** = p < 0.001, **** p < 0.0001.
Figure 6
Figure 6
HG experiment at the LDC facility (ESA-ESTEC, Noordwijk, The Netherlands). (a) HT22 cells were seeded, transfected with the CST sensor, afterwards with TS, then treated with the ERK inhibitor PD-901, or vehicle, and centrifuged at 10× g or 20× g. (b) As expected, cells exposed to PD-901 (gray) showed aggregates with smaller Area compared to vehicle (black). However, the centrifugation per se did not cause any change. Data represent mean ± SEM. Statistical test: one-way ANOVA with Tukey’s multiple comparison post hoc test. ns = not significant. **** = p < 0.0001. n = 3 independent biological replicas (i.e., number of experiments), each one having at least 3 technical replicates. For each replica, at least 35 cells were analyzed.
Figure 7
Figure 7
A hypothetical model of the effect of HG on Tau deposition. (a) In a neuronal degenerative model of NFT deposition, the ERK kinase has access to TAU associated with microtubules, causing further NFT deposition. (b) Centrifugation promotes thickening of actin fibers, sequestering ERK. The drugs synergize with this effect [32]. The red question mark suggests the strengthened association of ERK with F-actin upon HG treatment. The red T–bar indicates inhibition of PD–901 on ERK activity.

Similar articles

References

    1. Clément G., Wood S.J., Reschke M.F. Effects of microgravity on the interaction of vestibular and optokinetic nystagmus in the vertical plane. Aviat. Space Environ. Med. 1992;63:778–784. - PubMed
    1. Roberts D.R., Albrecht M.H., Collins H.R., Asemani D., Chatterjee A.R., Spampinato M.V., Zhu X., Chimowitz M.I., Antonucci M.U. Effects of Spaceflight on Astronaut Brain Structure as Indicated on MRI. N. Engl. J. Med. 2017;377:1746–1753. doi: 10.1056/NEJMoa1705129. - DOI - PubMed
    1. Garrett-Bakelman F.E., Darshi M., Green S.J., Gur R.C., Lin L., Macias B.R., McKenna M.J., Meydan C., Mishra T., Nasrini J., et al. The NASA Twins Study: A multidimensional analysis of a year-long human spaceflight. Science. 2019;364:eaau8650. doi: 10.1126/science.aau8650. - DOI - PMC - PubMed
    1. McGregor H.R., Hupfeld K.E., Pasternak O., Beltran N.E., De Dios Y.E., Bloomberg J.J., Wood S.J., Mulavara A.P., Riascos R.F., Reuter-Lorenz P.A., et al. Impacts of spaceflight experience on human brain structure. Sci. Rep. 2023;13:1–11. doi: 10.1038/s41598-023-33331-8. - DOI - PMC - PubMed
    1. Acharya M.M., Baulch J.E., Klein P.M., Baddour A.A.D., Apodaca L.A., Kramár E.A., Alikhani L., Garcia C., Angulo M.C., Batra R.S., et al. New Concerns for Neurocognitive Function during Deep Space Exposures to Chronic, Low Dose-Rate, Neutron Radiation. eNeuro. 2019;6:ENEURO.0094-19.2019. doi: 10.1523/ENEURO.0094-19.2019. - DOI - PMC - PubMed

MeSH terms

Substances

LinkOut - more resources