. 2025 Jul 11;14(14):1065.
doi: 10.3390/cells14141065.

Temporal and Severity-Dependent Alterations in Plasma Extracellular Vesicle Profiles Following Spinal Cord Injury

Affiliations

Temporal and Severity-Dependent Alterations in Plasma Extracellular Vesicle Profiles Following Spinal Cord Injury

Jamie Cooper et al. Cells. .

Abstract

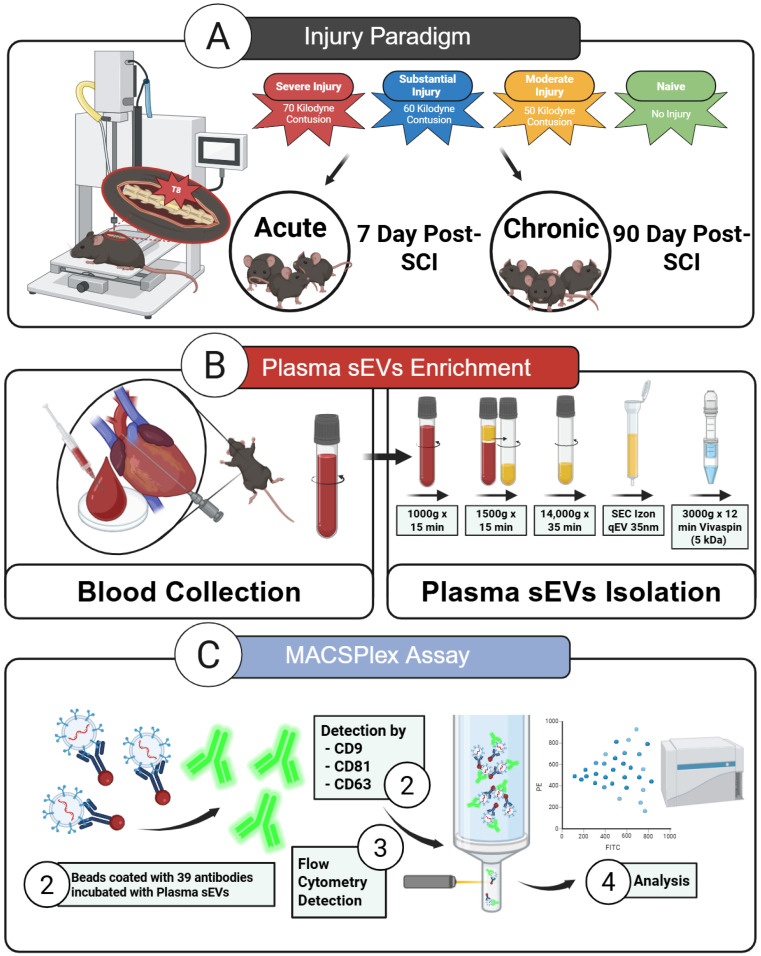
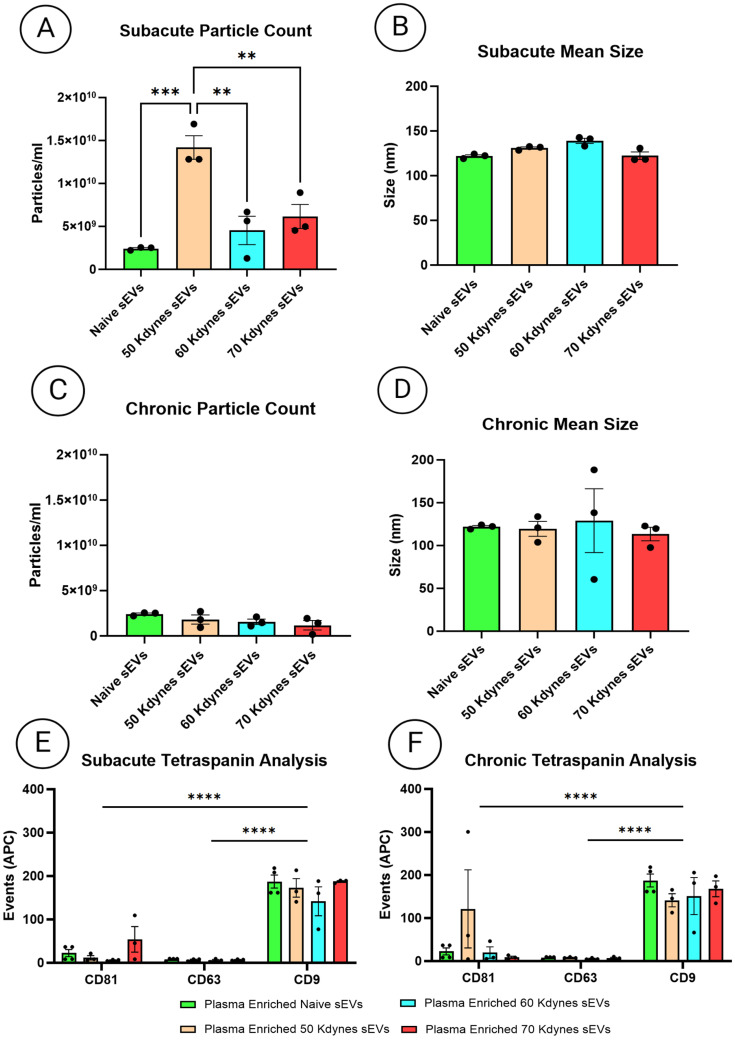
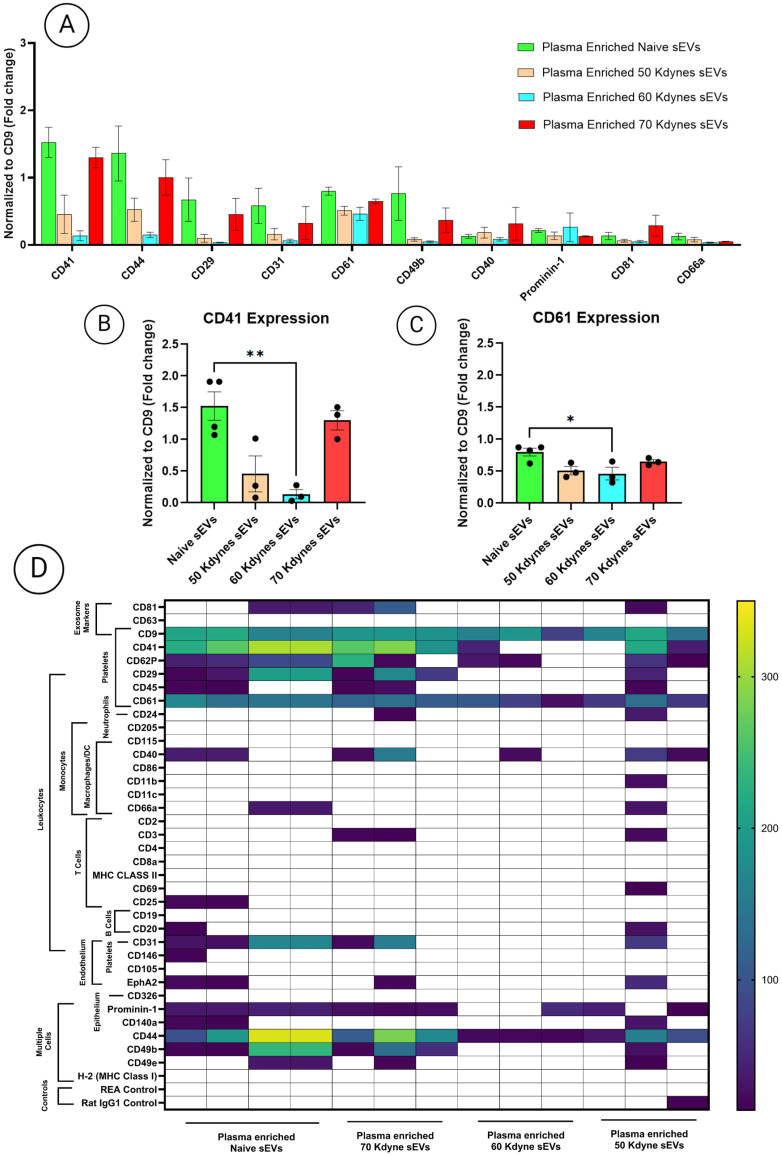
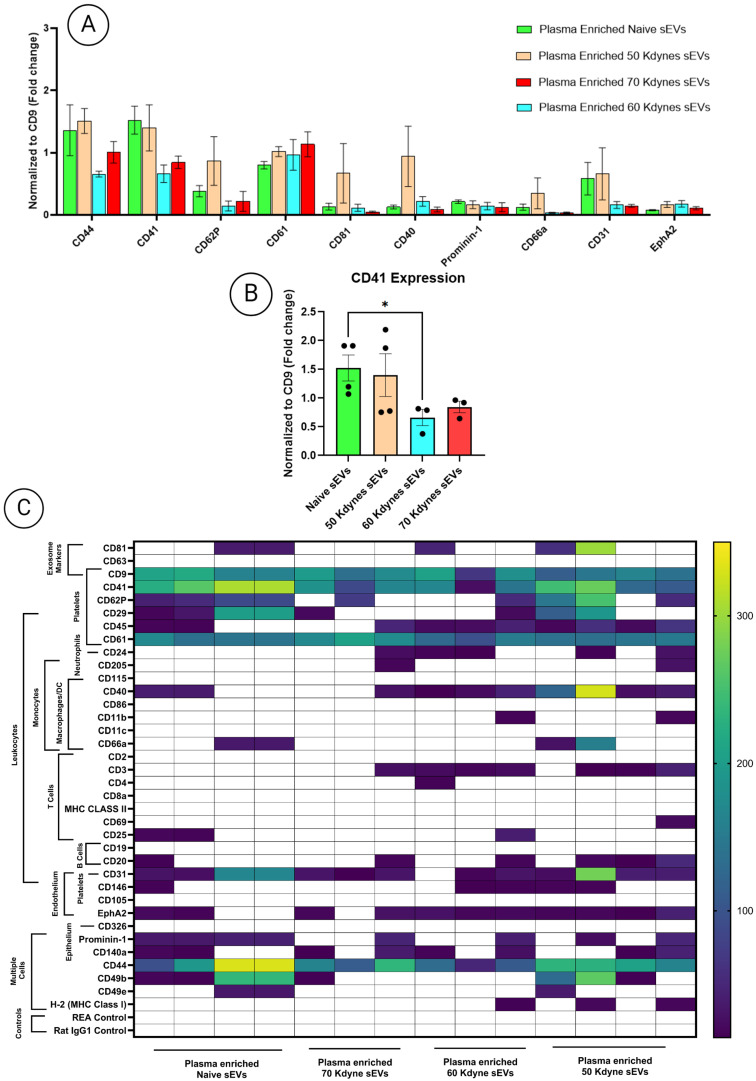
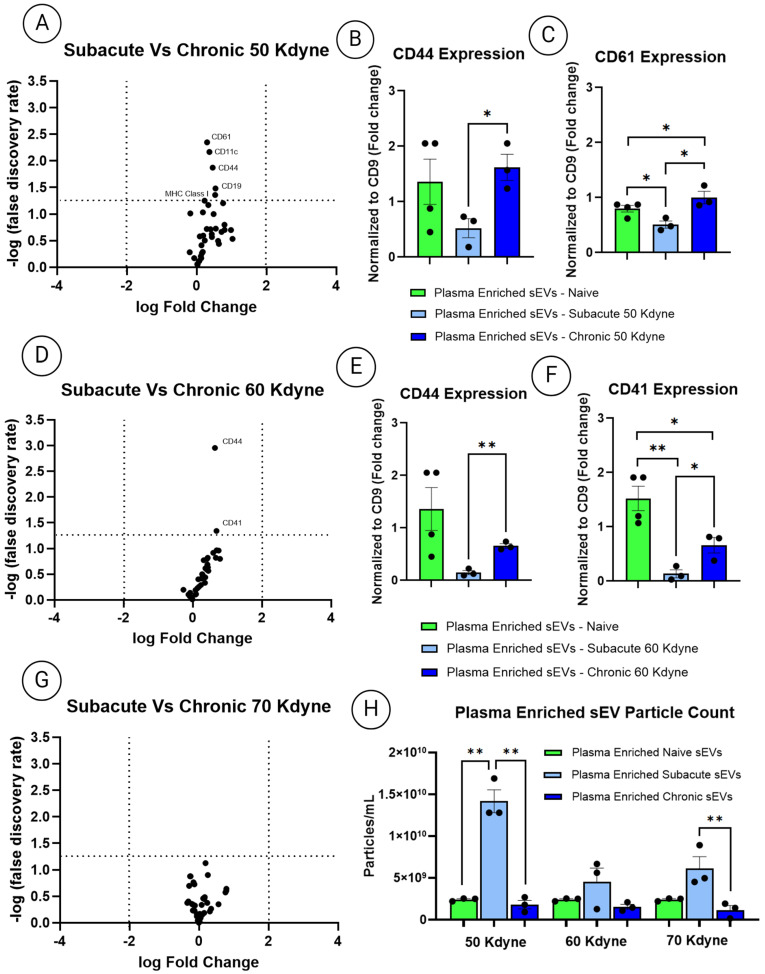
Spinal cord injury (SCI) triggers both local and systemic pathological responses that evolve over time and differ with injury severity. Small extracellular vesicles (sEVs), known mediators of intercellular communication, may serve as biomarkers reflecting these complex dynamics. In this study, we investigated whether SCI severity modulates the composition and abundance of circulating plasma-derived sEVs across subacute and chronic phases. Using a graded thoracic contusion model in mice, plasma was collected at defined timepoints post-injury. sEVs were isolated via size-exclusion chromatography and characterized using nanoparticle tracking analysis (NTA), transmission electron microscopy (TEM), and MACSPlex surface marker profiling. We observed an SCI-dependent increase in sEVs during the subacute (7 days) phase, most notably in moderate injuries (50 kdyne), with overall vesicle counts lower chronically (3 months). CD9 emerged as the predominant tetraspanin sEV marker, while CD63 and CD81 were generally present at low levels across all injury severities and timepoints. Surface sEV analysis revealed dynamic regulation of CD41+, CD44+, and CD61+ in the CD9+ sEV subset, suggesting persistent systemic signaling activity. These markers, traditionally associated with platelet function, may also reflect immune or reparative responses following SCI. Our findings highlight the evolving nature of sEV profiles after SCI and support their potential as non-invasive biomarkers for monitoring injury progression.

Keywords: chronic phase; injury severity; plasma biomarkers; platelet activation; small extracellular vesicles (sEVs); spinal cord injury (SCI); subacute phase.


Conflict of interest statement

The authors declare no conflicts of interest.

Figures

Figure 1
Figure 1
Experimental workflow for the isolation and analysis of plasma-derived sEVs after SCI. (A) Schematic representation of the SCI paradigm, showing graded contusion injuries of 50, 60, and 70 kilodynes (kdyn) at thoracic level T8, along with uninjured naïve controls. Plasma samples were collected at two key timepoints: subacute (7 days post-injury) and chronic (90 days post-injury). (B) Workflow for sEV enrichment from plasma. Perfusate blood was collected via cardiac puncture post-euthanasia and centrifuged to obtain plasma. sEVs were enriched using size-exclusion chromatography (SEC) with qEVoriginal 70 nm columns, enabling removal of soluble protein contaminants and isolation of vesicle-rich fractions. (C) Multiplex immunophenotyping of plasma-derived sEVs using the MACSPlex assay. Enriched vesicles were incubated with a bead-based panel containing 39 antibodies targeting immune and adhesion molecules. Surface marker detection was carried out using a fluorescent tetraspanin cocktail (CD63, CD81, CD9), and samples were analyzed by flow cytometry.
Figure 2
Figure 2
(A) Quantification of impact force at time of SCI for both subacute and chronic cohorts, demonstrating the distinct force profiles for the 50, 60, and 70 kdyne injury groups. (B) BMS locomotor scores for the subacute cohort, comparing naïve and SCI animals (50, 60, and 70 kdyne) at 24 h and 7 days post-injury. (C) BMS locomotor scores over 10 weeks for chronic SCI groups (50, 60, and 70 kdyne). Two-way ANOVA followed by Tukey’s multiple comparisons test was used to assess statistical significance across groups at the corresponding timepoints of blood collection. Significance is indicated as follows: * p < 0.05, *** p < 0.001, **** p < 0.0001. All experiments were performed in triplicate; error bars represent the standard error of the mean.
Figure 3
Figure 3
(A) Identification of sEV-rich plasma fractions using NTA and protein quantification following SEC. Fractions exhibiting low protein content and high particle concentration were pooled together and selected for downstream analysis. (BD) TEM images showing representative sEV morphology from plasma of naïve (B), 70 kdyne and 50 kdyne subacute SCI (C), and chronic SCI (D) mice. (EG) NTA profiles of plasma-derived sEVs from naïve (E), subacute SCI (F), and chronic SCI (G) groups. All experiments were performed in triplicate, with error bars representing the standard error of the mean. One-way ANOVA followed by Tukey’s multiple comparison test was used to assess statistical significance.
Figure 4
Figure 4
(A,B) NTA quantification of particle concentration in plasma-derived sEVs from naïve and injured mice in the subacute (A) and chronic (B) phases post-SCI. (C,D) NTA comparison of mean particle size for naïve versus injured plasma-derived sEVs in the subacute (C) and chronic (D) phases. One-way ANOVA followed by Tukey’s multiple comparison test was used to assess statistical significance. (E,F) MACSPlex analysis of tetraspanins (CD81, CD63, CD9) on plasma-derived sEVs from naïve and subacutely injured mice (E) and from naïve and chronically injured mice (F). Two-way ANOVA followed by Tukey’s multiple comparisons test was used to assess significance across tetraspanin markers. All experiments were performed in triplicate, with error bars representing the standard error of the mean. Significance is indicated as follows: ** p  < 0.01, *** p  < 0.001, **** p  < 0.0001. All experiments were performed in triplicate; error bars represent the standard error of the mean.
Figure 5
Figure 5
(A) MACSPlex analysis of plasma-derived sEVs at the chronic phase post-SCI, showing the top 10 most abundantly detected surface markers (normalized to CD9) across naïve and injury severity groups (50, 60, and 70 kdyne). (B,C) Quantitative comparisons of CD41 (B) and CD61 (C) binding across groups. (D) Summary heatmap of MACSPlex results illustrating relative expression patterns across the four groups. One-way ANOVA followed by Tukey’s multiple comparisons test was used to assess statistical significance. All experiments were performed in triplicate; data are presented as mean ± SEM. Significance levels: * p  <  0.05, ** p  <  0.01.
Figure 6
Figure 6
(A) MACSPlex analysis of plasma-derived sEVs at the chronic phase post-SCI, showing the top 10 most abundantly detected surface markers (normalized to CD9) across naïve and injury severity groups (50, 60, and 70 kdyne). (B) Quantitative comparisons of CD41 binding across groups. (C) Summary heatmap of MACSPlex results illustrating relative expression patterns across the four groups. One-way ANOVA followed by Tukey’s multiple comparisons test was used to assess statistical significance. All experiments were performed in triplicate; data are presented as mean ± SEM. Significance levels: * p  <  0.05.
Figure 7
Figure 7
(A) Comparative analysis of plasma-enriched sEVs derived from subacute and chronic SCI across different injury severities. (AC) Volcano plots illustrating differentially expressed surface markers in MACSPlex analysis between acute and chronic sEVs from mice with 50 kdyne injuries, including CD44 and CD61. (DF) Mice with 60 kdyne injuries, including differences in expression of CD44 and CD41. (G) Mice with 70 kdyne, no differences observed. (H) Particle concentration comparisons of plasma-derived sEVs between acute and chronic timepoints across injury severities, as measured by NTA. One-way ANOVA followed by Tukey’s multiple comparisons test was used to assess group significance. All experiments were performed in triplicate; data are presented as mean ± SEM. Significance levels: * p  <  0.05, ** p  <  0.01.

Similar articles

References

    1. Spinal Cord Injury. [(accessed on 30 May 2025)]. Available online: https://www.who.int/news-room/fact-sheets/detail/spinal-cord-injury.
    1. Hachem L.D., Ahuja C.S., Fehlings M.G. Assessment and management of acute spinal cord injury: From point of injury to rehabilitation. J. Spinal Cord. Med. 2017;40:665–675. doi: 10.1080/10790268.2017.1329076. - DOI - PMC - PubMed
    1. David S., Kroner A. Repertoire of microglial and macrophage responses after spinal cord injury. Nat. Rev. Neurosci. 2011;12:388–399. doi: 10.1038/nrn3053. - DOI - PubMed
    1. Donnelly D.J., Popovich P.G. Inflammation and its role in neuroprotection, axonal regeneration and functional recovery after spinal cord injury. Exp. Neurol. 2008;209:378–388. doi: 10.1016/j.expneurol.2007.06.009. - DOI - PMC - PubMed
    1. Carlson S.L., Parrish M.E., Springer J.E., Doty K., Dossett L. Acute Inflammatory Response in Spinal Cord Following Impact Injury. Exp. Neurol. 1998;151:77–88. doi: 10.1006/exnr.1998.6785. - DOI - PubMed

LinkOut - more resources