. 2025 Jul 18;14(14):1103.
doi: 10.3390/cells14141103.

IP3R2-Mediated Astrocytic Ca2+ Transients Are Critical to Sustain Modulatory Effects of Locomotion on Neurons in Mouse Somatosensory Cortex

Affiliations

IP3R2-Mediated Astrocytic Ca2+ Transients Are Critical to Sustain Modulatory Effects of Locomotion on Neurons in Mouse Somatosensory Cortex

Mario Fernández de la Puebla et al. Cells. .

Abstract

Accumulating studies have shown that astrocytes are essential for regulating neurons at both synaptic and circuit levels. The main mechanism of brain astrocytic intracellular Ca2+ activity is through the release of Ca2+ via the inositol 1,4,5-trisphosphate receptor type 2 (IP3R2) from the endoplasmic reticulum (ER). Studies using IP3R2 knockout mouse models (Itpr2-/-) have shown that eliminating IP3R2 leads to a significant reduction in astrocytic Ca2+ activity However, there is ongoing controversy regarding the effect of this IP3R2-dependent reduction in astrocytic Ca2+ transients on neuronal activity. In our study, we employed dual-color two-photon Ca2+ imaging to study astrocytes and neurons simultaneously in vibrissa somatosensory cortex (vS1) in awake-behaving wild-type and Itpr2-/- mice. We systematically characterized and compared both recorded astrocytic and neuronal Ca2+ activities in wild-type and Itpr2-/- mice during various animal behaviors, particularly during the transition period from stillness to locomotion. We report that vS1 astrocytic Ca2+ elevation in both wild-type and Itpr2-/- mice was significantly modulated by free whisking and locomotion. However, vS1 neurons were only significantly modulated by locomotion in wild-type mice, but not in Itpr2-/- mice. Our study suggests a non-synaptic modulatory mechanism on functions of astrocytic IP3R2-dependent Ca2+ transients to local neurons.

Keywords: Ca2+ signaling; IP3R2; astrocytes; genetically encoded calcium indicator; locomotion; neuromodulation; neuro–glial interaction; two-photon imaging.


Conflict of interest statement

The authors declare no conflict of interest.

Figures

Figure 1
Figure 1
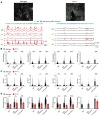
Experimental design and astrocyte activity differences in wild-type and Itpr2−/− mice. (A) Illustration of experimental settings. (B) Representative two-photon dual-color imaging and data presentation in wild-type (left) and Itpr2−/− mice (right). Top: Average projection images of the field-of-view (FOV) display astrocytes (green), neurons (red), and their merged channels. Below: segmentation of mouse behavioral states (Still, Still-Whisking, and Locomotion) along with corresponding Ca2+ signals, which are shown as heatmaps for neurons, and the different astrocytic microcompartments, soma (AS), processes (AP), gliopil (Gp), and endfeet (AE). Scale bar: 20 µm. (C) Quantitative comparison of number of ROIs per FOV (top) and active ROI rate with at least one event per recording (bottom). Top: AS: wild-type: 8.66 ± 0.62, Itpr2−/−: 4.32 ± 0.40, p < 0.001; AP: wild-type: 26.66 ± 1.34, Itpr2−/−: 14.96 ± 1.66, p < 0.001; Gp: wild-type: 44.39 ± 2.07, Itpr2−/−: 38.43 ± 2.68, p = 0.0614; AE: wild-type: 1.24 ± 0.32, Itpr2−/−: 0.57 ± 0.12, p = 0.1568. Bottom: AS: wild-type 0.97 ± 0.02, Itpr2−/− 0.21 ± 0.08, p = 0.0073; AP: wild-type 0.99 ± 0.01, Itpr2−/− 0.09 ± 0.025, p = 0.008; Gp: wild-type 0.99 ± 0.001, Itpr2−/− 0.10 ± 0.029, p = 0.0075; AE: wild-type 1.00 ± 0.00, Itpr2−/− 0.16 ± 0.10, p = 0.0014. Data presented as mean ± sem, p. (D) Top, standard deviation projection images of the astrocyte channel of wild-type (left) and Itpr2−/− mice (right); same FOVs as shown in (B). Scale bars: 20 µm. Bottom, activity correlation of astrocytic pairs from ROIs extracted from the FOV shown above. (E) Distribution of activity correlations between astrocytic ROI pairs across the entire population of all wild-type and Itpr2−/− mice (wild-type r: 0.72 ± 0.14 (mean ± sem) across 139,087 pairs of astrocytes from 41 sessions and six mice; Itpr2−/− r: 0.43 ± 0.25 (mean ± sem) across 52,540 pairs of astrocytes from 28 sessions and five mice; pboot < 0.001). (F) Total duration of each behavioral state recorded from all mice: 48 recordings (10 min each) from six wild-type mice and 21 recordings (5–10 min each) from five Itpr2−/− mice.; ***, p < 0.001.
Figure 2
Figure 2
Layer 2/3 vS1 astrocytes showed reduced Ca2+ activity in Itpr2−/− mice. (A) Top, representative images of astrocytes with ROIs marked with 1–8 from all four astrocytic microcompartments indicated in various colors, in wild-type (left) and Itpr2−/− mice (right). Bottom, representative ROI ΔF/F traces from ROI 1-8 in the above images together with behavioral segmentation in recording timeline. Red traces highlight detected Ca2+ events. Soma (AS), processes (AP), gliopil (Gp), and endfeet (AE). Scale bar: 20 µm. (BD) Measurement of Ca2+ event parameters across different behavioral states (Still, Still-Whisking, and Locomotion). (B) Comparison of astrocytic event frequency. Still: AS, wild-type: 0.69 ± 0.03 (355), Itpr2−/−: 0.06 ± 0.03 (110), p < 0.0001; AP, wild-type: 0.87 ± 0.02 (1093), Itpr2−/−: 0.01 ± 0.004 (381), p < 0.0001; Gp, wild-type: 0.86 ± 0.01 (1820), Itpr2−/−: 0.03 ± 0.00 (1026), p < 0.0001; AE, wild-type: 1.20 ± 0.14 (51), Itpr2−/−: 0 (16), p = —. Still-Whisking AS, wild-type: 1.92 ± 0.11 (308), Itpr2−/−: 0.03 ± 0.013 (90), p < 0.0001; AP, wild-type: 2.56 ± 0.07 (967), Itpr2−/−: 0.001 ± 0.003 (309), p < 0.0001; Gp, wild-type: 2.28 ± 0.05 (1632), Itpr2−/−: 0.014 ± 0.00 (852), p < 0.0001; AE, wild-type: 2.68 ± 0.29 (48), Itpr2−/−: 0 (13), p = —. Locomotion: AS, wild-type: 2.91 ± 0.10 (333), Itpr2−/−: 0.34 ± 0.09 (113), p < 0.0001; AP, wild-type: 2.66 ± 0.06 (1020), Itpr2−/−: 0.13 ± 0.032 (390), p < 0.0001; Gp, wild-type: 2.62 ± 0.04 (1708), Itpr2−/−: 0.14 ± 0.02 (970), p < 0.0001; AE, wild-type: 3.83 ± 0.35 (46), Itpr2−/−: 0.23 ± 0.13 (14), p < 0.0001. (C) Comparison of astrocytic amplitude. Still: AS, wild-type: 0.95 ± 0.02 (1864), Itpr2−/−: 0.24 ± 0.016 (8), p = 0.0024; AP, wild-type: 0.72 ± 0.00 (7134), Itpr2−/−: 0.34 ± 0.1 (7), p = 0.188; Gp, wild-type: 0.55 ± 0.00 (11,642), Itpr2−/−: 0.25 ± 0.01 (41), p = 0.0016; AE, wild-type: 0.80 ± 0.04 (478), Itpr2−/−: 0 (0), p = —. Still-Whisking: AS, wild-type: 1.02 ± 0.04 (778), Itpr2−/−: 0.29 ± 0.027 (8), p = 0.0196; AP, wild-type: 0.74 ± 0.01 (3253), Itpr2−/−: 0.26 ± 0.06 (7), p = 0.032; Gp, wild-type: 0.56 ± 0.01 (4954), Itpr2−/−: 0.26 ± 0.015 (27), p = 0.0013; AE, wild-type: 1.04 ± 0.08 (195), Itpr2−/−: 0 (0), p = —. Locomotion: AS, wild-type: 2.12 ± 0.046 (1089), Itpr2−/−: 0.29 ± 0.022 (38), p < 0.0001; AP, wild-type: 1.39 ± 0.02 (3135), Itpr2−/−: 0.26 ± 0.02 (38), p < 0.0001; Gp, wild-type: 1.00 ± 0.01 (4987), Itpr2−/−: 0.27 ± 0.01 (119), p < 0.0001; AE, wild-type: 2.65 ± 0.12 (163), Itpr2−/−: 0.36 ± 0.15 (4), p < 0.0001. (D) Comparison of astrocytic duration. Still: AS, wild-type: 10.14 ± 0.21(1864), Itpr2−/−: 7.56 ± 0.65 (8), p = 0.024; AP, wild-type: 9.63 ± 0.09 (7134), Itpr2−/−: 7.8 ± 1.66 (7), p = 0.186; Gp, wild-type: 9.19 ± 0.07 (11,642), Itpr2−/−: 7.50 ± 0.72 (41), p = 0.002; AE, wild-type: 7.51 ± 0.29 (478), Itpr2−/−: 0 (0), p = —. Still-Whisking: AS, wild-type: 11.05 ± 0.30 (778), Itpr2−/−: 10.26 ± 3.67 (8), p = 0.0196; AP, wild-type: 10.16 ± 0.13 (3253), Itpr2−/−: 9.19 ± 1.90 (7), p = 0.0545; Gp, wild-type: 9.72 ± 0.10 (4954), Itpr2−/−: 6.44 ± 0.38, p = 0.0009 (27); AE, wild-type: 8.56 ± 0.54 (195), Itpr2−/−: 0 (0), p = —. Locomotion: AS, wild-type: 17.28 ± 0.29 (1089), Itpr2−/−: 10.59 ± 1.13 (38), p < 0.0001; AP, wild-type: 16.18 ± 0.16 (3135), Itpr2−/−: 8.12 ± 0.63 (38), p < 0.0001; Gp, wild-type: 15.80 ± 0.12 (4987), Itpr2−/−: 7.27 ± 0.33 (119), p < 0.0001; AE, wild-type: 17.12 ± 0.80 (163), Itpr2−/−: 13.05 ± 2.98 (4), p = 0.0125. Data presented as mean ± sem (number of events), p. The p-values are derived from post hoc two-sided tests with Tukey’s adjustment for multiple comparisons, following a linear mixed-effects model analysis. *, p < 0.05; **, p < 0.01; ***, p < 0.001.
Figure 3
Figure 3
Ca2+ transients in neurons and astrocytes during the transition period from Still to Locomotion (AC), and behavioral modulatory effects on astrocytic Ca2+ transients (E,F). (A) Astrocytic microcompartments (Soma (AS), processes (AP), gliopil (Gp), and endfeet (AE)) and neuronal activity are shown during the transition from Still to Locomotion in wild-type and Itpr2−/− mice. Average ΔF/F traces (± sem) are color-coded by ROI type and accompanied by the average speed profile on the top (black trances, wild-type: 187 transitions from 40 recordings, six mice; Itpr2−/−: 128 transitions from 25 recordings, five mice). Vertical dashed line in orange indicates the Locomotion onset. (B) Heatmaps of ΔF/F signals for individual events over the transition period. Vertical dashed line in orange indicates the Locomotion onset. Red vertical lines within the heatmap represents event onsets. (C) Quantification of active ROI fraction (left, at least one event) and response reliability rate (right, least three instances of the transition) in two animal groups. Left: Neurons, wild-type: 0.64 ± 0.04; Itpr2−/−: 0.64 ± 0.083; p = 0.99; AS, wild-type: 0.98 ± 0.016; Itpr2−/−: 0.19 ± 0.07; p = 0.0073; AP, wild-type: 0.99 ± 0.0054; Itpr2−/−: 0.07 ± 0.02; p = 0.008; Gp, wild-type: 0.99 ± 0.006; Itpr2−/−: 0.07 ± 0.023; p = 0.0075; AE, wild-type: 1.00 ± 0.00; Itpr2−/−: 0.25 ± 0.19; p = 0.0014. Right: Neurons, wild-type: 0.243 ± 0.001; Itpr2−/−: 0.238 ± 0.0001; pboot = 0.548; AS, wild-type: 0.70 ± 0.0001; Itpr2−/−: 0.02 ± 0.0001; pboot < 0.001; AP, wild-type: 0.72 ± 0.0007; Itpr2−/−: 0.01 ± 0.0001; pboot < 0.001; Gp, wild-type: 0.70 ± 0.0006; Itpr2−/−: 0.01 ± 0.0003; pboot < 0.001; AE, wild-type: 0.67 ± 0.001; Itpr2−/−: –. (D) Quantification of event onsets from Still to Locomotion in two animal groups. Plot with bootstrap median ± sem (based on 10,000 samples) for each ROI type. The pboot was determined via a bootstrap comparison between two groups (Neuron, wild-type: 1.03 ± 0.01 s; Itpr2−/−: 0.93 ± 0.002 s; pboot = 0.5094; AS, wild-type: 1.63 ± 0.002 s; Itpr2−/−: 1.043 ± 0.002 s; pboot = 0.020; AP, wild-type: 1.44 ± 0.01 s; Itpr2−/−: 1.45 ± 0.03 s; pboot = 0.976; Gp, wild-type: 1.44 ± 0.001 s; Itpr2−/−: 0.95 ± 0.003 s; pboot = 0.195). (E) Whisker modulatory index (WhiskMI) for different astrocytic microcompartments in wild-type and Itpr2−/− mice. For each microcompartment, left, distribution of WhiskMI; right, violin plots of bootstrap mean WhiskMI derived from 10,000 population samples. The pboot value indicates the significance of the two-sided test comparing the two bootstrapped populations. (AS, wild-type: 0.343 ± 0.114 (308), Itpr2−/−: 0.055 ± 0.050 (93), pboot < 0.001; AP, wild-type: 0.320 ± 0.072 (962), Itpr2−/−: 0.067 ± 0.034 (312), pboot < 0.001; Gp, wild-type: 0.322 ± 0.036 (1632), Itpr2−/−: 0.122 ± 0.072 (831), pboot < 0.001; AE, wild-type: 0.414 ± 0.068 (48), Itpr2−/−: 0.263 ± 0.152 (15), pboot = 0.084. (F) Locomotion modulatory index (LocMI) for different astrocytic microcompartments in wild-type and Itpr2−/− mice. For each microcompartment, left, distribution of LocMI; right, violin plots of bootstrap mean LocMI derived from 10,000 population samples (AS, wild-type: 0.787 ± 0.053 (349), Itpr2−/−: 0.257 ± 0.126 (83), pboot < 0.001; AP, wild-type: 0.752 ± 0.041 (1069), Itpr2−/−: 0.328 ± 0.084 (292), pboot < 0.001; Gp, wild-type: 0.737 ± 0.036 (1780), Itpr2−/−: 0.281 ± 0.142 (765), pboot < 0.001; AE, wild-type: 0.785 ± 0.044 (50), Itpr2−/−: 0.415 ± 0.266(13), pboot < 0.001). Data presented as mean ± sem (number of events), p. Colored triangles indicate the median of the observed MI. The pboot value indicates the significance of the two-sided test comparing the two bootstrapped populations. *, p < 0.05; **, p < 0.01; ***, p < 0.001.
Figure 4
Figure 4
Behavioral modulatory effects on neuronal Ca2+ activity in wild-type and Itpr2−/− mice. (A) Top: representative images of neurons with ROIs marked with 1-5 indicated in red in wild-type (left) and Itpr2−/− (right) mice. Bottom, representative neuronal ROI 1-5 ΔF/F traces (black) with detected events (red), deconvolved spike rates (blue), and the mean spike rate across all neurons in the FOV (purple) from the above images together with behavioral segmentation in recording timeline. Scale bars: 40 µm. (B) Quantification of neuronal Ca2+ event frequency across behavioral states in two mouse groups (Still, wild-type: 1.19 ± 0.03 (1473), Itpr2−/−: 0.95 ± 0.06 (590), p = 0.457; Still-Whisking, wild-type: 0.80 ± 0.04 (1238), Itpr2−/−: 1.31 ± 0.07 (505), p = 0.12; Locomotion, wild-type: 1.62 ± 0.05 (1332), Itpr2−/−: 1.35 ± 0.09 (561), p = 0.096). (C) Quantification of neuronal spike rate across behavioral states in two mouse groups (Still, wild-type: 0.168 ± 0.004 Hz(1473), Itpr2−/−: 0.167 ± 0.01 Hz (596), p = 0.724; Still-Whisking, wild-type: 0.145 ± 0.006 Hz (1473), Itpr2−/−: 0.187 ± 0.01 Hz (630), p = 0.279; Locomotion, wild-type: 0.336 ± 0.013 Hz, Itpr2−/−: 0.24 ± 0.016 Hz (566), p = 0.0707). The p-values are derived from post hoc two-sided tests with Tukey’s adjustment for multiple comparisons, following a linear mixed-effects model analysis. (D) Left: Scatterplots comparing mean ΔF/F during whisking against still periods for individual neurons in wild-type and Itpr2−/− mice. Middle: histograms display the distribution of the WhiskMI. Right: violin plots of bootstrap mean WhiskMI derived from 10,000 population samples (wild-type: 0.01 ± 0.08, (1226); Itpr2−/−: –0.04 ± 0.082, (465); pboot = 0.521). (E) Left: Scatterplots comparing mean ΔF/F during Locomotion against Still periods for individual neurons in wild-type and Itpr2−/− mice. Middle: histograms display the distribution of the LocMI. Right: violin plots of bootstrap mean LocMI derived from 10,000 population samples (wild-type: 0.203 ± 0.115, (1233); Itpr2−/−: −0.02 ± 0.19, (288); pboot = 0.0482). Data presented as mean ± sem (number of events), p). Colored triangles indicate the median of the observed MI. The pboot represents the significance of the two-sided test comparing the two bootstrapped populations. *, p < 0.05.

Similar articles

References

    1. Semyanov A., Verkhratsky A. Inclusive Brain: From Neuronal Doctrine to the Active Milieu. Function. 2022;3:zqab069. doi: 10.1093/function/zqab069. - DOI - PMC - PubMed
    1. Lyon K.A., Allen N.J. From Synapses to Circuits, Astrocytes Regulate Behavior. Front. Neural Circuits. 2022;15:786293. doi: 10.3389/fncir.2021.786293. - DOI - PMC - PubMed
    1. Nagai J., Yu X., Papouin T., Cheong E., Freeman M.R., Monk K.R., Hastings M.H., Haydon P.G., Rowitch D., Shaham S., et al. Behaviorally Consequential Astrocytic Regulation of Neural Circuits. Neuron. 2021;109:576–596. doi: 10.1016/j.neuron.2020.12.008. - DOI - PMC - PubMed
    1. Hwang S.N., Lee J.S., Seo K., Lee H. Astrocytic Regulation of Neural Circuits Underlying Behaviors. Cells. 2021;10:296. doi: 10.3390/cells10020296. - DOI - PMC - PubMed
    1. Rasmussen R.N., Asiminas A., Carlsen E.M.M., Kjaerby C., Smith N.A. Astrocytes: Integrators of Arousal State and Sensory Context. Trends Neurosci. 2023;46:418–425. doi: 10.1016/j.tins.2023.03.003. - DOI - PMC - PubMed

LinkOut - more resources