. 2025 Jul 20;14(14):1115.
doi: 10.3390/cells14141115.

Integrative Multi-Omics Profiling of Rhabdomyosarcoma Subtypes Reveals Distinct Molecular Pathways and Biomarker Signatures

Affiliations

Integrative Multi-Omics Profiling of Rhabdomyosarcoma Subtypes Reveals Distinct Molecular Pathways and Biomarker Signatures

Aya Osama et al. Cells. .

Abstract

Rhabdomyosarcoma (RMS), the most common pediatric soft tissue sarcoma, comprises embryonal (ERMS) and alveolar (ARMS) subtypes with distinct histopathological features, clinical outcomes, and therapeutic responses. To better characterize their molecular distinctions, we performed untargeted plasma proteomics and metabolomics profiling in children with ERMS (n = 18), ARMS (n = 17), and matched healthy controls (n = 18). Differential expression, functional enrichment (GO, KEGG, RaMP-DB), co-expression network analysis (WGCNA/WMCNA), and multi-omics integration (DIABLO, MOFA) revealed distinct molecular signatures for each subtype. ARMS displayed elevated oncogenic and stemness-associated proteins (e.g., cyclin E1, FAP, myotrophin) and metabolites involved in lipid transport, fatty acid metabolism, and polyamine biosynthesis. In contrast, ERMS was enriched in immune-related and myogenic proteins (e.g., myosin-9, SAA2, S100A11) and metabolites linked to glutamate/glycine metabolism and redox homeostasis. Pathway analyses highlighted subtype-specific activation of PI3K-Akt and Hippo signaling in ARMS and immune and coagulation pathways in ERMS. Additionally, the proteomics and metabolomics datasets showed association with clinical parameters, including disease stage, lymph node involvement, and age, demonstrating clear molecular discrimination consistent with clinical observation. Co-expression networks and integrative analyses further reinforced these distinctions, uncovering coordinated protein-metabolite modules. Our findings reveal novel, subtype-specific molecular programs in RMS and propose candidate biomarkers and pathways that may guide precision diagnostics and therapeutic targeting in pediatric sarcomas.

Keywords: alveolar RMS (ARMS); embryonal RMS (ERMS); metabolomics; multi-omics integration; proteomics; rhabdomyosarcoma.


Conflict of interest statement

The authors declare no conflicts of interest.

Figures

Figure 1
Figure 1
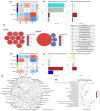
Comprehensive single-omics analysis of untargeted metabolomics and proteomics in RMS patients and controls. (a) A 3D scatter plot illustrating clustering of the three groups: embryonal RMS (green), alveolar RMS (red), and control (blue). (b) Venn diagram of identified proteins highlighting unique and shared proteins among ERMS, ARMS, and control groups. (c) Venn diagram of identified metabolites showing unique and shared metabolites across the three groups. (d) Volcano plot representing differentially expressed proteins (DEPs) between ERMS and control samples, with significant proteins indicated in red. (e) Volcano plot of DEPs between ARMS and control samples, highlighting significant proteins in red. (f) Volcano plot of differentially expressed metabolites (DEMs) between ERMS and control groups, with significant metabolites shown in red. (g) Volcano plot of DEMs between ARMS and control groups, with significant metabolites indicated in red.
Figure 2
Figure 2
Descriptive and enrichment analysis for identified proteins and metabolites. (a) Bar plot of enriched biological processes derived from merged data of DEPs and unique proteins identified in ERMS/control and ARMS/control comparisons. (b) Network plot of significantly enriched pathways identified using KEGG database for merged profile of ERMS/control and ARMS/control comparisons with FDR < 0.05. (c) Top 25 significant pathway enrichment analysis using RaMP-DB with FDR < 0.05 for merged metabolite list from ERMS/control and ARMS/control comparisons. (d) UpSet plot showing significant pathways identified from each comparison (ARMS/Control, ERMS/Control, and ARMS/ERMS) and illustrating intersections and unique overlaps.
Figure 3
Figure 3
Co-expression network of identified proteins and metabolites constructed by weighted gene/metabolite co-expression network analysis. (a) Heatmap representing correlation of module eigengenes with phenotypes, illustrating relationships between modules and conditions: normal control (right), ERMS (middle), and ARMS (left). (b) Bar plot depicting module discrimination based on module eigengenes, highlighting the turquoise module’s strong correlation with control samples, the brown module’s strong correlation with ERMS, and the blue module’s strong correlation with ARMS. (c) Bubble chart representing pathway enrichment for the brown (ERMS) and blue (ARMS) modules; bubble color indicates FDR (−log10), bubble size reflects number of genes annotated in each pathway, and letters correspond to pathways listed in the accompanying table. (d) Heatmap illustrating correlation of module eigenmetabolites with groups, displaying relationship between modules and conditions: normal control (right), embryonal RMS (middle), and alveolar RMS (left). (e) Bar plot showing module discrimination by module eigenmetabolites, emphasizing the blue module’s strong correlation with control samples and the brown module’s correlation with ARMS. (f) Network analysis of metabolites identified in the blue module, which is highly correlated with control samples and the arrows shows downregulated metabolites in RMS subgroups. (g) Pathway enrichment analysis of metabolites identified in the brown module (ARMS).
Figure 4
Figure 4
Integrative multi-omics analysis of untargeted proteins and metabolites data. (a) Sample plot of DIABLO model illustrating separation between ERMS (grey), ARMS (blue), and control (orange) groups. (b) Circos plot showing correlated metabolites (green) and proteins (red) selected by DIABLO, with lines representing significant correlations (|r| ≥ 0.7): orange for positive, black for negative. Outer line plots show expression across groups (blue: alveolar, orange: control, gray: embryonal). “Comp 1-2” indicates first two DIABLO components used for integration. (c) DIABLO network analysis of first component, containing 18 proteins (grey circles) and 33 metabolites (green squares). Unique proteins and metabolites identified from single-omics are highlighted in orange; arrows indicate upregulation. Negative correlation edges (49) are marked in red, while positive correlation edges (53) are in blue. (d) Volcano plot of differentially expressed proteins (DEPs) between ARMS and ERMS. (e) Volcano plot of differentially expressed metabolites (DEMs) between ARMS and ERMS. (f) Score plots for six latent factors (LFs) in MOFA. The y-axis represents LF scores for each sample, with colors representing sample groups: green (control), orange (ERMS), and red (ARMS). (g) MOFA network analysis for factor two, containing 20 proteins (green circles) and 23 metabolites (blue squares). Unique proteins and metabolites identified from single-omics are marked with (*); arrows indicate upregulation (orange for ARMS and brown for ERMS). Negative correlation edges (18) are highlighted in red, while positive correlation edges (57) are in blue.

Similar articles

References

    1. Sbaraglia M., Bellan E., Dei Tos A.P. The 2020 WHO classification of soft tissue tumours: News and perspectives. Pathologica. 2021;113:70. doi: 10.32074/1591-951X-213. - DOI - PMC - PubMed
    1. Shern J.F., Yohe M.E., Khan J. Pediatric rhabdomyosarcoma. Crit. Rev. Oncog. 2015;20:227–243. doi: 10.1615/CritRevOncog.2015013800. - DOI - PMC - PubMed
    1. Du X.-H., Wei H., Zhang P., Yao W.-T., Cai Q.-Q. Heterogeneity of soft tissue sarcomas and its implications in targeted therapy. Front. Oncol. 2020;10:564852. doi: 10.3389/fonc.2020.564852. - DOI - PMC - PubMed
    1. Skapek S.X., Ferrari A., Gupta A.A., Lupo P.J., Butler E., Shipley J., Barr F.G., Hawkins D.S. Rhabdomyosarcoma. Nat. Rev. Dis. Primers. 2019;5:1. doi: 10.1038/s41572-018-0051-2. - DOI - PMC - PubMed
    1. Xu N., Yu Y., Duan C., Wei J., Sun W., Jiang C., Jian B., Cao W., Jia L., Ma X. Quantitative proteomics identifies and validates urinary biomarkers of rhabdomyosarcoma in children. Clin. Proteom. 2023;20:10. doi: 10.1186/s12014-023-09401-4. - DOI - PMC - PubMed

Substances

LinkOut - more resources