

Exploratory Metabolomic and Lipidomic Profiling in a Manganese-Exposed Parkinsonism-Affected Population in Northern Italy
- PMID: 40710587
- PMCID: PMC12299838
- DOI: 10.3390/metabo15070487
Exploratory Metabolomic and Lipidomic Profiling in a Manganese-Exposed Parkinsonism-Affected Population in Northern Italy
Abstract
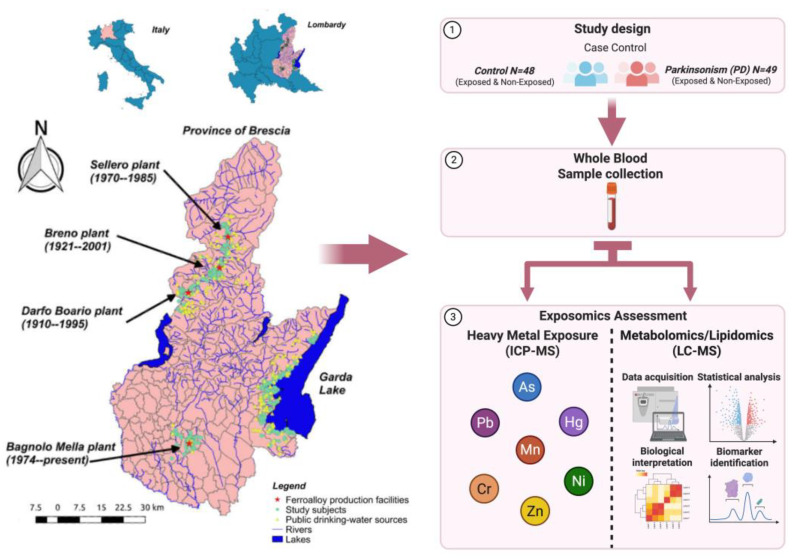
Background/objectives: Chronic manganese (Mn) exposure is a recognized environmental contributor to Parkinsonian syndromes, including Mn-induced Parkinsonism (MnIP). This study aimed to evaluate whole-blood Mn levels and investigate disease/exposure-status-related alterations in metabolomic and lipidomic profiles.
Methods: A case-control study (N = 97) was conducted in Brescia, Italy, stratifying participants by Parkinsonism diagnosis and residential Mn exposure. Whole-blood Mn was quantified using ICP-MS. Untargeted metabolomic and lipidomic profiling was conducted using LC-MS. Statistical analyses included Mann-Whitney U tests, conditional logistic regression, ANCOVA, and pathway analysis.
Results: Whole-blood Mn levels were significantly elevated in Parkinsonism cases vs. controls (median: 1.55 µg/dL [IQR: 0.75] vs. 1.02 µg/dL [IQR: 0.37]; p = 0.001), with Mn associated with increased odds of Parkinsonism (OR = 2.42, 95% CI: 1.13-5.17; p = 0.022). The disease effect metabolites included 3-sulfoxy-L-tyrosine (β = 1.12), formiminoglutamic acid (β = 0.99), and glyoxylic acid (β = 0.83); all FDR p < 0.001. The exposure effect was associated with elevated glycocholic acid (β = 0.51; FDR p = 0.006) and disrupted butanoate (Impact = 0.03; p = 0.004) and glutamate metabolism (p = 0.03). Additionally, SLC-mediated transmembrane transport was enriched (p = 0.003). The interaction effect identified palmitelaidic acid (β = 0.30; FDR p < 0.001), vitamin B6 metabolism (Impact = 0.08; p = 0.03), and glucose homeostasis pathways. In lipidomics, triacylglycerols and phosphatidylethanolamines were associated with the disease effect (e.g., TG(16:0_10:0_18:1), β = 0.79; FDR p < 0.01). Ferroptosis and endocannabinoid signaling were enriched in both disease and interaction effects, while sphingolipid metabolism was specific to the interaction effect.
Conclusions: Mn exposure and Parkinsonism are associated with distinct metabolic and lipidomic perturbations. These findings support the utility of omics in identifying environmentally linked Parkinsonism biomarkers and mechanisms.
Keywords: Parkinsonism; biomonitoring; environmental neurotoxicology; lipidomics; manganese exposure; metabolomics.
Conflict of interest statement
Hari Krishnamurthy is an employee of Vibrant America LLC. The paper reflects the views of the scientists, and not the company. Haiwei Gu serves on the Editorial Board of Metabolites. The remaining authors declare no conflicts of interest. The funders had no role in the design of the study; in the collection, analyses, or interpretation of data; in the writing of the manuscript; or in the decision to publish the results.
Figures


Similar articles
-
Metabolomic and Lipidomic Analysis of Manganese-Associated Parkinsonism: a Case-Control Study in Brescia, Italy.medRxiv [Preprint]. 2024 Sep 6:2024.09.04.24313002. doi: 10.1101/2024.09.04.24313002. medRxiv. 2024. PMID: 39281765 Free PMC article. Preprint.
-
Plasma metabolites associated with endometriosis in adolescents and young adults.Hum Reprod. 2025 May 1;40(5):843-854. doi: 10.1093/humrep/deaf040. Hum Reprod. 2025. PMID: 40107296
-
Metabolome-wide association identifies altered metabolites and metabolic pathways in the serum of patients with cholangiocarcinoma.JHEP Rep. 2024 Mar 18;6(6):101068. doi: 10.1016/j.jhepr.2024.101068. eCollection 2024 Jun. JHEP Rep. 2024. PMID: 38882601 Free PMC article.
-
Plasma and cerebrospinal fluid amyloid beta for the diagnosis of Alzheimer's disease dementia and other dementias in people with mild cognitive impairment (MCI).Cochrane Database Syst Rev. 2014 Jun 10;2014(6):CD008782. doi: 10.1002/14651858.CD008782.pub4. Cochrane Database Syst Rev. 2014. PMID: 24913723 Free PMC article.
-
Antiretroviral post-exposure prophylaxis (PEP) for occupational HIV exposure.Cochrane Database Syst Rev. 2007 Jan 24;2007(1):CD002835. doi: 10.1002/14651858.CD002835.pub3. Cochrane Database Syst Rev. 2007. PMID: 17253483 Free PMC article.
References
-
- Abdelzaher H., Tawfik S.M., Nour A., Abdelkader S., Elbalkiny S.T., Abdelkader M., Abbas W.A., Abdelnaser A. Climate change, human health, and the exposome: Utilizing OMIC technologies to navigate an era of uncertainty. Front. Public Health. 2022;10:973000. doi: 10.3389/fpubh.2022.973000. - DOI - PMC - PubMed
-
- EPA . The Fourth Unregulated Contaminant Monitoring Rule (UCMR 4): Data Summary. Office of Water (MS-140); Washington, DC, USA: 2022.
-
- GOC . Water and Air Quality Bureau, Healthy Environments and Consumer Safety Branch, Health Canada; Ottawa, ON, Canada: 2019. Guidelines for Canadian Drinking Water Quality: Guideline Technical Document—Manganese.
Grants and funding
LinkOut - more resources
Full Text Sources
Miscellaneous
