

Associations Between Uraemic Toxins and Gut Microbiota in Adults Initiating Peritoneal Dialysis
- PMID: 40711145
- PMCID: PMC12300580
- DOI: 10.3390/toxins17070334
Associations Between Uraemic Toxins and Gut Microbiota in Adults Initiating Peritoneal Dialysis
Abstract
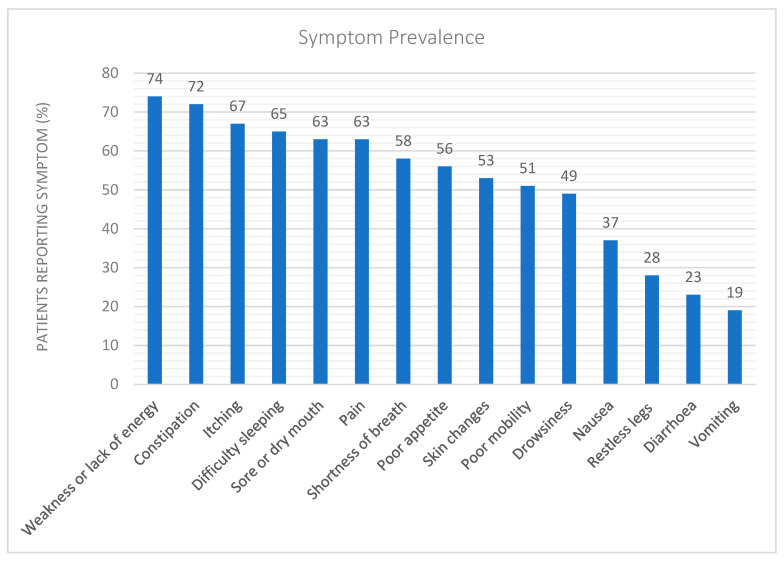
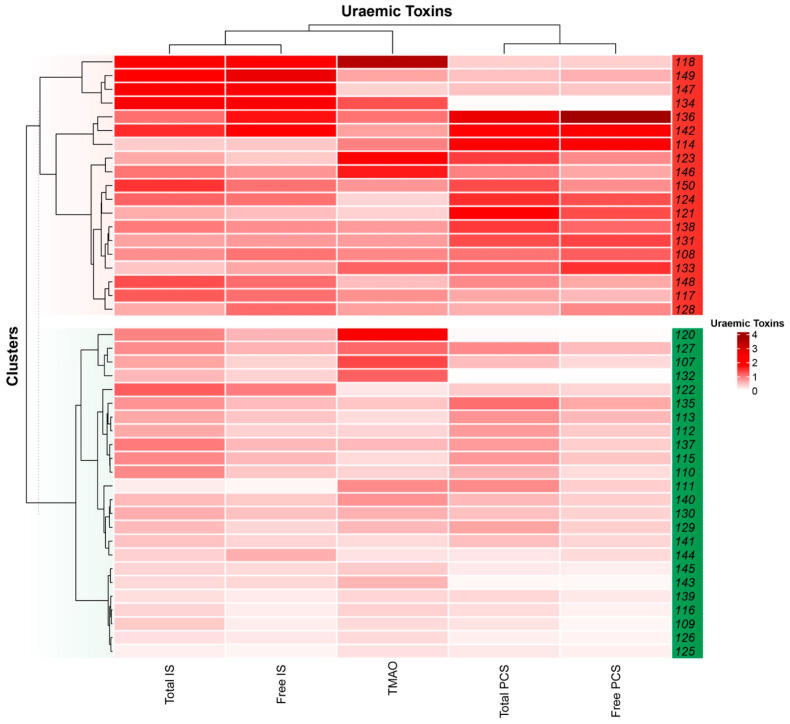
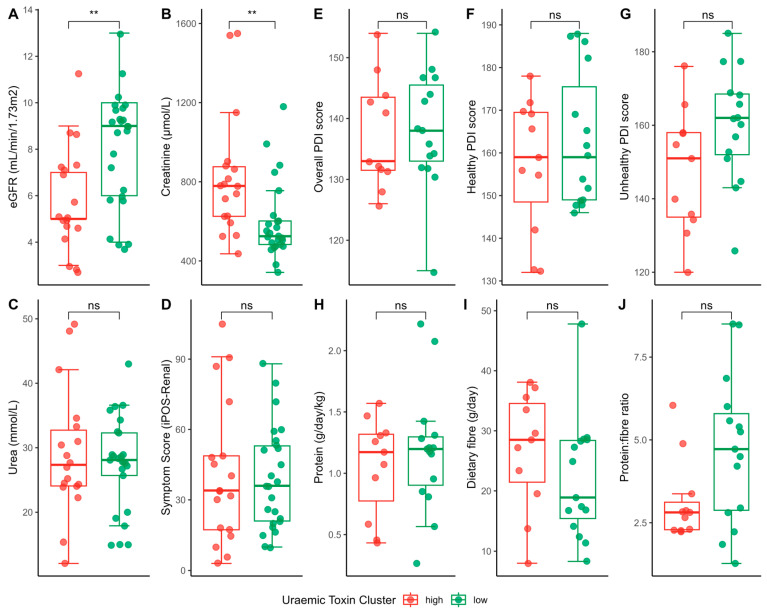
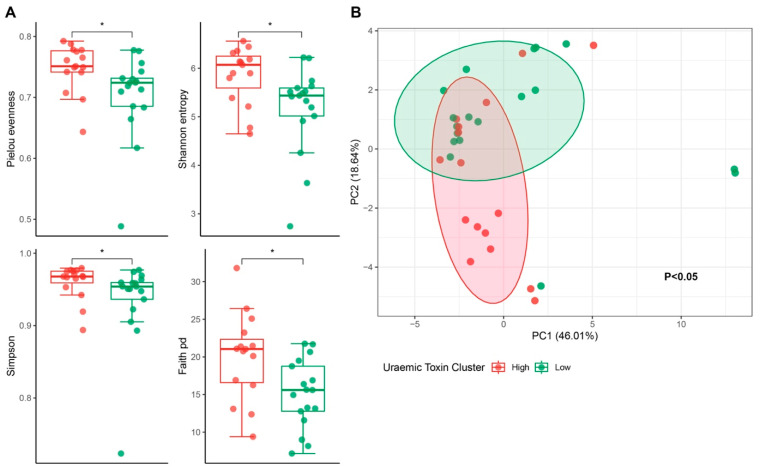
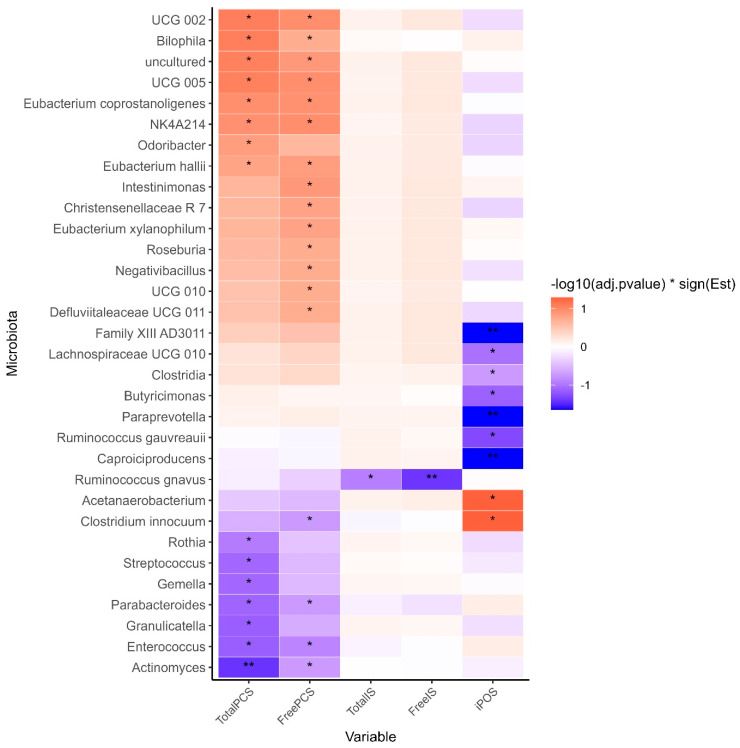
Declining kidney function contributes to the accumulation of uraemic toxins produced by gut microbiota, leading to the uraemic syndrome. This study aimed to identify associations between uraemic toxins, diet quality, symptoms and the gut microbiota in individuals initiating peritoneal dialysis. A cross-sectional analysis of baseline data from participants in a longitudinal study was conducted. Symptom scores using the Integrated Palliative Care Outcomes Scale-Renal were recorded. Plasma p-Cresyl sulfate, indoxyl sulfate and trimethylamine N-oxide were measured using liquid chromatography-mass spectrometry. Gut microbiota was determined using 16S rRNA sequencing. Multivariate linear models examined associations across the cohort. Data from 43 participants (mean age 61 ± 13 years; 70% male; median eGFR 7 mL/min/1.73 m2) were analysed. Diabetes was the primary cause of kidney disease (51.2%). Patients were classified into 'high' (n = 18) and 'low' (n = 26) uraemic toxin groups using K-means clustering. The 'high' group had a lower eGFR (p < 0.05) but no differences in diet quality or symptom scores. Significant differences in alpha and beta diversity were observed between the groups (p = 0.01). The 'high' group had increased Catenibacterium, Prevotella, Clostridia, and decreased Ruminococcus gnavus abundances. Multivariate models identified 32 genera associated with uraemic toxins, including positive associations of Oscillospiraceae UCG-002 and UCG-005 with p-cresyl sulfate, and negative associations with Actinomyces and Enterococcus. Patients with kidney failure initiating peritoneal dialysis have distinct uraemic toxin profiles, associated with differences in microbial diversity. This phenotype was also associated with differences in residual kidney function but not with diet or symptom severity. Longitudinal studies are required to determine causality and guide therapeutic interventions.
Keywords: chronic kidney disease; diet therapy; gut microbiome; kidney failure; peritoneal dialysis; uraemic toxin.
Conflict of interest statement
The authors declare no conflicts of interest.
Figures
Similar articles
-
Synbiotics, prebiotics and probiotics for people with chronic kidney disease.Cochrane Database Syst Rev. 2023 Oct 23;10(10):CD013631. doi: 10.1002/14651858.CD013631.pub2. Cochrane Database Syst Rev. 2023. PMID: 37870148 Free PMC article.
-
The Impact of a 10-Month Synbiotic Intake on eGFR, Uremic Toxins, Oxidative Stress, and Inflammatory Markers in Non-Dialysis Chronic Kidney Disease Patients: A Prospective, Non-Randomized, Placebo-Controlled Study.Medicina (Kaunas). 2025 Jun 30;61(7):1199. doi: 10.3390/medicina61071199. Medicina (Kaunas). 2025. PMID: 40731829 Free PMC article.
-
GUT-DERIVED UREMIC TOXICITY IN LIONS (PANTHERA LEO) WITH CHRONIC KIDNEY DISEASE: A POTENTIAL THERAPEUTIC TARGET?J Zoo Wildl Med. 2025 Jun;56(2):258-271. doi: 10.1638/2024-0094. J Zoo Wildl Med. 2025. PMID: 40638166
-
Investigation of a targeted panel of gut microbiome-derived toxins in children with chronic kidney disease.Pediatr Nephrol. 2025 May;40(5):1759-1770. doi: 10.1007/s00467-024-06580-6. Epub 2025 Jan 16. Pediatr Nephrol. 2025. PMID: 39820505
-
Impact of Gut Microbiome Modulation on Uremic Toxin Reduction in Chronic Kidney Disease: A Systematic Review and Network Meta-Analysis.Nutrients. 2025 Apr 3;17(7):1247. doi: 10.3390/nu17071247. Nutrients. 2025. PMID: 40219004 Free PMC article.
References
-
- Corradi V., Caprara C., Barzon E., Mattarollo C., Zanetti F., Ferrari F., Husain-Syed F., Giavarina D., Ronco C., Zanella M. A possible role of P-Cresyl Sulfate and Indoxyl Sulfate as biomarkers in the prediction of renal function according to the GFR (G) categories. Integr. Med. Nephrol. Androl. 2024;11:e24-00002. doi: 10.1097/IMNA-D-24-00002. - DOI
MeSH terms
Substances
LinkOut - more resources
Full Text Sources
Research Materials
Miscellaneous
