. 2025 Aug 26;44(8):116054.
doi: 10.1016/j.celrep.2025.116054. Epub 2025 Jul 24.

Epicutaneous Staphylococcus aureus initiates cross-tissue IL-36R signaling for neutrophilic lung inflammation in a model of the atopic march

Affiliations

Epicutaneous Staphylococcus aureus initiates cross-tissue IL-36R signaling for neutrophilic lung inflammation in a model of the atopic march

Sabrina N Kline et al. Cell Rep. .

Abstract

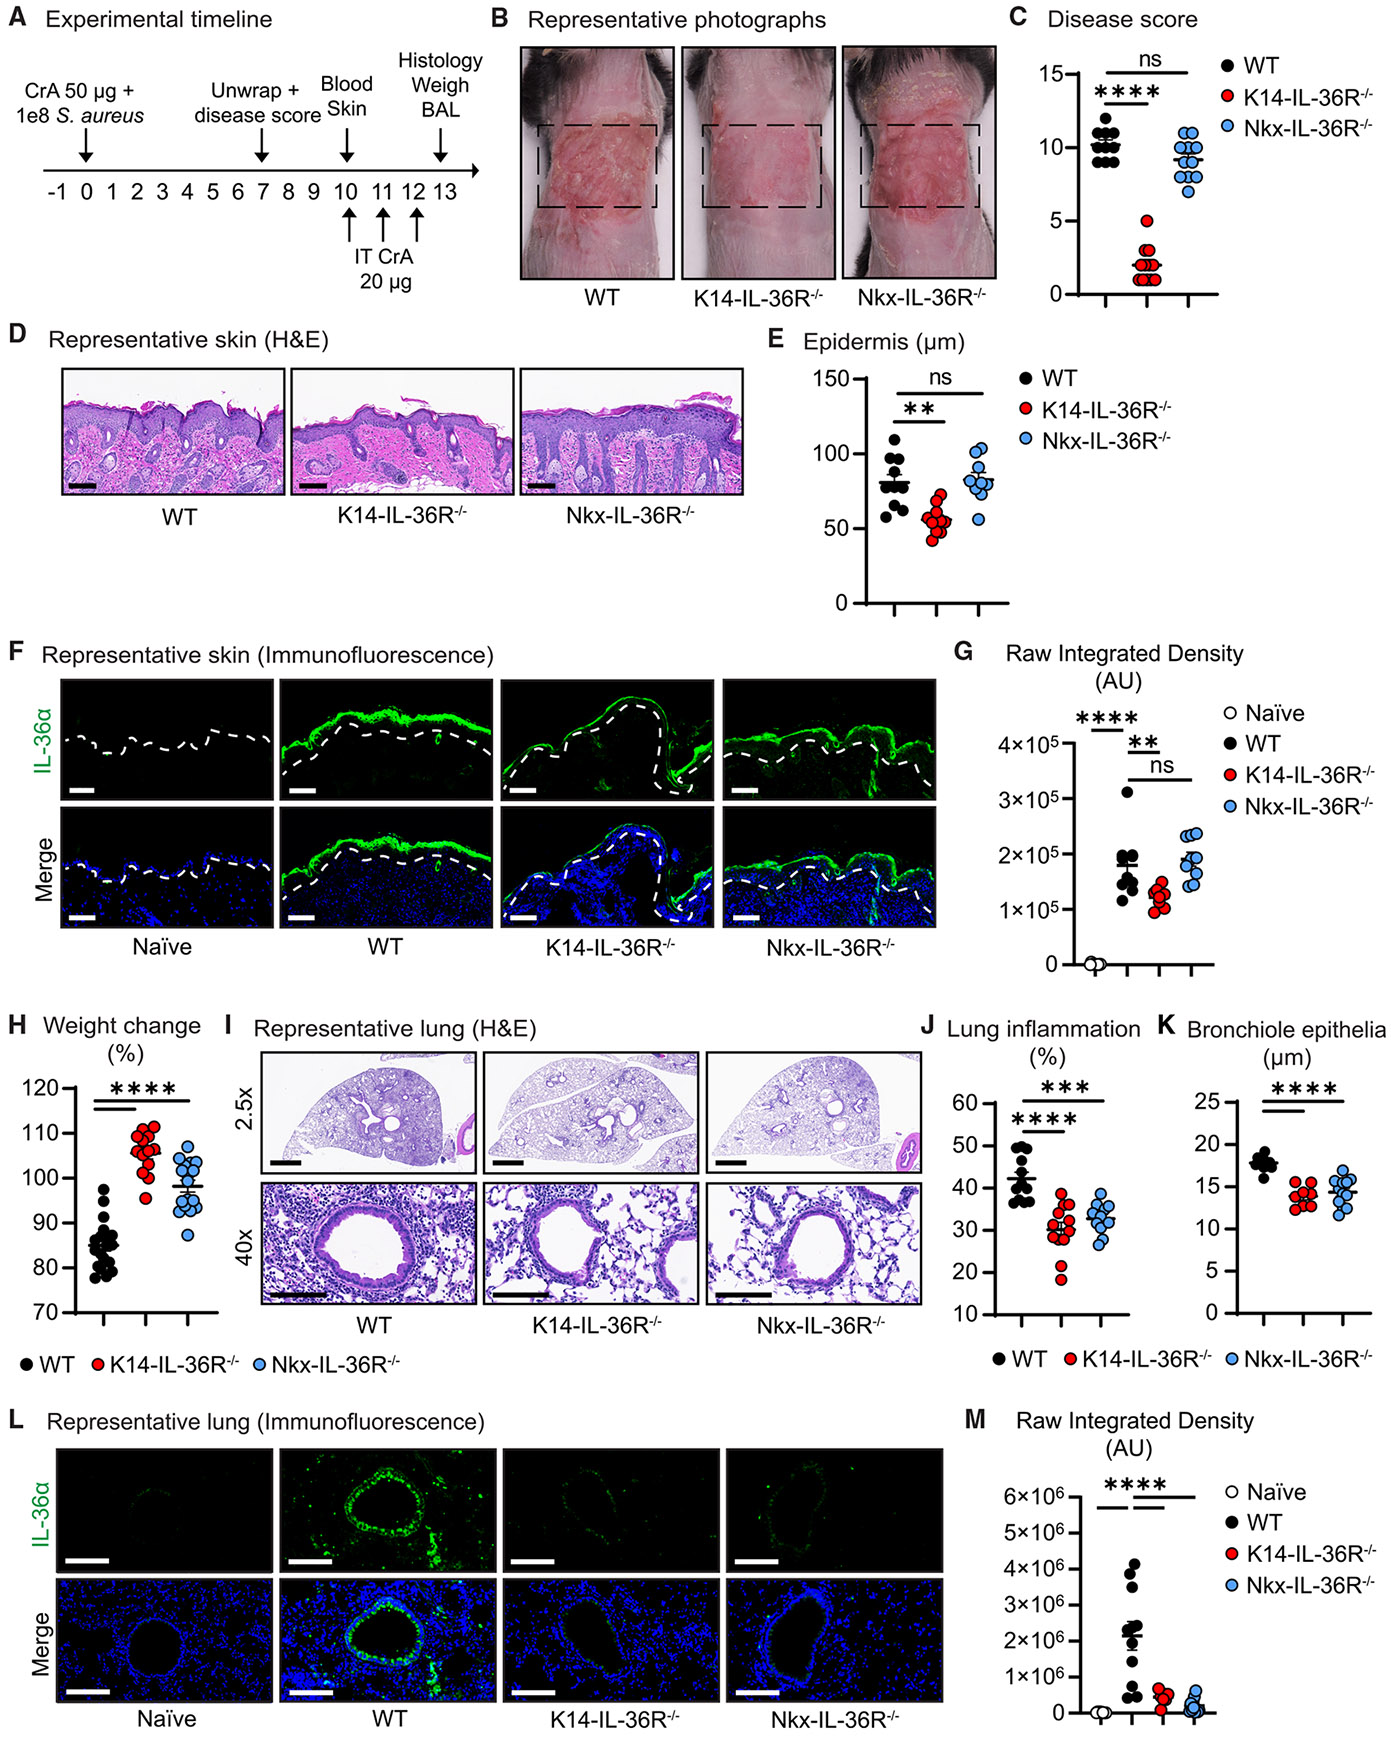
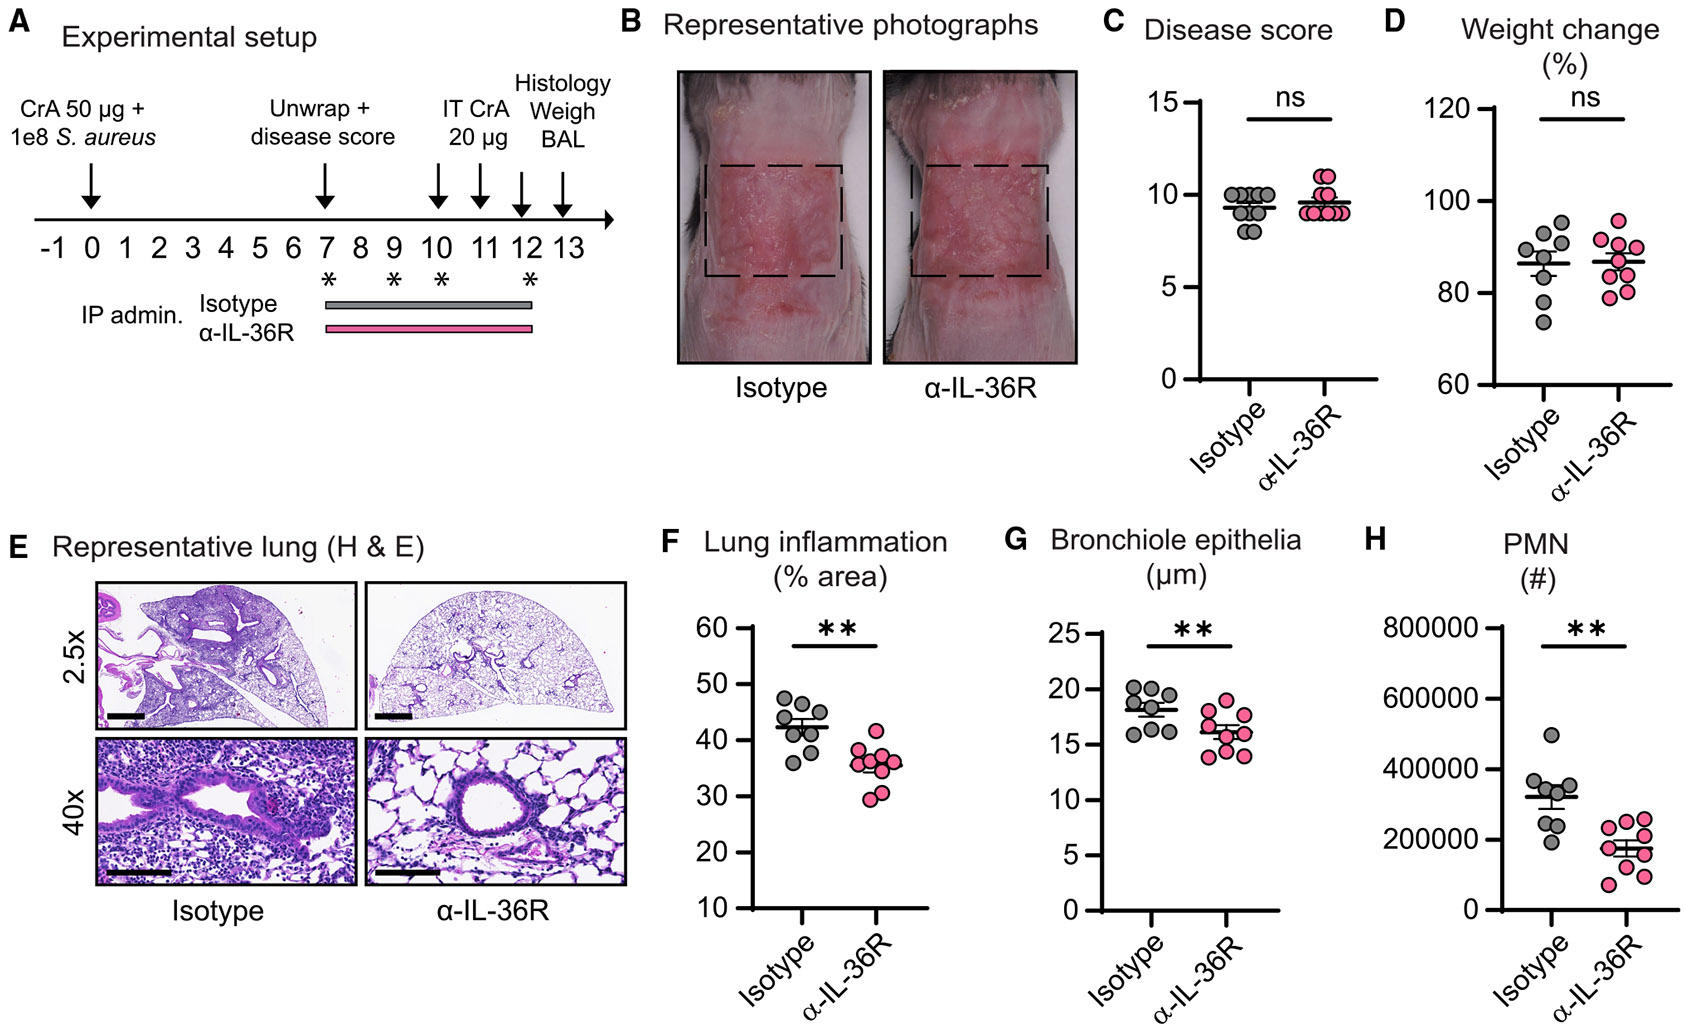
Patients with atopic dermatitis exhibit abundant Staphylococcus aureus skin colonization and an increased risk of atopic march diseases, including allergic rhinitis, food allergies, and asthma. We have previously shown that S. aureus skin exposure exacerbates allergic lung inflammation in an interleukin-36 receptor (IL-36R)-dependent manner. However, the cellular and molecular mechanisms by which S. aureus skin exposure and IL-36R signaling orchestrate the progression from skin to lung inflammation are unclear. Using a preclinical model of the atopic march, we found that S. aureus skin exposure promoted robust neutrophilic lung inflammation via keratinocyte- and lung epithelia-specific IL-36R signaling. Unexpectedly, neutrophil IL-36R signaling triggered neutrophil extracellular trap (NET) formation and augmented lung pathology. Importantly, anti-IL-36R monoclonal antibody (mAb) treatment prevented the development of neutrophilic lung inflammation. Collectively, our findings suggested that S. aureus skin exposure exacerbates lung inflammation via distinct IL-36R signaling mechanisms on epithelia and neutrophils, which has therapeutic potential in halting the progression of the atopic march.

Keywords: CP: Immunology; CP: Microbiology; IL-36; NETs; Staphylococcus aureus; atopic dermatitis; atopic march; immunotherapeutic; inflammation; lung; neutrophilic asthma; skin.


Conflict of interest statement

Declaration of interests N.K.A. has received previous grant support from Pfizer and Boehringer Ingelheim and was a paid consultant for Janssen Pharmaceuticals and Alphyn Biologics.

Figures

Figure 1.
Figure 1.. Epicutaneous S. aureus induces systemic immune responses
WT and IL-36R−/− mice dorsal skin was naive or e.c. exposed to S. aureus (1 × 10⁸ CFU) for 7 days. Photographs and disease score were taken on day 7, and skin biopsies (10 mm), and lungs were harvested on day 10 (n ≥ 9 per group). (A) Representative skin photographs. (B) Mean disease score (±SEM). (C) Representative lung and bronchiole histology (H&E, scale bars: 1 mm and 100 μm). (D) Lung inflammation (%) ±SEM from lung sections as measured by ImageJ software analysis as the percentage of the density of H&E staining. (E) Mean bronchiole epidermal thickness (±SEM). (F) GO biological process enrichment pathway analysis of RNA-seq from day 10 naive and e.c.-exposed (WT) lungs (n = 5 per group). resp, responses; reg., regulation; pos., positive; leuk., leukocyte; migr., migration; sig., signaling. (G) Mean number of lung PMNs, monocytes, and eosinophils (±SEM) in day 10 lungs as measured by fluorescence-activated cell sorting (FACS). ns, not significant; **p < 0.01, ***p < 0.001, and ****p < 0.0001 as calculated by a two-tailed Student’s t test (B, D, and E) or one-way ANOVA multiple comparisons test with Tukey correction (G). Results are combined from at least 2 independent experiments. See also Figure S1.
Figure 2.
Figure 2.. Skin and lung epithelial IL-36R signaling contributes to the progression of the atopic march
WT naive (day 0) or WT, K14-IL-36R−/−, and Nkx-IL-36R−/− mice were e.c. exposed to S. aureus + CrA for 7 days, followed by i.t. CrA administration on days 10–12. Photographs and disease score were taken on day 7, skin biopsies (10 mm) were harvested on day 10, and BAL and lungs were harvested on day 13 (n ≥ 8 per group). (A) Timeline of the atopic march model. (B) Representative skin photographs. (C) Mean disease score (±SEM). (D) Representative skin histology (H&E stain, scale bar: 100 μm). (E) Mean epidermal thickness (±SEM). (F) Representative skin immunofluorescence for IL-36α (green) and DAPI (blue) (scale bar: 100 μm). Dashed line represents the dermo-epidermal junction. (G) Quantification of epidermal IL-36α expression levels from (F) using the raw integrated density measurement in ImageJ, normalized to the epidermal area. (H) Weight change (%) from day 0 to 13 (±SEM). (I) Representative lung histology (H&E; scale bars: 1 mm and 100 μm). (J) Lung inflammation from histologic sections as measured by ImageJ software analysis as the percentage of the density of H&E staining (±SEM). (K) Mean bronchiole epidermal thickness (±SEM). (L) Representative lung immunofluorescence for IL-36α (green) and DAPI (blue) (scale bar: 100 μm). (M) Quantification of lung IL-36α expression levels from (L) using the raw integrated density measurement in ImageJ, normalized to areas of lung cellularity. ns, not significant; **p < 0.01, ***p < 0.001, and ****p < 0.0001 as calculated by one-way ANOVA multiple comparisons test with Tukey correction (C, E, G, H, J, K, and M). Results are combined from at least 2 independent experiments. See also Figures S2 and S3.
Figure 3.
Figure 3.. Epithelial IL-36R signaling triggers neutrophil-mediated lung inflammation
WT, K14-IL-36R−/−, Nkx-IL-36R−/−, and PMN−/− mice were e.c. exposed to S. aureus + CrA for 7 days, followed by i.t. CrA administration on days 10–12. Blood was collected on day 10, whereas BAL and lungs were harvested on day 13 (n ≥ 6 per group). (A) GO biological process enrichment pathway analysis of RNA-seq from WT naive and day 13 lungs (n = 5 per group). (B) Mean number of BAL PMNs (±SEM) as measured by FACS. (C) Representative lung immunofluorescence for Ly6G (green) and DAPI (blue) on day 13 (scale bar: 100 μm). (D) Quantification of lung tissue Ly6G expression levels (±SEM) from (C) using QuPath. (E) Mean number of blood PMNs/mL (±SEM). (F) Weight change (%) from day 0 to 13 (±SEM). (G) Representative lung histology (H&E, scale bars: 1 mm and 100 μm). (H) Lung inflammation (±SEM) from histologic sections as measured by ImageJ software analysis as the percentage of the density of H&E staining. (I) Mean bronchiole epidermal thickness (±SEM). (J) Mean number of BAL PMNs and monocytes (±SEM) as measured by FACS. ns, not significant; *p < 0.05, **p < 0.01, ***p < 0.001, and ****p < 0.0001 as calculated by one-way ANOVA multiple comparisons test with Tukey correction (B, D, and E) and a two-tailed Student’s t test (F and H–J). Results are combined from at least 2 independent experiments. See also Figures S3-S7.
Figure 4.
Figure 4.. Neutrophil proteases exacerbate lung epithelial thickening
Mice were e.c. exposed to S. aureus + CrA for 7 days, followed by i.t. CrA administration on days 10–12. BAL and lungs were harvested on day 13 (n ≥ 8 per group). In some experiments with WT mice, protease inhibitors or vehicle controls were also administered i.t. on days 10, 11, and 12. (A) Venn diagram of unique and overlapping DEGs from RNA-seq of K14-IL-36R−/− and Nkx-IL-36R−/− lungs compared to WT lungs (n = 5 per group). (B) GO molecular function enrichment pathway analysis of overlapping DEGs from (A). inhib., inhibitor; act., activity. (C) Timeline of the atopic march model using WT mice with administration of protease inhibitors. (D) Weight change (%) from day 0 to 13 (±SEM). (E) Representative lung histology (H&E, scale bars: 1 mm and 100 μm). (F) Lung inflammation (±SEM) from histologic sections as measured by ImageJ software analysis as the percentage of the density of H&E staining. (G) Mean bronchiole epidermal thickness (±SEM). (H) Mean number of BAL PMNs (±SEM) as measured by FACS. (I–M) WT and NSP−/− mice were e.c. exposed to S. aureus + CrA for 7 days, followed by i.t. CrA administration on days 10–12. BAL and lungs were harvested on day 13 (n ≥ 8 per group). (I) Weight change (%) from day 0 to 13 (±SEM). (J) Representative lung histology (H&E, scale bars: 1 mm and 100 μm). (K) Lung inflammation (±SEM) from histologic sections as measured by ImageJ software analysis as the percentage of the density of H&E staining. (L) Mean bronchiole epidermal thickness (±SEM). (M) Mean number of BAL PMNs (±SEM) as measured by FACS. ns, not significant; *p < 0.05, ***p < 0.001, and ****p < 0.0001 as calculated by a two-tailed Student’s t test (D, F–I, and K–M). Results are combined from at least 2 independent experiments. See also Figure S4.
Figure 5.
Figure 5.. Neutrophil-intrinsic IL-36R signaling triggers NETosis and promotes lung inflammation
WT, PAD4−/−, and PMN-IL-36R−/− mice were e.c. exposed to S. aureus + CrA for 7 days, followed by i.t. CrA administration on days 10–12. BAL and lungs were harvested on day 13 (n ≥ 8 per group). (A) Weight change (%) from day 0 to 13 (±SEM). (B) Representative lung histology (H&E, scale bars: 1 mm and 100 μm). (C) Lung inflammation (±SEM) from histologic sections as measured by ImageJ software analysis as the percentage of the density of H&E staining. (D) Mean bronchiole epidermal thickness (±SEM). (E) Mean number of BAL PMNs (±SEM) as measured by FACS. (F) Weight change (%) from day 0 to 13 (±SEM). (G) Representative lung histology (H&E, scale bars: 1 mm and 100 μm). (H) Lung inflammation (±SEM) from histologic sections as measured by ImageJ software analysis as the percentage of the density of H&E staining. (I) Mean bronchiole epidermal thickness (±SEM). (J) Mean number of BAL PMNs (±SEM) as measured by FACS. (K) Representative lung immunofluorescence for Ly6G (red), H3-Cit (green), and DAPI (blue) (scale bar: 100 μm). (L) Quantification of NETs based on the percentage of area of H3-Cit in QuPath using images from (K). ns, not significant; *p < 0.05, **p < 0.01, and ****p < 0.0001 as calculated by a two-tailed Student’s t test (A, C–F, H–J, and L). Results are combined from at least 2 independent experiments. See also Figures S4, S8, and S9.
Figure 6.
Figure 6.. An anti-IL-36R neutralizing antibody has efficacy against lung inflammation
WT mice were e.c. exposed to S. aureus + CrA for 7 days, followed by i.t. CrA administration on days 10–12. An anti-IL-36R neutralizing antibody or isotype control were administered on days 7, 9, 10, and 12. BAL and lungs were harvested on day 13 (n = 8 per group). (A) Timeline of the atopic march model and antibody administration. (B) Representative skin photographs. (C) Mean disease score ±SEM. (D) Weight change (%) from day 0 to 13 (±SEM). (E) Representative lung histology (H&E, scale bars: 1 mm and 100 μm). (F) Lung inflammation (±SEM) from histologic sections as measured by ImageJ software analysis as the percentage of the density of H&E staining. (G) Mean bronchiole epidermal thickness (±SEM). (H) Mean number of BAL PMNs (±SEM) as measured by FACS. ns, not significant; **p < 0.01 as calculated by a two-tailed Student’s t test. Results are combined from at least 2 independent experiments.

References

    1. Barbarot S, Auziere S, Gadkari A, Girolomoni G, Puig L, Simpson EL, Margolis DJ, de Bruin-Weller M, and Eckert L (2018). Epidemiology of atopic dermatitis in adults: Results from an international survey. Allergy 73, 1284–1293. - PubMed
    1. Weidinger S, Beck LA, Bieber T, Kabashima K, and Irvine AD (2018). Atopic dermatitis. Nat. Rev. Dis. Primers 4, 1–z. - PubMed
    1. Langan SM, Irvine AD, and Weidinger S (2020). Atopic dermatitis. Lancet 396, 345–360. - PubMed
    1. Bieber T. (2022). Atopic dermatitis: an expanding therapeutic pipeline for a complex disease. Nat. Rev. Drug Discov 21, 21–40. - PMC - PubMed
    1. Hulpusch C, Weins AB, Traidl-Hoffmann C, and Reiger M (2021). A new era of atopic eczema research: Advances and highlights. Allergy 76, 3408–3421. - PubMed

MeSH terms

Substances

LinkOut - more resources