. 2025 Jul 25;11(30):eadv4238.
doi: 10.1126/sciadv.adv4238. Epub 2025 Jul 25.

Genetically engineered chondrocyte-mimetic nanoplatform attenuates osteoarthritis by blocking IL-1β and restoring sirtuin-3

Affiliations

Genetically engineered chondrocyte-mimetic nanoplatform attenuates osteoarthritis by blocking IL-1β and restoring sirtuin-3

Caifeng Deng et al. Sci Adv. .

Abstract

Osteoarthritis (OA) is a multifactorial disease characterized by joint inflammation and cartilage degeneration, with no disease-modifying drugs available. The vicious cycle between the inflammatory microenvironment (inflamed soil) and dysfunctional chondrocytes (degeneration-related seeds) drives the chronic progressive deterioration of OA. Here, we report a genetically engineered chondrocyte-mimetic nanoplatform (termed HKL-GECM@MPNPs) comprising a honokiol (HKL)-loaded mitochondrion-targeting nanoparticle core coated with an interleukin-1 receptor type 2 (IL-1R2)-overexpressing chondrocyte membrane. HKL-GECM@MPNPs fuse with OA chondrocytes, transferring IL-1R2 onto the plasma membrane and reprogramming the inflamed microenvironment through IL-1β blockade. Mitochondrion-targeting cores then directly deliver HKL to restore mitochondrial sirtuin-3 in OA chondrocytes, reprogramming the cells' pathological phenotype. Intra-articular injection of HKL-GECM@MPNPs in OA mice reduces inflammation, alleviates joint pain, and mitigates cartilage damage through a synergistic effect. Moreover, HKL-GECM@MPNPs effectively reverse cartilage degeneration in human OA cartilage explants. This approach highlights the potential of HKL-GECM@MPNPs to combine IL-1β blockade and mitochondrial sirtuin-3 restoration as a promising strategy for OA treatment.


Figures

Fig. 1.
Fig. 1.. Schematic illustration of the genetically engineered chondrocyte-mimetic HKL-GECM@MPNPs attenuating OA cartilage degeneration.
HKL-GECM@MPNPs transfer IL-1R2 onto the plasma membrane of OA chondrocytes through membrane fusion, and then core HKL-MPNPs released into the cytoplasm directly target mitochondria, resulting in the synergism of IL-1β blockade and mitochondrial SIRT3 restoration. Created in BioRender. L.Y. (2025); https://biorender.com/nicpxys.
Fig. 2.
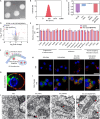
Fig. 2.. The efficient transfer of IL-1R2 from genetically engineered vesicles to the OA chondrocyte plasma membrane blocks IL-1β.
(A) Schematic diagram of nongenetic membrane engineering mediated by vesicle-plasma membrane fusion in situ. Created in BioRender. L.Y. (2025); https://biorender.com/nicpxys. (B) Representative TEM images of GECM with phosphotungstic acid negative staining (n = 3). Scale bar, 100 nm. (C) Size distribution of GECM vesicles detected by dynamic light scattering. (D) Western blotting analysis of IL-1R2-FLAG-tag and Na+/K+-ATPase in the chondrocyte membrane after transfection with IL-1R2–encoding adenoviral vectors (i.e., GECM) or negative control vectors (i.e., CM) for 4 days. The isolation of GECM vesicles and Western blotting were independently repeated three times. (E) Protein index of IL-1R2 protein on GECM vesicles compared with CM vesicles by proteomic analysis (n = 3, means ± SD). (F) Relative protein indices of critical protein markers related to inflammation suppression, adhesion, vesicle targeting, and membrane fusion on the GECM vesicles compared with CM vesicles (n = 3, means ± SD). (G) Representative immunofluorescence images showing the presence of IL-1R2 on the plasma membrane of OA chondrocytes after incubation with GECM vesicles for 4 hours rather than CM vesicles (n = 3). Scale bars, 10 μm. (H) Evaluation of the binding efficiency to IL-1β by measuring the residual concentration of IL-1β in the culture medium of GECM-treated OA chondrocytes or CM-treated OA chondrocytes for 2 hours at 37°C (n = 3, means ± SD). Statistical significance was analyzed by unpaired Student’s two-sided t test or one-way analysis of variance (ANOVA). *P < 0.05, ***P < 0.001, and ****P < 0.0001.
Fig. 3.
Fig. 3.. IL-1R2–engineered HKL-GECM@MPNPs sequentially and spatially target the OA chondrocyte plasma membrane and mitochondria.
(A and B) Representative TEM images (A) and size distribution (B) of IL-1R2–engineered HKL-GECM@MPNPs (n = 3). Scale bar, 50 nm. (C) Zeta potential of GECM, HKL-PNPs, HKL-MPNPs, and HKL-GECM@MPNPs (n = 3, means ± SD). (D) Volcano plot of differential proteins between GECM vesicles and HKL-GECM@MPNPs analyzed by four-dimensional proteomics analysis (n = 3). (E) Relative protein expression indices of critical protein markers related to inflammation suppression, adhesion, vesicle targeting, and membrane fusion on the HKL-GECM@MPNPs compared with GECM vesicles (n = 3, means ± SD). (F) Schematic diagram displaying the process of DiD-labeled GECM@MPNPs internalization by OA chondrocytes. Created in BioRender. L.Y. (2025); https://biorender.com/nicpxys. (G) Representative fluorescence images of DiI-labeled GECM@MPNPs internalized by OA chondrocytes. The red signal represents DiI-labeled GECM, and the green signal represents the chondrocyte membrane labeled with DiO. Scale bar, 10 μm. (H) Representative confocal images indicating the cellular uptake of DiD-loaded nanoparticles by OA chondrocytes (n = 3). Scale bar, 20 μm. (I) Representative fluorescence images showing the colocalization of DiD-loaded nanocores with mitochondria in OA chondrocytes after internalization (n = 3). Scale bar, 10 μm. (J) Representative TEM images indicating the distribution of nanoparticles (red arrow) within mitochondria (n = 3). Scale bar, 500 nm.
Fig. 4.
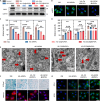
Fig. 4.. HKL-GECM@MPNPs reprogram the phenotype of OA chondrocytes by synergistic cytokine blockade and mitochondrial SIRT3 restoration.
(A) Protein expression levels of SIRT3 in IL-1β–stimulated OA chondrocytes with different treatments. (B) mtROS level in IL-1β–stimulated OA chondrocytes with different treatments for 24 hours (n = 3). Scale bar, 20 μm. (C) IL-1β, IL-6, and TNF-α levels in the cell culture supernatant of IL-1β–stimulated OA chondrocytes with different treatments for 24 hours were measured by ELISA (n = 3, means ± SD). ns, not significant. (D) Assessment of mitochondrial respiratory intensity by measuring relative ATP concentrations, OCR as an indicator of oxidative phosphorylation, and ECAR as an indicator of glycolysis in IL-1β–stimulated OA chondrocytes upon different treatments for 72 hours. All data were standardized to the control group (n = 5, means ± SD). (E) Representative TEM images of the mitochondrial morphology in IL-1β–stimulated OA chondrocytes incubated with different formulations for 24 hours (n = 3). Red arrowheads indicated the mitochondria. Scale bars, 1 μm. (F and G) SA-β-gal staining of OA chondrocytes treated with different formulations (n = 3). Scale bars, 20 μm. Representative fluorescence images showing proteins levels of COLII, ACAN, and MMP13 in IL-1β–stimulated OA chondrocytes upon different treatments for 24 hours (n = 3). Scale bar, 20 μm. The HKL-equivalent concentration of nanoparticles across all subgroups in the (A) to (G) diagram was maintained at 5 μM. Statistical significance was analyzed by one-way ANOVA. *P < 0.05, **P < 0.01, ***P < 0.001, and ****P < 0.0001.
Fig. 5.
Fig. 5.. Intrinsic mechanisms of HKL-GECM@MPNPs acting on the chondrocyte phenotype.
(A) Schematic diagram of IL-1β–stimulated OA chondrocytes treated with 5 μM HKL solution or HKL-GECM@MPNPs (at an equivalent HKL concentration of 5 μM) by RNA sequencing analysis (n = 3). Created in BioRender. L.Y. (2025); https://biorender.com/nicpxys. (B) Volcano plot of the differentially expressed genes (DEGs) in IL-1β–stimulated OA chondrocytes after incubation with HKL-GECM@MPNPs for 24 hours compared to HKL solution (fold change ≥2 and P ≤ 0.05). (C) Heatmap of the DEGs in OA chondrocytes with different treatments for 24 hours. The color indicates the fold change for each variable (red for up-regulation of gene expression and blue for down-regulation of gene expression). (D) Venn graph of the comparison in DEGs after different treatments. (E) KEGG enrichment analysis of DEGs in HKL solution–treated OA chondrocytes and HKL-GECM@MPNPs–treated OA chondrocytes. The signaling pathways enriched in DEGs involve inflammatory factors, chemokines, and mitochondrion-related signaling pathways (ranked by enrichment score). (F) GSEA revealed differential enrichment in IL-1β response, NF-κB signaling, and tricarboxylic acid (TCA) cycle–related gene sets between HKL-GECM@MPNPs– and HKL solution–treated OA chondrocytes. ES, enrichment score; NES, normalized enrichment score.
Fig. 6.
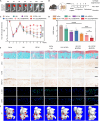
Fig. 6.. The IA injection of HKL-GECM@MPNPs effectively delays the progression of OA in the DMM mouse model.
(A) In vivo fluorescence images of DMM mouse joint after a single IA injection of DiD-labeled GECM@MPNPs (n = 5 mice per group). d, days. (B) Schematic diagram illustrating the experimental timeline for HKL-GECM@MPNPs treatment with a DMM mouse model. Male C57BL/6J mice subjected to DMM surgery or sham surgery were treated with an IA injection of formulations every 2 weeks for 8 weeks (n = 7 mice per group). The HKL-equivalent concentration of nanoparticles across all subgroups was maintained at 10 μM. Created in BioRender. L.Y. (2025); https://biorender.com/nicpxys. (C) Pain-related behavioral assessment was performed by the paw withdrawal threshold measured by the von Frey apparatus (n = 7, means ± SD). (D) OARSI scores based on medial femoral condyles and the medial tibial plateau to assess cartilage degeneration. The score was evaluated by three professionals under blind conditions based on the S.O. staining of a series of sections (n = 7, means ± SD). (E) Histopathology evaluation of joint represented by S.O. staining of the joint from different groups; representative immunohistochemical images of COLII, ACAN, and MMP13 and immunofluorescence images of IL-1R2 and SIRT3 in articular cartilage from different groups. Scale bars, 50 μm for immunohistochemical and immunofluorescence and 100 μm for S.O. staining. (F) Representative three-dimensional (3D) reconstructed microcomputed tomography images of right knee joints from different groups. Red arrowheads indicated osteophyte formation. Statistical significance was analyzed by one-way ANOVA. *P < 0.05, ***P < 0.001, and ****P < 0.0001.
Fig. 7.
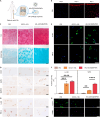
Fig. 7.. HKL-GECM@MPNPs rescue the degeneration in human OA cartilage explants.
(A) Schematic diagram showing the collection and treatment of human OA cartilage explants (n = 3). The HKL-equivalent concentration of treatments across all subgroups was maintained at 5 μM. Created in BioRender. L.Y. (2025); https://biorender.com/nicpxys. (B) Representative confocal images of cross sections of human cartilage explants after incubation with DiD-labeled GECM@MPNPs for 1, 4, and 7 days. Scale bar, 200 μm. (C and D) Representative images of S.O. and alcian blue staining (C) and protein levels of COLII, ACAN, and MMP13 (D) in the human OA cartilage explants after different treatments. Scale bars, 100 μm. (E and F) Representative immunofluorescence images (E) and semiquantitative analysis (F) of IL-1R2 and SIRT3 protein levels in human OA cartilage explants after aforementioned treatments (n = 3, means ± SD). Scale bar, 50 μm. (G and H) Representative immunohistochemical images of TNF-α and IL-1β and fluorescence images of P16INK4A and TUNEL staining related to cell apoptosis in human OA cartilage explants after different treatments. Scale bars, 20 μm for immunohistochemistry and 50 μm for immunofluorescence. Statistical significance was analyzed by one-way ANOVA. **P < 0.01, ***P < 0.001, and ****P < 0.0001.

References

    1. GBD 2021 Forecasting Collaborators , Burden of disease scenarios for 204 countries and territories, 2022-2050: A forecasting analysis for the Global Burden of Disease Study 2021. Lancet 403, 2204–2256 (2024). - PMC - PubMed
    1. Martel-Pelletier J., Barr A. J., Cicuttini F. M., Conaghan P. G., Cooper C., Goldring M. B., Goldring S. R., Jones G., Teichtahl A. J., Pelletier J. P., Osteoarthritis. Nat. Rev. Dis. Primers. 2, 16072 (2016). - PubMed
    1. Brooks P., Inflammation as an important feature of osteoarthritis. Bull. World Health Organ. 81, 689–690 (2003). - PMC - PubMed
    1. Robinson W. H., Lepus C. M., Wang Q., Raghu H., Mao R., Lindstrom T. M., Sokolove J., Low-grade inflammation as a key mediator of the pathogenesis of osteoarthritis. Nat. Rev. Rheumatol. 12, 580–592 (2016). - PMC - PubMed
    1. Liu-Bryan R., Terkeltaub R., Emerging regulators of the inflammatory process in osteoarthritis. Nat. Rev. Rheumatol. 11, 35–44 (2015). - PMC - PubMed

MeSH terms