. 2025 Jul 25;11(30):eadt8775.
doi: 10.1126/sciadv.adt8775. Epub 2025 Jul 25.

Thermoresponsive antioxidant metal-free carbon nanodot hydrogel: An effective therapeutic approach for ocular surface disease

Affiliations

Thermoresponsive antioxidant metal-free carbon nanodot hydrogel: An effective therapeutic approach for ocular surface disease

Mei Yang et al. Sci Adv. .

Abstract

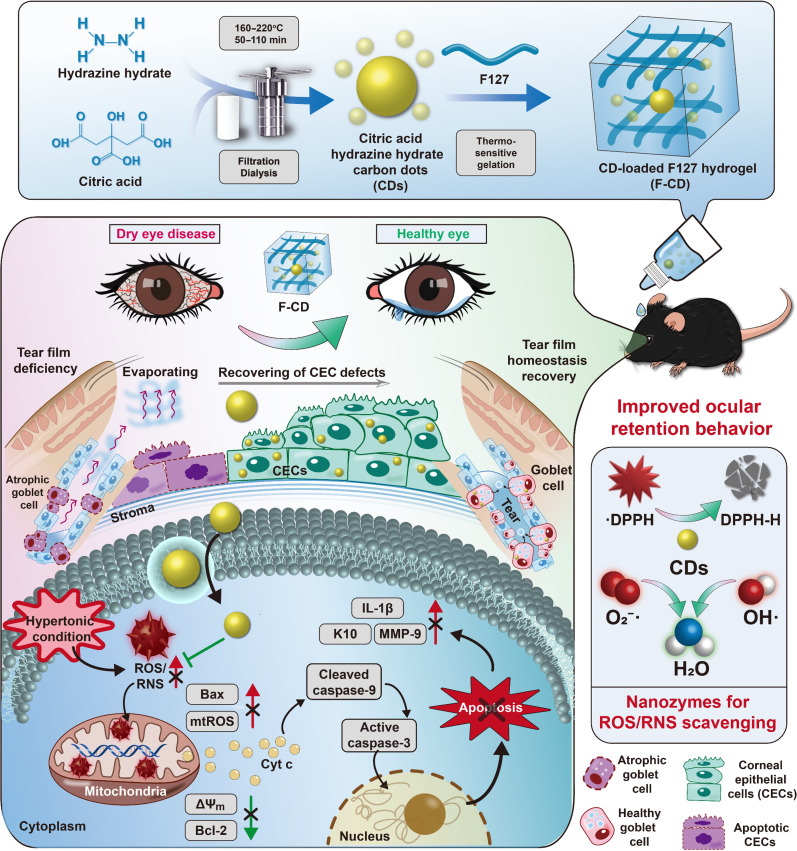
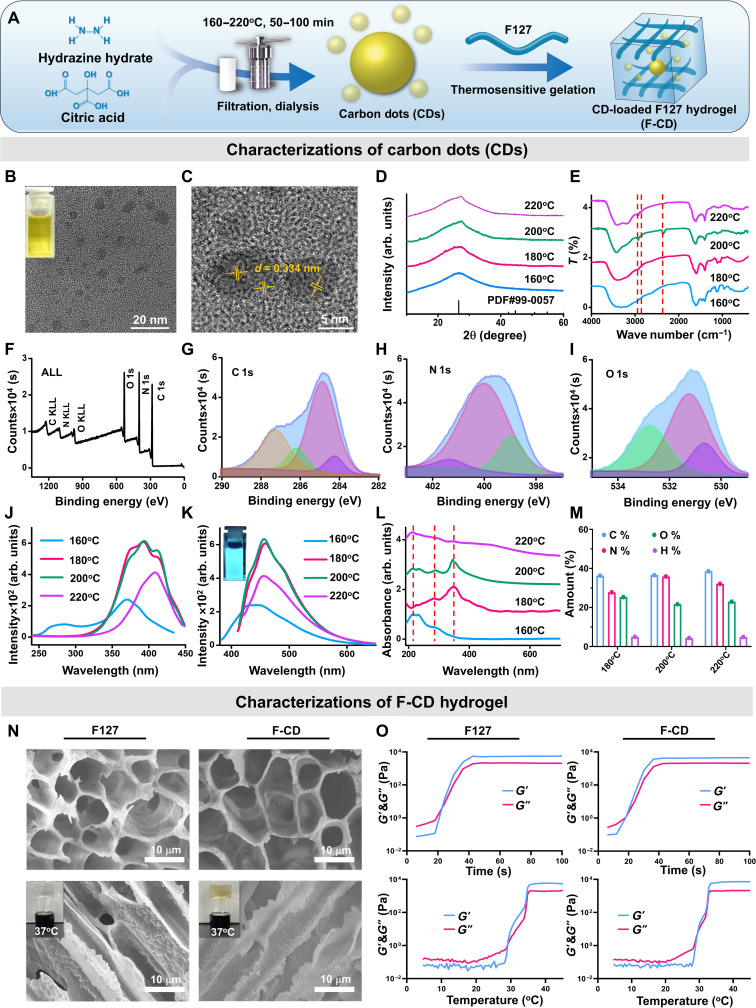
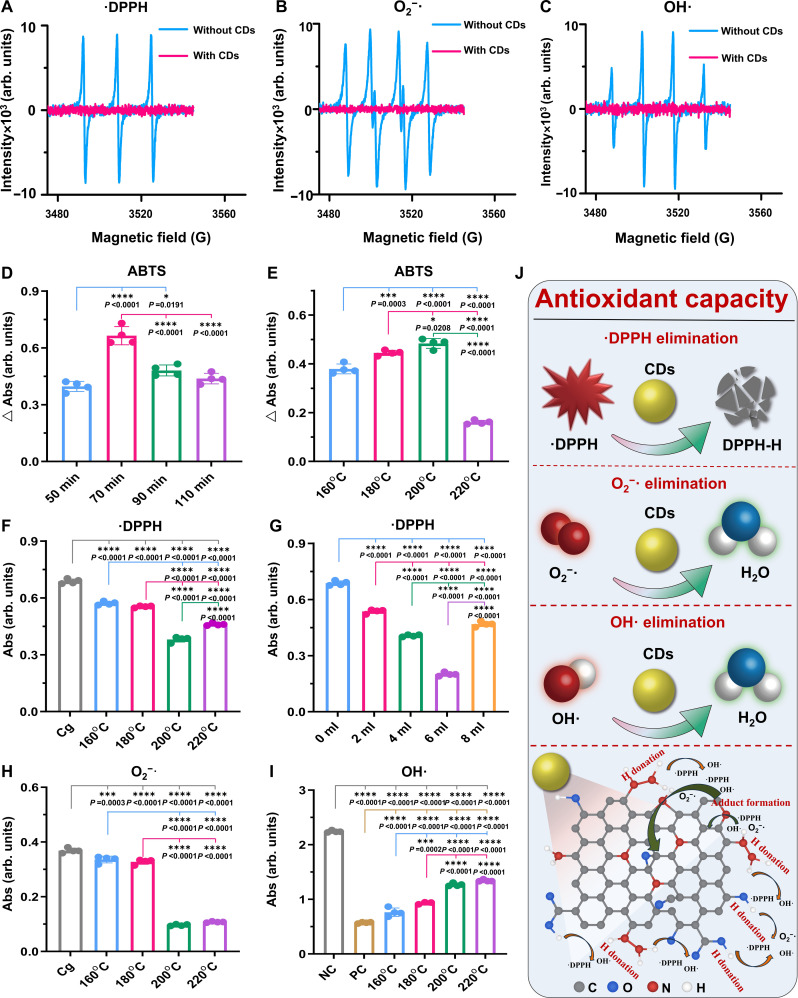
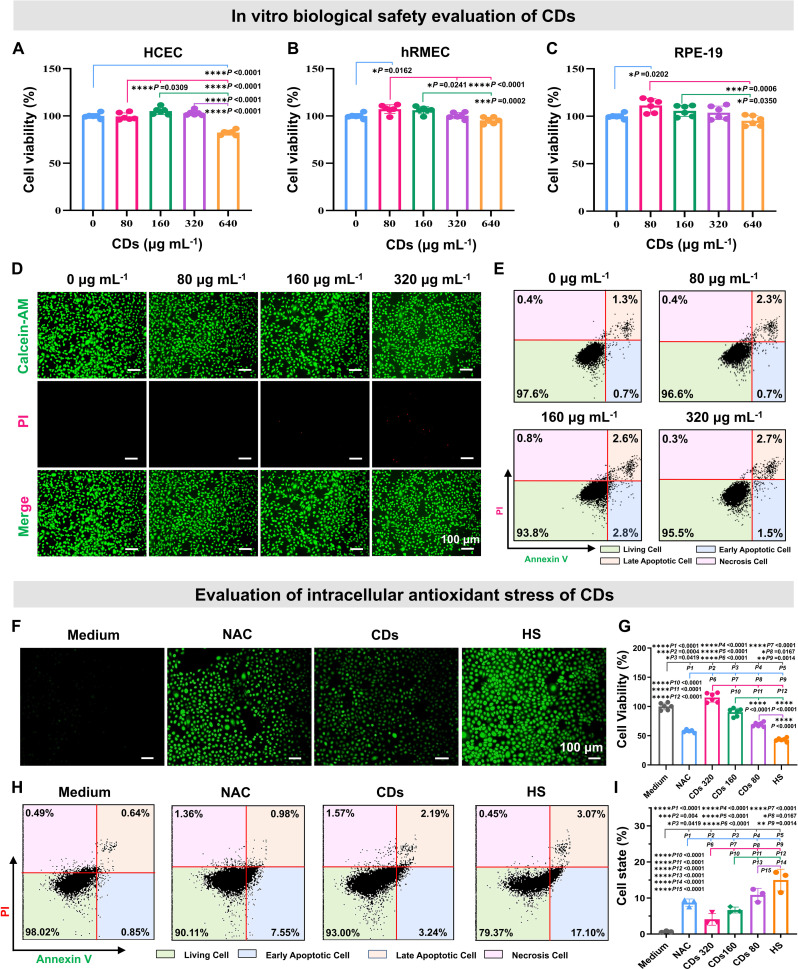
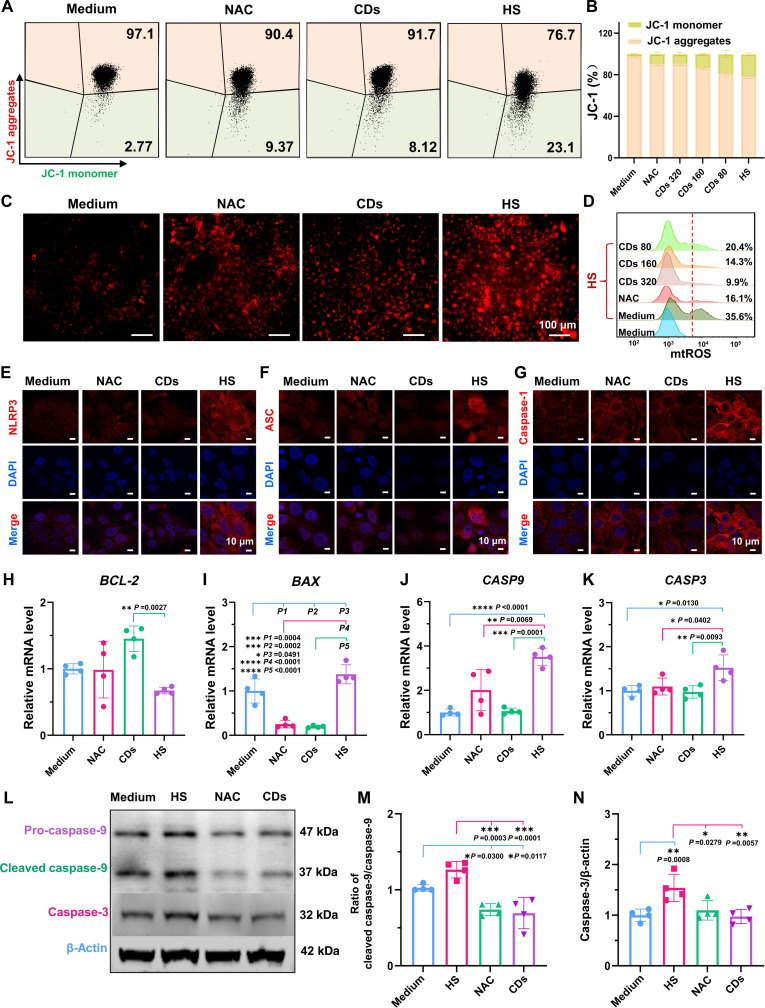
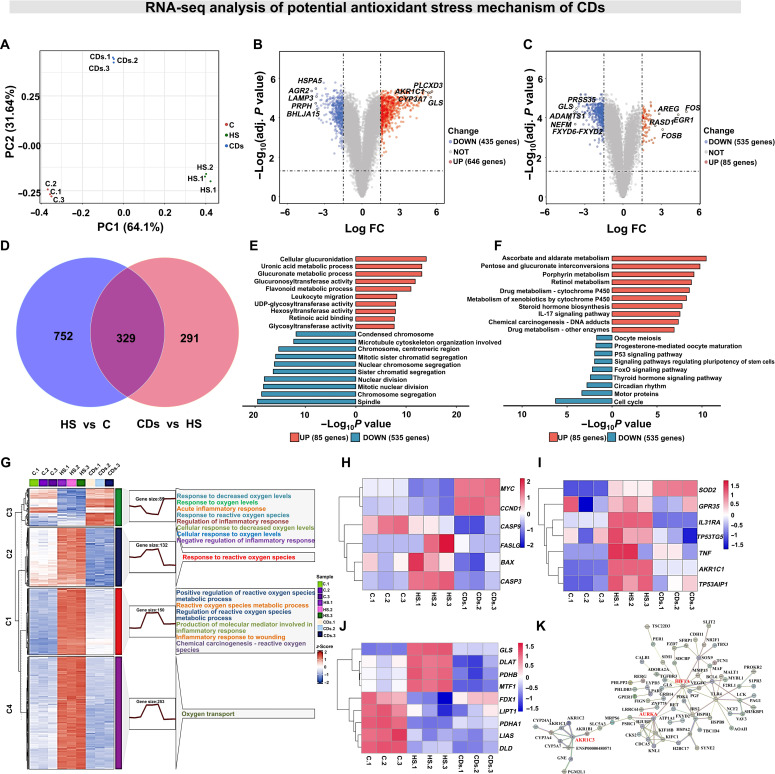
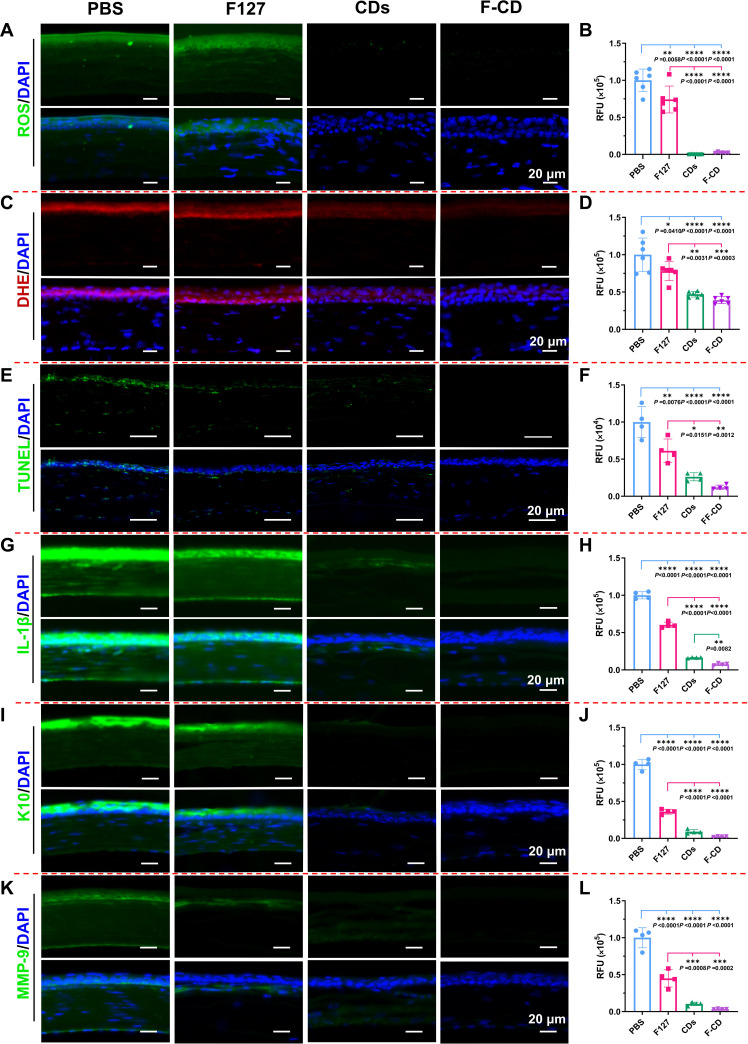
Oxidative stress, an imbalance between the body's oxidative and antioxidant systems, contributes markedly to the development of numerous ocular surface diseases, particularly dry eye disease (DED). Effective elimination or reduction of reactive oxygen species (ROS) can halt disease progression and alleviate symptoms. This study presents an innovative thermoresponsive, metal-free carbon nanodot (CD) hydrogel, termed F-CD hydrogel, which exhibits potent neutralization capabilities against multiple free radicals, including OH·, O2-·, and ·DPPH. This hydrogel demonstrates remarkable antioxidant, anti-inflammatory, and antiapoptotic capacity, effectively relieving DED symptoms by eliminating ROS at their source. Furthermore, its thermosensitive characteristics enhance the adherence of CDs to the ocular surface. In mouse models of DED, the F-CD hydrogel accelerates epithelial repair, thickens the corneal epithelium, promotes tear secretion, and boosts goblet cell count by up-regulating protective genes while suppressing those promoting apoptosis and oxidative stress. Coupled with its excellent biocompatibility and reduced administration frequency and treatment duration, the F-CD hydrogel emerges as a promising therapeutic approach for DED.


Figures

Fig. 1.
Fig. 1.. Schematic diagram.
Synthesis, application, and potential action mechanism of CDs/F-CD in DED mice.
Fig. 2.
Fig. 2.. Characterization of CDs obtained under different conditions.
(A) Schematic diagram of the synthesis of CDs/F-CD. (B and C) TEM and HRTEM images of CDs (200°C, 70 min, 6 ml of NH2NH2). (D) X-ray diffraction patterns of CDs synthesized at different temperatures. (E) FTIR spectra of CDs synthesized at different temperatures. (F to I) XPS spectra of CDs (200°C, 70 min, 6 ml of NH2NH2). (J and K) Excitation and emission spectra of CDs synthesized at different temperatures [inset in (K) is the photo of the CD dispersion obtained at 200°C under the irradiation of 365-nm UVA]. (L) UV-vis spectra of CDs synthesized at different temperatures. (M) Elemental analysis results of the CDs obtained at different temperatures with 6 ml of NH2NH2. (N) Scanning electron microscopy images of freeze-dried F127 and F-CD hydrogel sections (inset images are the photographs of the F127 and F-CD hydrogels at different temperatures). (O) Rheological properties of F127 and F-CD hydrogels.
Fig. 3.
Fig. 3.. Evaluation of the antioxidant capacity of CDs in vitro.
(A to C) ESR spectra of CDs with the addition of ·DPPH, O2·, and OH·. (D) ABTS assay of CDs produced at 200°C for different time intervals with 6 ml of NH2NH2 added. (E) ABTS assay of CDs synthesized at different temperatures for 70 min with 6 ml of NH2NH2 added. (F) ·DPPH radical scavenging activity of CDs obtained at different temperatures. (G) ·DPPH radical scavenging activity of CDs obtained with different amounts of NH2NH2. (H) O2· radical scavenging activity of CDs produced at different temperatures. (I) OH· radical scavenging activity of the CDs synthesized at different reaction temperatures for 70 min with 6 ml of NH2NH2. [(D) to (I)] Means ± SD, n = 4, one-way ANOVA multiple comparison test. (J) Schematic diagram of the possible interaction between CDs and various free radicals.
Fig. 4.
Fig. 4.. In vitro cell evaluation of CDs.
(A to E) Cell viability of different cells following incubation with CDs at different concentrations. (A) HCECs. (B) hRMECs. (C) ARPE-19 cells. (A to C) Means ± SD, n = 6, one-way ANOVA multiple comparison test. (D) Calcein-AM/PI double staining of HCECs after incubation with CDs (n = 3). (E) Flow cytometric analysis of HCECs following incubation with CDs (n = 3). (F to I) Intracellular antioxidant stress evaluation of CDs. (F) Representative images of ROS of HCECs cultured in hypertonic medium with CDs at different concentrations (n = 3). (G) Cell viability of HCECs in hypertonic medium after incubation with CDs at different concentrations (means ± SD, n = 6, one-way ANOVA multiple comparison test). (H) Flow cytometric analysis of HCECs in hypertonic medium following incubation with CDs at different concentrations (n = 3). (I) Statistic data of the early apoptotic cell in flow cytometric analysis (means ± SD, n = 3, one-way ANOVA multiple comparison test).
Fig. 5.
Fig. 5.. In vitro intracellular antioxidant stress mechanism of CDs.
(A and B) Mitochondrial membrane potential of HCECs treated with different reagents using flow cytometry (n = 3). (C and D) Mitochondrial ROS analysis using MitoSOX Red Assay (n = 3). (E to G) Immunofluorescent data on NLRP3/ASC/caspase-1 inflammasomes in HCECs exposed to different media (n = 3). (H to K) Expression levels of BCL2 (H), BAX (I), CASP9 (J), and CASP3 (K) in HCECs in hypertonic medium using qRT-PCR (means ± SD, n = 3, one-way ANOVA multiple comparison test). (L to N) Apoptosis-associated protein expressions in HCECs in hypertonic medium via Western blotting (means ± SD, n = 3, one-way ANOVA multiple comparison test). (L) Scanned blots. (M) Ratio of cleaved caspase-9/caspase-9 in different groups. (N) Relative density of caspase-3 in different groups.
Fig. 6.
Fig. 6.. Overview of RNA-seq analysis.
(A) PCA dimensionality reduction analysis. (B) Volcano plot of DEGs between the HS group and the control (C) group and (C) between the CD group [CDs (320 μg ml−1)] and the HS group, where red represents notably up-regulated genes and blue indicates substantially down-regulated genes (|log2FC| > 1.5 and adjusted P value <0.05). (D) Venn diagram showing DEGs between the HS group, control group, and CD group [CDs (320 μg ml−1)]. Top 10 GO and KEGG functional annotations of the 620 DEGs between the CD and HS groups are shown in (E) and (F), respectively. (G) Tripartite graph with the left panel showing a heatmap of the 620 genes clustered into four distinct gene clusters (C1 to C4) using the Mfuzz algorithm, the middle section depicting expression trends of different gene clusters across various groups, and the right panel showing functional annotations in GO and KEGG for these clusters. (H) Expression levels of apoptosis-related genes. (I) Inflammation-related genes. (J) CRGs after different treatments. (K) Protein-protein interaction network analysis for the genes of C1 cluster as shown in (G).
Fig. 7.
Fig. 7.. Therapeutic effect of CDs on BAC-induced DED mice.
(A) Simple schematic of the creation of DED mouse model and intervention of the CDs or F-CD hydrogel. (B) Fluorescein staining images representative of various groups at different time intervals (25× magnification). The orange arrow indicates the plaque defect, while white arrow points to the dot defect (n = 5). (C) Clinical score of DED mice under different treatments (means ± SD, n = 5, one-way ANOVA multiple comparison test). (D) Tear secretion of DED mice under different treatments (means ± SD, n = 5, one-way ANOVA multiple comparison test). (E) AS-OCT images of day 3 mice with different treatments (n = 5). The orange arrow refers to the defect, while the white arrows refer to the scar. (F) Representative H&E staining images of corneal tissue. The corneal epithelial layer is outlined by a yellow dotted line (n = 5). (G) Statistical analysis of the corneal epithelium thickness (means ± SD, n = 5, one-way ANOVA multiple comparison test). (H) Typical PAS staining images of conjunctival tissue. The yellow arrow indicates the PAS+ goblet cell. (I) Quantitative analysis of the number of goblet cells (means ± SD, n = 5, one-way ANOVA multiple comparison test).
Fig. 8.
Fig. 8.. Evaluations of the antioxidative, anti-inflammatory, antiapoptosis, and antikeratinization effects of CDs or F-CD in the corneal tissue.
(A and B) Oxidative stress (ROS), (C and D) DHE, (E and F) apoptosis (TUNEL), (G and H) IL-1β, (I and J) K10, and (K and L) MMP-9 [means ± SD, n ≥ 4, one-way ANOVA multiple comparison test; the absence of a P value indicates that there is no statistically significant difference among the groups (P > 0.05)].
Fig. 9.
Fig. 9.. In vivo long-term biocompatibility evaluation of CDs.
(A and C) H&E-stained histopathological images of the cornea and retina following 2 weeks of consecutive instillation. (B) Statistical analysis of the corneal epithelium thickness (means ± SD, n = 4, one-way ANOVA multiple comparison test). (D) Statistical analysis of the retina thickness (means ± SD, n = 4, one-way ANOVA multiple comparison test). (E and F) Statistical analysis of the a-wave and b-wave of ERG results (means ± SD, n ≥ 3, one-way ANOVA multiple comparison test). (G to O) Blood routine (G to K) and biochemical analyses (L to O) of the mice in the normal group and CD-treated group on the 14th day (n = 6, two-way ANOVA multiple comparison test). (P) H&E staining of the various organs of the mice treated with CDs (n = 3).

Similar articles

References

    1. Böhm E. W., Buonfiglio F., Voigt A. M., Bachmann P., Safi T., Pfeiffer N., Gericke A., Oxidative stress in the eye and its role in the pathophysiology of ocular diseases. Redox Biol. 68, 102967 (2023). - PMC - PubMed
    1. Stapleton F., Alves M., Bunya V. Y., Jalbert I., Lekhanont K., Malet F., Na K. S., Schaumberg D., Uchino M., Vehof J., Viso E., Vitale S., Jones L., TFOS DEWS II epidemiology report. Ocul. Surf. 15, 334–365 (2017). - PubMed
    1. Han K., Ju M. J., Kim D. H., Choi Y. H., Environmental exposures to lead, cadmium, and mercury and pterygium in Korean adults. Environ. Sci. Pollut. Res. Int. 29, 55058–55068 (2022). - PubMed
    1. Zicari A. M., Brindisi G., Castro G. D., Lollobrigida V., Nebbioso M., Duse M., Is oxidative stress involved in vernal keratoconjunctivitis? Results from a pilot study in children. Pediatr. Allergy Immunol. 31, 52–56 (2020). - PubMed
    1. Liu R., Ma R., Yan X., Balanced activation of Nrf-2/ARE mediates the protective effect of sulforaphane on keratoconus in the cell mechanical microenvironment. Sci. Rep. 14, 6937 (2024). - PMC - PubMed