. 2025 Jul 25;11(30):eadi2370.
doi: 10.1126/sciadv.adi2370. Epub 2025 Jul 25.

Human iPSC-based breast cancer model identifies S100P-dependent cancer stemness induced by BRCA1 mutation

Affiliations

Human iPSC-based breast cancer model identifies S100P-dependent cancer stemness induced by BRCA1 mutation

Jingxin Liu et al. Sci Adv. .

Abstract

Breast cancer is the most common malignancy in females and remains the leading cause of cancer-related deaths for women worldwide. The cellular and molecular basis of breast tumorigenesis is not completely understood partly due to the lack of human research models which simulate the development of breast cancer. Here, we developed a method for generating functional mammary-like cells (MCs) from human-induced pluripotent stem cells (iPSCs). The iPSC-MCs closely resemble human primary MCs at cellular, transcriptional, and functional levels. Using this method, a breast cancer model was generated using patient-derived iPSCs harboring germline BRCA1 mutation. The patient iPSC-MCs recapitulated the transcriptome, clinical genomic alteration, and tumorigenic ability of breast cancer cells. We also identified S100P as an oncogene downstream of mutated BRCA1 that promotes cancer cell stemness and tumorigenesis. Our study establishes a promising system of breast cancer for studying the mechanism of tumorigenesis and identifying potential therapeutic targets.


Figures
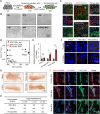
Fig. 1.
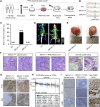
Fig. 1.. Establishment of method to generate iPSC-derived mammary cells with function in vitro and in vivo.
(A) Schematic representation of the differentiation protocol from D0 to D40. MaSC, mammary stem cells. (B) Representative images of the cell morphology during mammary differentiation. Scale bar, 50 μm. (C) Immunofluorescence staining of basal cell marker (CK5, red), luminal cell marker (CK8, green), and 4′,6-diamidino-2-phenylindole (DAPI; blue) in iPSC-MCs and primary-MCs. Scale bars, 300 μm. (D) PCA was performed to compare the expression profiles of iPSC-MCs derived from normal human iPSCs and cells of other tissues of ectodermal origin, including primary-MCs, keratinocytes (KC), visceral adipose (VA), subcutaneous adipose (SA), retinal pigment epithelial (RPE), airway epithelial cells (AEC), primary brain pericytes (BPC), primary human nasal epithelial cells (HNEpC), and human embryonic stem cell line (H9). Data used in this analysis are shown in table S6. (E) RT-qPCR assay for expression of β-casein in iPSCs, primary-MCs, and iPSC-MCs with and without prolactin treatment. Error bars represent ±SD; t test, two-tailed; n = 6 (iPSCs), n = 3 (iPSC-MCs and primary-MCs) distinct samples. P values (left to right): P = 0.6046, P = 0.0379, and P = 0.0033. (F) Immunofluorescence staining for β-casein (red) and DAPI (blue) in iPSCs (left) and organoids derived from iPSC-MCs (middle) and primary-MCs (right) with and without prolactin treatment. Scale bar, 10 μm. (G) Carmine-stained whole-mount examination of outgrowth from xenografts in humanized fat pads inoculated with iPSC-MCs, iPSCs, and primary-MCs. Scale bar, 1 mm. (H) Number of outgrowths generated in NOD-SCID mouse fat pads inoculated with cells from different subpopulations. (I) Immunofluorescence staining for human leukocyte antigen–ABC (HLA-ABC, red), myoepithelial cell marker (CK5, purple), luminal epithelial cell marker (CK8, green), and DAPI (blue) in the two-layer ducts generated by primary-MCs (top) and iPSC-MCs (middle) and in mouse mammary tissue (bottom). Scale bar, 50 μm. ns, not significant; NA, not available.
Fig. 2.
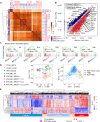
Fig. 2.. BRCA1 mutation induces tumorigenesis in the iPSC-based disease model.
(A) Schematic overview of patient-derived iPSC-mammary cell subcutaneous injection into NOD-SCID mice. OSKM, OCT4, SOX2, KLF4, and MYC. (B) Sequencing map showing the exact site of BRCA1 mutation (BRCA1mut) and the correction of the BRCA1 mutation (BRCA1cor). (C) Tumor xenograft experiments by subcutaneous injection into mice demonstrate that patient-derived iPSC-MC but not WT and mutant-corrected iPSC-MC recapture in vivo tumorigenic ability. (D) Representative 18F-FDG PET/CT images of mice injected with WT iPSC-MC and patient-derived iPSC-MC. (E) Representative images of actual tumors formed by MAB-231 and patient-derived iPSC-MC. (F) Representative hematoxylin and eosin (H&E) staining of patient tumor tissue, tumor tissue formed by patient-derived iPSC-MC, and normal breast tissue. Scale bar, 50 μm. The right images show higher magnification of the cell. Scale bar, 50 μm. (G) Representative Ki67 and P120 staining of patient tumor tissue and tumor tissue formed by patient-derived iPSC-MC. Scale bar, 50 μm. (H) PCCs were measured between the iPSC-MCs-tumor and TCGA cancer samples. TPMs of all genes for iPSC-MCs-tumor and top expressed gene for TCGA cancer samples are used for analysis. Cancer types abbreviated per TCGA Cancer Codes. (I) Representative ER, PR, and HER2 staining of patient tumor tissue and tumor tissue formed by patient-derived iPSC-MC. Scale bar, 50 μm.
Fig. 3.
Fig. 3.. BRCA1-mutant iPSC-MCs exhibit the BRCA1-related breast cancer gene signature.
(A) Correlation matrix of BRCA1-mutant, BRCA1-mutant corrected, and WT iPSC mammary differentiation time course based on the TPM of all genes expressed. (B) Scatterplot presenting the values of TPM for each gene in the BRCA1-mutant samples (x axis) versus the control samples (y axis). Purple dots mark genes associated with breast cancer pathways (n = 4 or 6, two clones, two to three replicates each clone). (C) Gene set enrichment analysis (GSEA) results showing the enrichment of breast cancer–associated genes in BRCA1-mutant samples versus control samples during mammary differentiation time course (n = 4 or 6, two to three clones, two replicates each clone). NES, normalized enrichment score. (D) PCA was performed to compare the expression profiles of iPSC-MCs, iPSC-MCs-tumor, breast tumor (TCGA), para-carcinoma tissue (from Genotype-Tissue Expression Project, GTEx), and normal breast tissue (GTEx). (E) Hierarchical clustering of TCGA-BRCA samples and iPSC-MCs-tumor on the basis of PAM50 gene expression.
Fig. 4.
Fig. 4.. Clinically correlated mutations can be mimicked in the iPSC-based disease model.
(A) Schematic overview of WES in iPSC-based disease model. (B) Number of somatic mutations as nonsynonymous single-nucleotide variant (SNV) detected in iPSCs (left) and iPSC-MCs (right) with BRCA1-mutant and BRCA1-mutant corrected. (C) Number of SNV and insertion/deletion mutation (INDEL) detected in BRCA1-mutant iPSC-MCs and iPSC-MCs-tumor. (D) Circos plot showing the chromosome-wide codistribution of mutations in iPSC-MCs-tumor (purple) and clinical BRCA1-mutant breast tumor (green). The clinical mutation data were from cBioPortal. Hypergeometric test, P values (left to right): P = 0.0021, P = 0.038, and P = 7.72 × 10⁻²⁷. (E) Landscape showing enrichment of nonrecurrent and recurrent clinical mutation in the iPSC-based disease model. Hypergeometric test, P values (left to right): P = 0.0064, P = 0.561, P = 5.84 × 10−06, and P = 0.033. The clinical mutation data were from cBioPortal.
Fig. 5.
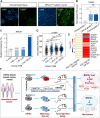
Fig. 5.. BRCA1 mutation promotes tumorigenesis by activating S100P.
(A) Overlap of genes up-regulated at D30 and D40 in BRCA1-mutant iPSC-MCs compared to control iPSC-MCs [fold change (FC) > 2, P < 0.05]; (n = 4 or 6, two clones, two to three replicates each clone). (B) Heatmap of mRNA expression of genes identified in (A). (C) Overlap of the 268 genes identified in (A) with genes overexpressed in breast cancer (BC; left). Heatmap of mRNA expression of 26 genes plotted by log2 (TPM + 1) in breast tumor relative to normal breast tissue (right), data from GEPIA2 [FC > 2, q value < 0.01, analysis of variance (ANOVA) test]. (D) S100P mRNA level in normal and BRCA1-mutant breast tumor. Data from TCGA; Wilcox test; n = 678 (normal), n = 300 (tumors); P = 0.002. (E) Representative pictures demonstrating tumors formed by BRCA1-mutant iPSC-MCs in mouse mammary fat pad with/without S100P knockdown. EV, empty vector. (F and G) Histogram showing the weight (F) and volume (G) of formed tumors in (E). Error bars represent ±SD; n = 6 to 8 samples. (H) Images of subcutaneous MDA-MB-231 tumors with/without S100P knockdown and inhibitor treatment. (I) Histogram showing the weight of formed tumors in (H) (±SD; n = 5 to 6 tumors). t test, two-tailed; P values (left to right): P = 0.0267, P = 0.0099, and P = 0.0289. (J) Negative correlation between S100P and BRCA1 mRNA expression during mammary differentiation (n = 4, two clones, two replicates each clone). (K) RT-qPCR showing an increase of S100P expression induced by BRCA1 knockdown in MCF10A cells (±SD; n = 3 distinct samples). t test, two-tailed; P values (left to right): P = 0.00009 and P = 0.0166. (L) RT-qPCR showing BRCA1 and S100P expression in MCF10A cells transiently transfected with BRCA1 and empty vectors (±SD; n = 3 distinct samples). t test, one-tailed; P values (left to right): P = 0.0101, P = 0.0167, P = 0.0311, and P = 0.0041. (M) ChIP-qPCR showing BRCA1 binding on S100P promoter after shEV or shBRCA1 (±SD; n = 3 distinct samples). COMT and NQO1 were negative and positive controls, respectively. t test, two-tailed; P values (left to right): P = 0.4871, P = 0.0002, and P = 0.0070. IgG, immunoglobulin G.
Fig. 6.
Fig. 6.. S100P activates stemness in BRCA1-deficient iPSC-based disease model.
(A to C) Enrichment pattern of hESC-associated genes (A), breast CSC-associated genes (B), and pluripotent transcriptional factors (TFs) (C) during mammary differentiation. (n = 4 or 6, two clones, two to three replicates each clone). (D) RT-qPCR showing expression of stemness genes in ectopic expression of S100P (S100P-OE) and EV (empty vector) MCF10A cells (±SD; n = 3 distinct samples). t test, two-tailed; P values (left to right): P = 0.00008, P = 4.715 × 10−06, P = 0.0052, P = 0.00003, P = 1.507 × 10−07, and P = 0.0004. (E) Proportion of ALDH1+ mammary cells induced by S100P-OE in MCF10A cells (±SD; n = 3 distinct samples). t test, two-tailed; P = 0.00004. DEAB, N,N-diethylaminobenzaldehyde. (F) Number of mammospheres formed by EV or S100P-OE MCF10A cells (±SD; n = 3 distinct samples). t test, two-tailed; P = 0.0070. (G) RT-qPCR assay showing the expression of OCT4, SOX2, and NANOG in shBRCA1 and shBRCA1 + shS100P MCF10A cells (±SD; n = 3 distinct samples). t test, two-tailed; P values (left to right): P = 0.0009, P = 0.00007, and P = 0.0174. (H and I) Number of colonies (H) and mammospheres (I) formed by MCF10A cells with shEV, shBRCA1, shS100P, and shBRCA1 + shS100P. Error bars represent ±SD; n = 3 distinct samples. t test, two-tailed; P values (left to right): P = 0.0125, P = 0.0008, P = 0.0001, P = 0.0001, P = 0.0094, and P = 0.0205. (J) Proportion of CD44+ CD24 mammary cells in MCF10A cells with shEV, shBRCA1, shS100P, and shBRCA1 + shS100P (±SD; n = 3 distinct samples). P values (left to right): P = 0.0024, P = 0.0179, and P = 0.0097. (K) RT-qPCR assay showing OCT4, NANOG, KLF4, and c-MYC expression in BRCA1-mutant iPSC-MCs with or without S100P knockdown (±SD; n = 3 distinct samples). C1 denotes clone 1, and C2 denotes clone 2. t test, one-tailed; P values (left to right): P = 2.321 × 10−05, P = 0.00014, P = 0.0016, P = 1.8270 × 10−05, P = 1.2077 × 10−05, P = 1.2883 × 10−05, P = 2.230 × 10−05, P = 1.3269 × 10−05, P = 0.0007, P = 1.6747 × 10−05, P = 0.0009, P = 0.0002, P = 0.0098, P = 0.0091, P = 0.0108, and P = 0.0023. (L) Representative pictures demonstrating the CD44+ CD24 population in BRCA1-mutant iPSC-MCs with or without S100P knockdown (S100P-KD). (M) Proportion of CD44+ CD24 cell was reduced by S100P-KD in BRCA1-mutant iPSC-MCs (±SD; n = 3 distinct samples). t test, one-tailed; P values (left to right): P = 4.3983 × 10−05, P = 5.4594 × 10−05, P = 0.0019, and P = 0.0203.
Fig. 7.
Fig. 7.. Clinical analysis reveals an association of S100P and BRCA1 in tumorigenesis.
(A) S100P expression in clinical normal breast tissue and breast tumor with BRCA1 mutation. (B) Boxplot showing S100P expression in breast tumors with different histologic grades. n = 6 grade 1 samples, n = 23 grade 2 samples, and n = 19 grade 3 samples. t test, two-tailed; P values (left to right): P = 0.006, P = 0.042, and P = 1.000. Analysis was made on the basis of published data (64). (C) Histogram showing mutation frequency of BRCA1 in breast tumors with different tumor mutation burden (TMB). n = 247, n = 235, n = 243, and n = 236 (left to right). Data from cBioPortal. (D) Boxplot showing S100P expression in breast tumors with different TMB. n = 247, n = 235, n = 243, and n = 236 (left to right). t test, two-tailed; P values (left to right): P = 0.00097, P = 1.56 × 10−06, P = 8.76 × 10−09, P = 0.174, P = 0.030, and P = 0.4310. Data from cBioPortal. (E) Heatmap showing the expression of S100P and BRCA1 in non–CSC-high (HMLER) or CSC-high (BPLER) breast cancer cell lines. Data from GSE131631. (F) iPSCs from breast cancer family were directed to differentiation toward mammary cells, during which the BRCA1 mutation–induced breast tumorigenesis process can be simulated. In terms of mechanism, we found that BRCA1 mutation–induced carcinogenesis is related to the activation of S100P. In WT iPSC-MCs, BRCA1 inhibits the expression of S100P in a targeted manner. In the BRCA1 mutation group, the increased expression of S100P promotes breast cell carcinogenesis by enhancing stemness gene expression. hiPSC, human-induced pluripotent stem cell.

References

    1. Bray F., Ferlay J., Soerjomataram I., Siegel R. L., Torre L. A., Jemal A., Global cancer statistics 2018: GLOBOCAN estimates of incidence and mortality worldwide for 36 cancers in 185 countries. CA Cancer J. Clin. 68, 394–424 (2018). - PubMed
    1. Sung H., Ferlay J., Siegel R. L., Laversanne M., Soerjomataram I., Jemal A., Bray F., Global cancer statistics 2020: GLOBOCAN estimates of incidence and mortality worldwide for 36 cancers in 185 countries. CA Cancer J. Clin. 71, 209–249 (2021). - PubMed
    1. Greaves M., Evolutionary determinants of cancer. Cancer Discov. 5, 806–820 (2015). - PMC - PubMed
    1. Ben-David U., Beroukhim R., Golub T. R., Genomic evolution of cancer models: Perils and opportunities. Nat. Rev. Cancer 19, 97–109 (2019). - PMC - PubMed
    1. Wang Y., Ye F., Liang Y., Yang Q., Breast cancer brain metastasis: Insight into molecular mechanisms and therapeutic strategies. Br. J. Cancer 125, 1056–1067 (2021). - PMC - PubMed